

Key Insights
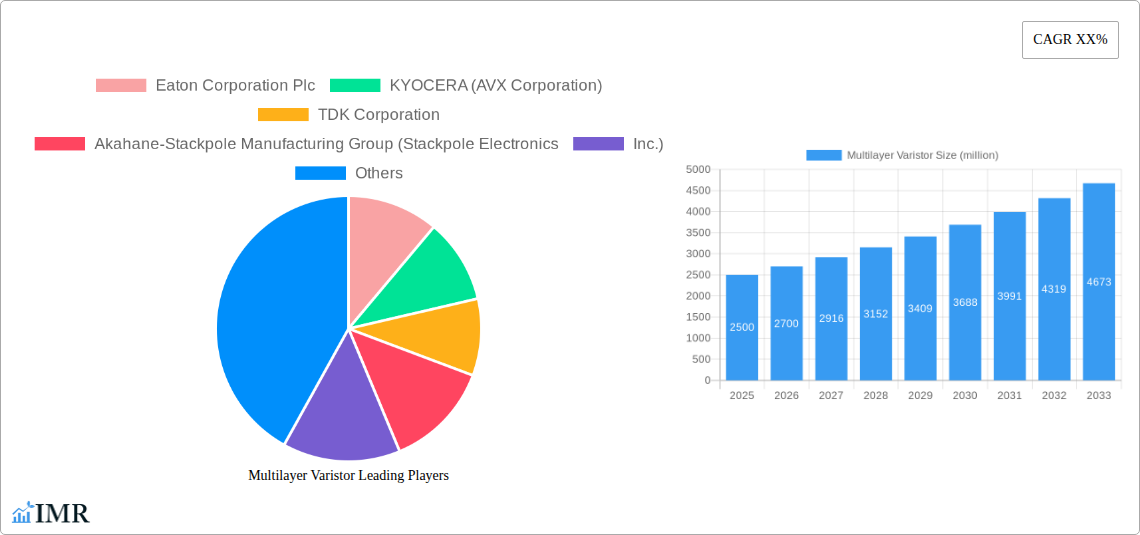
The global multilayer varistor (MLV) market is experiencing robust growth, driven by increasing demand across diverse sectors. The surge in adoption of electronic devices, particularly in automotive, industrial automation, and renewable energy applications, is a primary catalyst. Miniaturization trends in electronics are further fueling the demand for smaller, more efficient MLVs, which provide crucial surge protection. The market is expected to maintain a healthy compound annual growth rate (CAGR) of approximately 8% between 2025 and 2033, expanding significantly from an estimated $2.5 billion in 2025 to over $4.5 billion by 2033. Key market players, including Eaton, KYOCERA AVX, TDK, and Vishay Intertechnology, are investing heavily in R&D to develop advanced MLV technologies with enhanced performance and reliability. This is reflected in the introduction of MLVs with higher surge current capabilities, improved temperature stability, and smaller form factors. However, market growth faces some restraints, primarily related to the increasing cost of raw materials and potential supply chain disruptions. Nevertheless, the overall outlook remains positive, with considerable opportunities for growth across different geographic regions, driven by industrialization and infrastructure development.
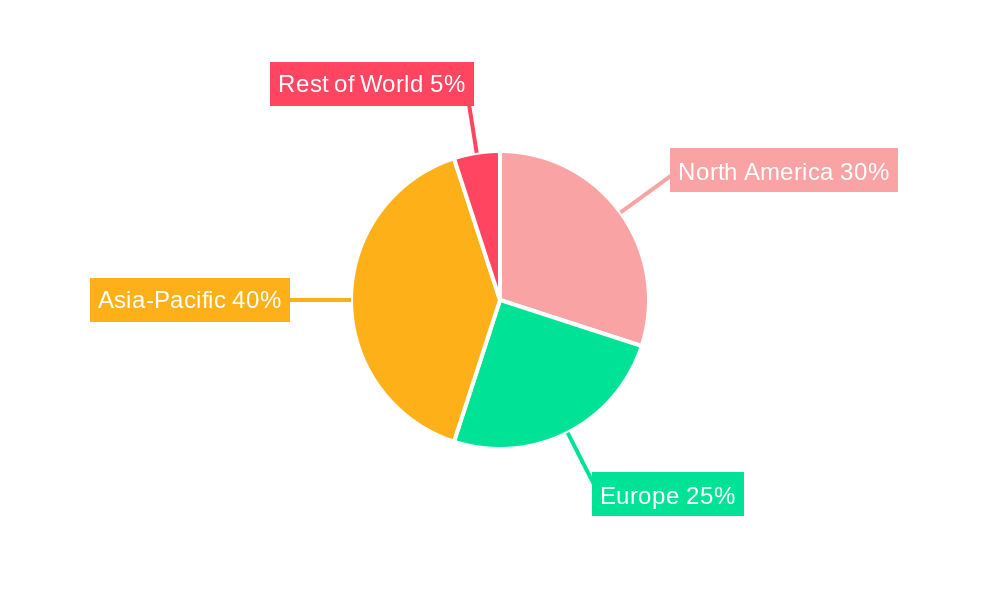
The segmentation of the MLV market highlights various product types and applications. While precise data on segment-specific market shares isn't available, it's reasonable to assume that automotive and industrial applications constitute the largest segments, collectively accounting for over 60% of the market. Regional growth will likely be strongest in Asia-Pacific, driven by rapid industrialization and substantial electronics manufacturing in countries like China and India. North America and Europe will continue to maintain substantial market share, driven by the strong presence of key manufacturers and advanced electronics adoption. Future market developments are likely to be influenced by technological advancements, focusing on the integration of MLVs with other protective components and the development of smart grid applications requiring robust surge protection. Competitive strategies among key players will continue to focus on innovation, product differentiation, and expanding market reach.
Multilayer Varistor Market Report: 2019-2033
This comprehensive report provides an in-depth analysis of the Multilayer Varistor (MLV) market, encompassing market dynamics, growth trends, regional analysis, product landscape, key players, and future outlook. The report covers the period from 2019 to 2033, with a base year of 2025 and a forecast period from 2025 to 2033. The market is segmented by application (Parent Market) and further sub-segmented by specific industry (Child Market), offering granular insights for strategic decision-making. The global market size is valued in millions of units.
Multilayer Varistor Market Dynamics & Structure
The Multilayer Varistor market is characterized by moderate concentration, with key players holding significant market share. Technological innovation, particularly in miniaturization and enhanced surge protection capabilities, drives market growth. Stringent safety regulations and increasing demand for reliable surge protection devices in various applications influence market dynamics. Competitive substitutes, such as metal oxide varistors (MOVs), exist but MLVs often offer superior performance in specific applications. The market shows a trend toward consolidation, evidenced by xx M&A deals in the historical period (2019-2024).
- Market Concentration: Moderately concentrated, with top 5 players holding xx% market share in 2024.
- Technological Innovation: Focus on miniaturization, improved energy absorption, and faster response times.
- Regulatory Framework: Stringent safety standards drive adoption of high-quality MLVs across various industries.
- Competitive Substitutes: MOVs and other surge protection devices pose competitive pressure, though MLVs often offer superior performance benefits.
- End-User Demographics: Diverse, spanning consumer electronics, automotive, industrial automation, and power systems.
- M&A Trends: xx M&A deals observed in the 2019-2024 period, indicating industry consolidation.
Multilayer Varistor Growth Trends & Insights
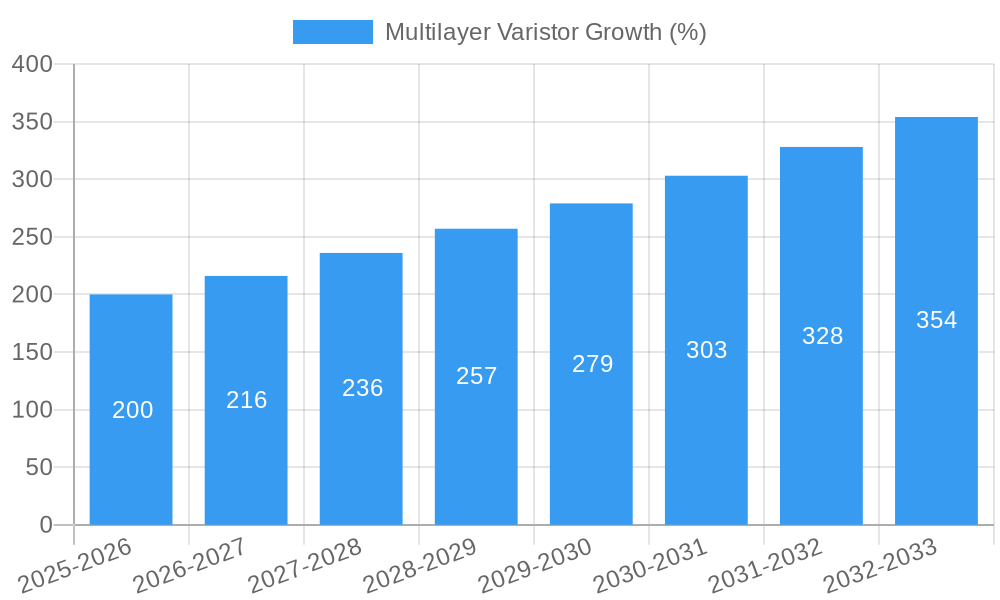
The MLV market experienced steady growth during the historical period (2019-2024), with a CAGR of xx%. This growth is attributed to increasing demand from the consumer electronics and automotive sectors. Technological advancements, particularly in higher energy absorption capacity and miniaturization, have significantly boosted adoption rates. Shifting consumer preferences towards smaller, more energy-efficient electronic devices are fueling market expansion. The market is projected to maintain growth momentum during the forecast period (2025-2033), driven by the growing adoption of renewable energy sources and the increasing demand for advanced surge protection in various applications. Market penetration is expected to reach xx% by 2033.
Dominant Regions, Countries, or Segments in Multilayer Varistor
The Asia-Pacific region dominates the global MLV market, accounting for xx% of the total market share in 2024, driven primarily by robust growth in the consumer electronics and automotive industries in countries like China, Japan, and South Korea. Favorable government policies promoting technological advancements and infrastructure development in these regions also contribute to market dominance. North America and Europe also hold significant market share.
- Key Drivers in Asia-Pacific: Strong economic growth, rapid industrialization, expanding consumer electronics market, supportive government policies.
- Dominance Factors: Large manufacturing base, high demand from electronics and automotive industries, cost-effectiveness.
- Growth Potential: Significant potential for expansion in emerging economies within Asia-Pacific and expanding into new applications.
Multilayer Varistor Product Landscape
MLVs are available in various sizes and specifications, tailored to meet specific application requirements. Recent innovations focus on enhancing energy absorption capacity, improving response times, and reducing device size. The unique selling propositions of MLVs include their superior surge protection capabilities and reliability compared to alternative technologies. Technological advancements involve incorporating novel materials and optimizing manufacturing processes to enhance performance and reduce costs.
Key Drivers, Barriers & Challenges in Multilayer Varistor
Key Drivers:
- Increasing demand for surge protection in electronic devices.
- Growth in renewable energy adoption requiring enhanced surge protection.
- Advancements in miniaturization and energy absorption capabilities.
Challenges and Restraints:
- Supply chain disruptions impacting raw material availability and pricing.
- Stringent regulatory requirements increasing compliance costs.
- Intense competition from alternative surge protection devices. This competition leads to pricing pressure and limits profit margins by approximately xx% annually.
Emerging Opportunities in Multilayer Varistor
- Expanding into untapped markets such as smart grids and IoT devices.
- Development of MLVs with enhanced performance characteristics for high-power applications.
- Exploring new materials and designs to improve efficiency and cost-effectiveness.
Growth Accelerators in the Multilayer Varistor Industry
Technological breakthroughs in materials science and manufacturing processes are key growth accelerators. Strategic partnerships between MLV manufacturers and end-users, facilitating joint development and customized solutions, are also driving growth. Expansion into new applications and geographic markets, particularly in emerging economies, offer substantial growth opportunities.
Key Players Shaping the Multilayer Varistor Market
- Eaton Corporation Plc
- KYOCERA (AVX Corporation)
- TDK Corporation
- Akahane-Stackpole Manufacturing Group (Stackpole Electronics,Inc.)
- Littelfuse,Inc.
- INPAQ Technology Co.,Ltd.
- Vishay Intertechnology,Inc
- SFI Electronics Technology Inc
- Cham How Corporation
- KOA Speer Electronics,Inc.
- Bourns,Inc.
- Thinking Electronic Industrial Co.,Ltd.
Notable Milestones in Multilayer Varistor Sector
- 2020: Introduction of a new generation of miniaturized MLVs by Vishay Intertechnology.
- 2022: Strategic partnership between Eaton and a major automotive manufacturer to develop customized MLVs.
- 2023: Acquisition of a smaller MLV manufacturer by TDK Corporation, expanding their market share.
In-Depth Multilayer Varistor Market Outlook
The MLV market is poised for sustained growth driven by technological innovation, increasing demand from various industries, and expansion into new applications and markets. Strategic investments in R&D, strategic partnerships, and effective marketing strategies will be crucial for companies to capitalize on the significant market opportunities and maintain a competitive edge in this dynamic industry.
Multilayer Varistor Segmentation
-
1. Application
- 1.1. Automotive
- 1.2. Industrial
- 1.3. Energy & Power
- 1.4. Others
-
2. Types
- 2.1. 0420
- 2.2. 0603
- 2.3. 0805
- 2.4. 1206
- 2.5. 1210
- 2.6. Above 1210
Multilayer Varistor Segmentation By Geography
-
1. North America
- 1.1. United States
- 1.2. Canada
- 1.3. Mexico
-
2. South America
- 2.1. Brazil
- 2.2. Argentina
- 2.3. Rest of South America
-
3. Europe
- 3.1. United Kingdom
- 3.2. Germany
- 3.3. France
- 3.4. Italy
- 3.5. Spain
- 3.6. Russia
- 3.7. Benelux
- 3.8. Nordics
- 3.9. Rest of Europe
-
4. Middle East & Africa
- 4.1. Turkey
- 4.2. Israel
- 4.3. GCC
- 4.4. North Africa
- 4.5. South Africa
- 4.6. Rest of Middle East & Africa
-
5. Asia Pacific
- 5.1. China
- 5.2. India
- 5.3. Japan
- 5.4. South Korea
- 5.5. ASEAN
- 5.6. Oceania
- 5.7. Rest of Asia Pacific
Multilayer Varistor REPORT HIGHLIGHTS
| Aspects | Details |
|---|---|
| Study Period | 2019-2033 |
| Base Year | 2024 |
| Estimated Year | 2025 |
| Forecast Period | 2025-2033 |
| Historical Period | 2019-2024 |
| Growth Rate | CAGR of XX% from 2019-2033 |
| Segmentation |
|
Table of Contents
- 1. Introduction
- 1.1. Research Scope
- 1.2. Market Segmentation
- 1.3. Research Methodology
- 1.4. Definitions and Assumptions
- 2. Executive Summary
- 2.1. Introduction
- 3. Market Dynamics
- 3.1. Introduction
- 3.2. Market Drivers
- 3.3. Market Restrains
- 3.4. Market Trends
- 4. Market Factor Analysis
- 4.1. Porters Five Forces
- 4.2. Supply/Value Chain
- 4.3. PESTEL analysis
- 4.4. Market Entropy
- 4.5. Patent/Trademark Analysis
- 5. Global Multilayer Varistor Analysis, Insights and Forecast, 2019-2031
- 5.1. Market Analysis, Insights and Forecast - by Application
- 5.1.1. Automotive
- 5.1.2. Industrial
- 5.1.3. Energy & Power
- 5.1.4. Others
- 5.2. Market Analysis, Insights and Forecast - by Types
- 5.2.1. 0420
- 5.2.2. 0603
- 5.2.3. 0805
- 5.2.4. 1206
- 5.2.5. 1210
- 5.2.6. Above 1210
- 5.3. Market Analysis, Insights and Forecast - by Region
- 5.3.1. North America
- 5.3.2. South America
- 5.3.3. Europe
- 5.3.4. Middle East & Africa
- 5.3.5. Asia Pacific
- 5.1. Market Analysis, Insights and Forecast - by Application
- 6. North America Multilayer Varistor Analysis, Insights and Forecast, 2019-2031
- 6.1. Market Analysis, Insights and Forecast - by Application
- 6.1.1. Automotive
- 6.1.2. Industrial
- 6.1.3. Energy & Power
- 6.1.4. Others
- 6.2. Market Analysis, Insights and Forecast - by Types
- 6.2.1. 0420
- 6.2.2. 0603
- 6.2.3. 0805
- 6.2.4. 1206
- 6.2.5. 1210
- 6.2.6. Above 1210
- 6.1. Market Analysis, Insights and Forecast - by Application
- 7. South America Multilayer Varistor Analysis, Insights and Forecast, 2019-2031
- 7.1. Market Analysis, Insights and Forecast - by Application
- 7.1.1. Automotive
- 7.1.2. Industrial
- 7.1.3. Energy & Power
- 7.1.4. Others
- 7.2. Market Analysis, Insights and Forecast - by Types
- 7.2.1. 0420
- 7.2.2. 0603
- 7.2.3. 0805
- 7.2.4. 1206
- 7.2.5. 1210
- 7.2.6. Above 1210
- 7.1. Market Analysis, Insights and Forecast - by Application
- 8. Europe Multilayer Varistor Analysis, Insights and Forecast, 2019-2031
- 8.1. Market Analysis, Insights and Forecast - by Application
- 8.1.1. Automotive
- 8.1.2. Industrial
- 8.1.3. Energy & Power
- 8.1.4. Others
- 8.2. Market Analysis, Insights and Forecast - by Types
- 8.2.1. 0420
- 8.2.2. 0603
- 8.2.3. 0805
- 8.2.4. 1206
- 8.2.5. 1210
- 8.2.6. Above 1210
- 8.1. Market Analysis, Insights and Forecast - by Application
- 9. Middle East & Africa Multilayer Varistor Analysis, Insights and Forecast, 2019-2031
- 9.1. Market Analysis, Insights and Forecast - by Application
- 9.1.1. Automotive
- 9.1.2. Industrial
- 9.1.3. Energy & Power
- 9.1.4. Others
- 9.2. Market Analysis, Insights and Forecast - by Types
- 9.2.1. 0420
- 9.2.2. 0603
- 9.2.3. 0805
- 9.2.4. 1206
- 9.2.5. 1210
- 9.2.6. Above 1210
- 9.1. Market Analysis, Insights and Forecast - by Application
- 10. Asia Pacific Multilayer Varistor Analysis, Insights and Forecast, 2019-2031
- 10.1. Market Analysis, Insights and Forecast - by Application
- 10.1.1. Automotive
- 10.1.2. Industrial
- 10.1.3. Energy & Power
- 10.1.4. Others
- 10.2. Market Analysis, Insights and Forecast - by Types
- 10.2.1. 0420
- 10.2.2. 0603
- 10.2.3. 0805
- 10.2.4. 1206
- 10.2.5. 1210
- 10.2.6. Above 1210
- 10.1. Market Analysis, Insights and Forecast - by Application
- 11. Competitive Analysis
- 11.1. Global Market Share Analysis 2024
- 11.2. Company Profiles
- 11.2.1 Eaton Corporation Plc
- 11.2.1.1. Overview
- 11.2.1.2. Products
- 11.2.1.3. SWOT Analysis
- 11.2.1.4. Recent Developments
- 11.2.1.5. Financials (Based on Availability)
- 11.2.2 KYOCERA (AVX Corporation)
- 11.2.2.1. Overview
- 11.2.2.2. Products
- 11.2.2.3. SWOT Analysis
- 11.2.2.4. Recent Developments
- 11.2.2.5. Financials (Based on Availability)
- 11.2.3 TDK Corporation
- 11.2.3.1. Overview
- 11.2.3.2. Products
- 11.2.3.3. SWOT Analysis
- 11.2.3.4. Recent Developments
- 11.2.3.5. Financials (Based on Availability)
- 11.2.4 Akahane-Stackpole Manufacturing Group (Stackpole Electronics
- 11.2.4.1. Overview
- 11.2.4.2. Products
- 11.2.4.3. SWOT Analysis
- 11.2.4.4. Recent Developments
- 11.2.4.5. Financials (Based on Availability)
- 11.2.5 Inc.)
- 11.2.5.1. Overview
- 11.2.5.2. Products
- 11.2.5.3. SWOT Analysis
- 11.2.5.4. Recent Developments
- 11.2.5.5. Financials (Based on Availability)
- 11.2.6 Littelfuse
- 11.2.6.1. Overview
- 11.2.6.2. Products
- 11.2.6.3. SWOT Analysis
- 11.2.6.4. Recent Developments
- 11.2.6.5. Financials (Based on Availability)
- 11.2.7 Inc.
- 11.2.7.1. Overview
- 11.2.7.2. Products
- 11.2.7.3. SWOT Analysis
- 11.2.7.4. Recent Developments
- 11.2.7.5. Financials (Based on Availability)
- 11.2.8 INPAQ Technology Co.
- 11.2.8.1. Overview
- 11.2.8.2. Products
- 11.2.8.3. SWOT Analysis
- 11.2.8.4. Recent Developments
- 11.2.8.5. Financials (Based on Availability)
- 11.2.9 Ltd.
- 11.2.9.1. Overview
- 11.2.9.2. Products
- 11.2.9.3. SWOT Analysis
- 11.2.9.4. Recent Developments
- 11.2.9.5. Financials (Based on Availability)
- 11.2.10 Vishay Intertechnology
- 11.2.10.1. Overview
- 11.2.10.2. Products
- 11.2.10.3. SWOT Analysis
- 11.2.10.4. Recent Developments
- 11.2.10.5. Financials (Based on Availability)
- 11.2.11 Inc
- 11.2.11.1. Overview
- 11.2.11.2. Products
- 11.2.11.3. SWOT Analysis
- 11.2.11.4. Recent Developments
- 11.2.11.5. Financials (Based on Availability)
- 11.2.12 SFI Electronics Technology Inc
- 11.2.12.1. Overview
- 11.2.12.2. Products
- 11.2.12.3. SWOT Analysis
- 11.2.12.4. Recent Developments
- 11.2.12.5. Financials (Based on Availability)
- 11.2.13 Cham How Corporation
- 11.2.13.1. Overview
- 11.2.13.2. Products
- 11.2.13.3. SWOT Analysis
- 11.2.13.4. Recent Developments
- 11.2.13.5. Financials (Based on Availability)
- 11.2.14 KOA Speer Electronics
- 11.2.14.1. Overview
- 11.2.14.2. Products
- 11.2.14.3. SWOT Analysis
- 11.2.14.4. Recent Developments
- 11.2.14.5. Financials (Based on Availability)
- 11.2.15 Inc.
- 11.2.15.1. Overview
- 11.2.15.2. Products
- 11.2.15.3. SWOT Analysis
- 11.2.15.4. Recent Developments
- 11.2.15.5. Financials (Based on Availability)
- 11.2.16 Bourns
- 11.2.16.1. Overview
- 11.2.16.2. Products
- 11.2.16.3. SWOT Analysis
- 11.2.16.4. Recent Developments
- 11.2.16.5. Financials (Based on Availability)
- 11.2.17 Inc.
- 11.2.17.1. Overview
- 11.2.17.2. Products
- 11.2.17.3. SWOT Analysis
- 11.2.17.4. Recent Developments
- 11.2.17.5. Financials (Based on Availability)
- 11.2.18 Thinking Electronic Industrial Co.
- 11.2.18.1. Overview
- 11.2.18.2. Products
- 11.2.18.3. SWOT Analysis
- 11.2.18.4. Recent Developments
- 11.2.18.5. Financials (Based on Availability)
- 11.2.19 Ltd.
- 11.2.19.1. Overview
- 11.2.19.2. Products
- 11.2.19.3. SWOT Analysis
- 11.2.19.4. Recent Developments
- 11.2.19.5. Financials (Based on Availability)
- 11.2.1 Eaton Corporation Plc
List of Figures
- Figure 1: Global Multilayer Varistor Revenue Breakdown (million, %) by Region 2024 & 2032
- Figure 2: Global Multilayer Varistor Volume Breakdown (K, %) by Region 2024 & 2032
- Figure 3: North America Multilayer Varistor Revenue (million), by Application 2024 & 2032
- Figure 4: North America Multilayer Varistor Volume (K), by Application 2024 & 2032
- Figure 5: North America Multilayer Varistor Revenue Share (%), by Application 2024 & 2032
- Figure 6: North America Multilayer Varistor Volume Share (%), by Application 2024 & 2032
- Figure 7: North America Multilayer Varistor Revenue (million), by Types 2024 & 2032
- Figure 8: North America Multilayer Varistor Volume (K), by Types 2024 & 2032
- Figure 9: North America Multilayer Varistor Revenue Share (%), by Types 2024 & 2032
- Figure 10: North America Multilayer Varistor Volume Share (%), by Types 2024 & 2032
- Figure 11: North America Multilayer Varistor Revenue (million), by Country 2024 & 2032
- Figure 12: North America Multilayer Varistor Volume (K), by Country 2024 & 2032
- Figure 13: North America Multilayer Varistor Revenue Share (%), by Country 2024 & 2032
- Figure 14: North America Multilayer Varistor Volume Share (%), by Country 2024 & 2032
- Figure 15: South America Multilayer Varistor Revenue (million), by Application 2024 & 2032
- Figure 16: South America Multilayer Varistor Volume (K), by Application 2024 & 2032
- Figure 17: South America Multilayer Varistor Revenue Share (%), by Application 2024 & 2032
- Figure 18: South America Multilayer Varistor Volume Share (%), by Application 2024 & 2032
- Figure 19: South America Multilayer Varistor Revenue (million), by Types 2024 & 2032
- Figure 20: South America Multilayer Varistor Volume (K), by Types 2024 & 2032
- Figure 21: South America Multilayer Varistor Revenue Share (%), by Types 2024 & 2032
- Figure 22: South America Multilayer Varistor Volume Share (%), by Types 2024 & 2032
- Figure 23: South America Multilayer Varistor Revenue (million), by Country 2024 & 2032
- Figure 24: South America Multilayer Varistor Volume (K), by Country 2024 & 2032
- Figure 25: South America Multilayer Varistor Revenue Share (%), by Country 2024 & 2032
- Figure 26: South America Multilayer Varistor Volume Share (%), by Country 2024 & 2032
- Figure 27: Europe Multilayer Varistor Revenue (million), by Application 2024 & 2032
- Figure 28: Europe Multilayer Varistor Volume (K), by Application 2024 & 2032
- Figure 29: Europe Multilayer Varistor Revenue Share (%), by Application 2024 & 2032
- Figure 30: Europe Multilayer Varistor Volume Share (%), by Application 2024 & 2032
- Figure 31: Europe Multilayer Varistor Revenue (million), by Types 2024 & 2032
- Figure 32: Europe Multilayer Varistor Volume (K), by Types 2024 & 2032
- Figure 33: Europe Multilayer Varistor Revenue Share (%), by Types 2024 & 2032
- Figure 34: Europe Multilayer Varistor Volume Share (%), by Types 2024 & 2032
- Figure 35: Europe Multilayer Varistor Revenue (million), by Country 2024 & 2032
- Figure 36: Europe Multilayer Varistor Volume (K), by Country 2024 & 2032
- Figure 37: Europe Multilayer Varistor Revenue Share (%), by Country 2024 & 2032
- Figure 38: Europe Multilayer Varistor Volume Share (%), by Country 2024 & 2032
- Figure 39: Middle East & Africa Multilayer Varistor Revenue (million), by Application 2024 & 2032
- Figure 40: Middle East & Africa Multilayer Varistor Volume (K), by Application 2024 & 2032
- Figure 41: Middle East & Africa Multilayer Varistor Revenue Share (%), by Application 2024 & 2032
- Figure 42: Middle East & Africa Multilayer Varistor Volume Share (%), by Application 2024 & 2032
- Figure 43: Middle East & Africa Multilayer Varistor Revenue (million), by Types 2024 & 2032
- Figure 44: Middle East & Africa Multilayer Varistor Volume (K), by Types 2024 & 2032
- Figure 45: Middle East & Africa Multilayer Varistor Revenue Share (%), by Types 2024 & 2032
- Figure 46: Middle East & Africa Multilayer Varistor Volume Share (%), by Types 2024 & 2032
- Figure 47: Middle East & Africa Multilayer Varistor Revenue (million), by Country 2024 & 2032
- Figure 48: Middle East & Africa Multilayer Varistor Volume (K), by Country 2024 & 2032
- Figure 49: Middle East & Africa Multilayer Varistor Revenue Share (%), by Country 2024 & 2032
- Figure 50: Middle East & Africa Multilayer Varistor Volume Share (%), by Country 2024 & 2032
- Figure 51: Asia Pacific Multilayer Varistor Revenue (million), by Application 2024 & 2032
- Figure 52: Asia Pacific Multilayer Varistor Volume (K), by Application 2024 & 2032
- Figure 53: Asia Pacific Multilayer Varistor Revenue Share (%), by Application 2024 & 2032
- Figure 54: Asia Pacific Multilayer Varistor Volume Share (%), by Application 2024 & 2032
- Figure 55: Asia Pacific Multilayer Varistor Revenue (million), by Types 2024 & 2032
- Figure 56: Asia Pacific Multilayer Varistor Volume (K), by Types 2024 & 2032
- Figure 57: Asia Pacific Multilayer Varistor Revenue Share (%), by Types 2024 & 2032
- Figure 58: Asia Pacific Multilayer Varistor Volume Share (%), by Types 2024 & 2032
- Figure 59: Asia Pacific Multilayer Varistor Revenue (million), by Country 2024 & 2032
- Figure 60: Asia Pacific Multilayer Varistor Volume (K), by Country 2024 & 2032
- Figure 61: Asia Pacific Multilayer Varistor Revenue Share (%), by Country 2024 & 2032
- Figure 62: Asia Pacific Multilayer Varistor Volume Share (%), by Country 2024 & 2032
List of Tables
- Table 1: Global Multilayer Varistor Revenue million Forecast, by Region 2019 & 2032
- Table 2: Global Multilayer Varistor Volume K Forecast, by Region 2019 & 2032
- Table 3: Global Multilayer Varistor Revenue million Forecast, by Application 2019 & 2032
- Table 4: Global Multilayer Varistor Volume K Forecast, by Application 2019 & 2032
- Table 5: Global Multilayer Varistor Revenue million Forecast, by Types 2019 & 2032
- Table 6: Global Multilayer Varistor Volume K Forecast, by Types 2019 & 2032
- Table 7: Global Multilayer Varistor Revenue million Forecast, by Region 2019 & 2032
- Table 8: Global Multilayer Varistor Volume K Forecast, by Region 2019 & 2032
- Table 9: Global Multilayer Varistor Revenue million Forecast, by Application 2019 & 2032
- Table 10: Global Multilayer Varistor Volume K Forecast, by Application 2019 & 2032
- Table 11: Global Multilayer Varistor Revenue million Forecast, by Types 2019 & 2032
- Table 12: Global Multilayer Varistor Volume K Forecast, by Types 2019 & 2032
- Table 13: Global Multilayer Varistor Revenue million Forecast, by Country 2019 & 2032
- Table 14: Global Multilayer Varistor Volume K Forecast, by Country 2019 & 2032
- Table 15: United States Multilayer Varistor Revenue (million) Forecast, by Application 2019 & 2032
- Table 16: United States Multilayer Varistor Volume (K) Forecast, by Application 2019 & 2032
- Table 17: Canada Multilayer Varistor Revenue (million) Forecast, by Application 2019 & 2032
- Table 18: Canada Multilayer Varistor Volume (K) Forecast, by Application 2019 & 2032
- Table 19: Mexico Multilayer Varistor Revenue (million) Forecast, by Application 2019 & 2032
- Table 20: Mexico Multilayer Varistor Volume (K) Forecast, by Application 2019 & 2032
- Table 21: Global Multilayer Varistor Revenue million Forecast, by Application 2019 & 2032
- Table 22: Global Multilayer Varistor Volume K Forecast, by Application 2019 & 2032
- Table 23: Global Multilayer Varistor Revenue million Forecast, by Types 2019 & 2032
- Table 24: Global Multilayer Varistor Volume K Forecast, by Types 2019 & 2032
- Table 25: Global Multilayer Varistor Revenue million Forecast, by Country 2019 & 2032
- Table 26: Global Multilayer Varistor Volume K Forecast, by Country 2019 & 2032
- Table 27: Brazil Multilayer Varistor Revenue (million) Forecast, by Application 2019 & 2032
- Table 28: Brazil Multilayer Varistor Volume (K) Forecast, by Application 2019 & 2032
- Table 29: Argentina Multilayer Varistor Revenue (million) Forecast, by Application 2019 & 2032
- Table 30: Argentina Multilayer Varistor Volume (K) Forecast, by Application 2019 & 2032
- Table 31: Rest of South America Multilayer Varistor Revenue (million) Forecast, by Application 2019 & 2032
- Table 32: Rest of South America Multilayer Varistor Volume (K) Forecast, by Application 2019 & 2032
- Table 33: Global Multilayer Varistor Revenue million Forecast, by Application 2019 & 2032
- Table 34: Global Multilayer Varistor Volume K Forecast, by Application 2019 & 2032
- Table 35: Global Multilayer Varistor Revenue million Forecast, by Types 2019 & 2032
- Table 36: Global Multilayer Varistor Volume K Forecast, by Types 2019 & 2032
- Table 37: Global Multilayer Varistor Revenue million Forecast, by Country 2019 & 2032
- Table 38: Global Multilayer Varistor Volume K Forecast, by Country 2019 & 2032
- Table 39: United Kingdom Multilayer Varistor Revenue (million) Forecast, by Application 2019 & 2032
- Table 40: United Kingdom Multilayer Varistor Volume (K) Forecast, by Application 2019 & 2032
- Table 41: Germany Multilayer Varistor Revenue (million) Forecast, by Application 2019 & 2032
- Table 42: Germany Multilayer Varistor Volume (K) Forecast, by Application 2019 & 2032
- Table 43: France Multilayer Varistor Revenue (million) Forecast, by Application 2019 & 2032
- Table 44: France Multilayer Varistor Volume (K) Forecast, by Application 2019 & 2032
- Table 45: Italy Multilayer Varistor Revenue (million) Forecast, by Application 2019 & 2032
- Table 46: Italy Multilayer Varistor Volume (K) Forecast, by Application 2019 & 2032
- Table 47: Spain Multilayer Varistor Revenue (million) Forecast, by Application 2019 & 2032
- Table 48: Spain Multilayer Varistor Volume (K) Forecast, by Application 2019 & 2032
- Table 49: Russia Multilayer Varistor Revenue (million) Forecast, by Application 2019 & 2032
- Table 50: Russia Multilayer Varistor Volume (K) Forecast, by Application 2019 & 2032
- Table 51: Benelux Multilayer Varistor Revenue (million) Forecast, by Application 2019 & 2032
- Table 52: Benelux Multilayer Varistor Volume (K) Forecast, by Application 2019 & 2032
- Table 53: Nordics Multilayer Varistor Revenue (million) Forecast, by Application 2019 & 2032
- Table 54: Nordics Multilayer Varistor Volume (K) Forecast, by Application 2019 & 2032
- Table 55: Rest of Europe Multilayer Varistor Revenue (million) Forecast, by Application 2019 & 2032
- Table 56: Rest of Europe Multilayer Varistor Volume (K) Forecast, by Application 2019 & 2032
- Table 57: Global Multilayer Varistor Revenue million Forecast, by Application 2019 & 2032
- Table 58: Global Multilayer Varistor Volume K Forecast, by Application 2019 & 2032
- Table 59: Global Multilayer Varistor Revenue million Forecast, by Types 2019 & 2032
- Table 60: Global Multilayer Varistor Volume K Forecast, by Types 2019 & 2032
- Table 61: Global Multilayer Varistor Revenue million Forecast, by Country 2019 & 2032
- Table 62: Global Multilayer Varistor Volume K Forecast, by Country 2019 & 2032
- Table 63: Turkey Multilayer Varistor Revenue (million) Forecast, by Application 2019 & 2032
- Table 64: Turkey Multilayer Varistor Volume (K) Forecast, by Application 2019 & 2032
- Table 65: Israel Multilayer Varistor Revenue (million) Forecast, by Application 2019 & 2032
- Table 66: Israel Multilayer Varistor Volume (K) Forecast, by Application 2019 & 2032
- Table 67: GCC Multilayer Varistor Revenue (million) Forecast, by Application 2019 & 2032
- Table 68: GCC Multilayer Varistor Volume (K) Forecast, by Application 2019 & 2032
- Table 69: North Africa Multilayer Varistor Revenue (million) Forecast, by Application 2019 & 2032
- Table 70: North Africa Multilayer Varistor Volume (K) Forecast, by Application 2019 & 2032
- Table 71: South Africa Multilayer Varistor Revenue (million) Forecast, by Application 2019 & 2032
- Table 72: South Africa Multilayer Varistor Volume (K) Forecast, by Application 2019 & 2032
- Table 73: Rest of Middle East & Africa Multilayer Varistor Revenue (million) Forecast, by Application 2019 & 2032
- Table 74: Rest of Middle East & Africa Multilayer Varistor Volume (K) Forecast, by Application 2019 & 2032
- Table 75: Global Multilayer Varistor Revenue million Forecast, by Application 2019 & 2032
- Table 76: Global Multilayer Varistor Volume K Forecast, by Application 2019 & 2032
- Table 77: Global Multilayer Varistor Revenue million Forecast, by Types 2019 & 2032
- Table 78: Global Multilayer Varistor Volume K Forecast, by Types 2019 & 2032
- Table 79: Global Multilayer Varistor Revenue million Forecast, by Country 2019 & 2032
- Table 80: Global Multilayer Varistor Volume K Forecast, by Country 2019 & 2032
- Table 81: China Multilayer Varistor Revenue (million) Forecast, by Application 2019 & 2032
- Table 82: China Multilayer Varistor Volume (K) Forecast, by Application 2019 & 2032
- Table 83: India Multilayer Varistor Revenue (million) Forecast, by Application 2019 & 2032
- Table 84: India Multilayer Varistor Volume (K) Forecast, by Application 2019 & 2032
- Table 85: Japan Multilayer Varistor Revenue (million) Forecast, by Application 2019 & 2032
- Table 86: Japan Multilayer Varistor Volume (K) Forecast, by Application 2019 & 2032
- Table 87: South Korea Multilayer Varistor Revenue (million) Forecast, by Application 2019 & 2032
- Table 88: South Korea Multilayer Varistor Volume (K) Forecast, by Application 2019 & 2032
- Table 89: ASEAN Multilayer Varistor Revenue (million) Forecast, by Application 2019 & 2032
- Table 90: ASEAN Multilayer Varistor Volume (K) Forecast, by Application 2019 & 2032
- Table 91: Oceania Multilayer Varistor Revenue (million) Forecast, by Application 2019 & 2032
- Table 92: Oceania Multilayer Varistor Volume (K) Forecast, by Application 2019 & 2032
- Table 93: Rest of Asia Pacific Multilayer Varistor Revenue (million) Forecast, by Application 2019 & 2032
- Table 94: Rest of Asia Pacific Multilayer Varistor Volume (K) Forecast, by Application 2019 & 2032
Frequently Asked Questions
1. What is the projected Compound Annual Growth Rate (CAGR) of the Multilayer Varistor?
The projected CAGR is approximately XX%.
2. Which companies are prominent players in the Multilayer Varistor?
Key companies in the market include Eaton Corporation Plc, KYOCERA (AVX Corporation), TDK Corporation, Akahane-Stackpole Manufacturing Group (Stackpole Electronics, Inc.), Littelfuse, Inc., INPAQ Technology Co., Ltd., Vishay Intertechnology, Inc, SFI Electronics Technology Inc, Cham How Corporation, KOA Speer Electronics, Inc., Bourns, Inc., Thinking Electronic Industrial Co., Ltd..
3. What are the main segments of the Multilayer Varistor?
The market segments include Application, Types.
4. Can you provide details about the market size?
The market size is estimated to be USD XXX million as of 2022.
5. What are some drivers contributing to market growth?
N/A
6. What are the notable trends driving market growth?
N/A
7. Are there any restraints impacting market growth?
N/A
8. Can you provide examples of recent developments in the market?
N/A
9. What pricing options are available for accessing the report?
Pricing options include single-user, multi-user, and enterprise licenses priced at USD 3350.00, USD 5025.00, and USD 6700.00 respectively.
10. Is the market size provided in terms of value or volume?
The market size is provided in terms of value, measured in million and volume, measured in K.
11. Are there any specific market keywords associated with the report?
Yes, the market keyword associated with the report is "Multilayer Varistor," which aids in identifying and referencing the specific market segment covered.
12. How do I determine which pricing option suits my needs best?
The pricing options vary based on user requirements and access needs. Individual users may opt for single-user licenses, while businesses requiring broader access may choose multi-user or enterprise licenses for cost-effective access to the report.
13. Are there any additional resources or data provided in the Multilayer Varistor report?
While the report offers comprehensive insights, it's advisable to review the specific contents or supplementary materials provided to ascertain if additional resources or data are available.
14. How can I stay updated on further developments or reports in the Multilayer Varistor?
To stay informed about further developments, trends, and reports in the Multilayer Varistor, consider subscribing to industry newsletters, following relevant companies and organizations, or regularly checking reputable industry news sources and publications.
Methodology
Step 1 - Identification of Relevant Samples Size from Population Database


Step 2 - Approaches for Defining Global Market Size (Value, Volume* & Price*)

Note*: In applicable scenarios
Step 3 - Data Sources
Primary Research
- Web Analytics
- Survey Reports
- Research Institute
- Latest Research Reports
- Opinion Leaders
Secondary Research
- Annual Reports
- White Paper
- Latest Press Release
- Industry Association
- Paid Database
- Investor Presentations

Step 4 - Data Triangulation
Involves using different sources of information in order to increase the validity of a study
These sources are likely to be stakeholders in a program - participants, other researchers, program staff, other community members, and so on.
Then we put all data in single framework & apply various statistical tools to find out the dynamic on the market.
During the analysis stage, feedback from the stakeholder groups would be compared to determine areas of agreement as well as areas of divergence
