

Key Insights
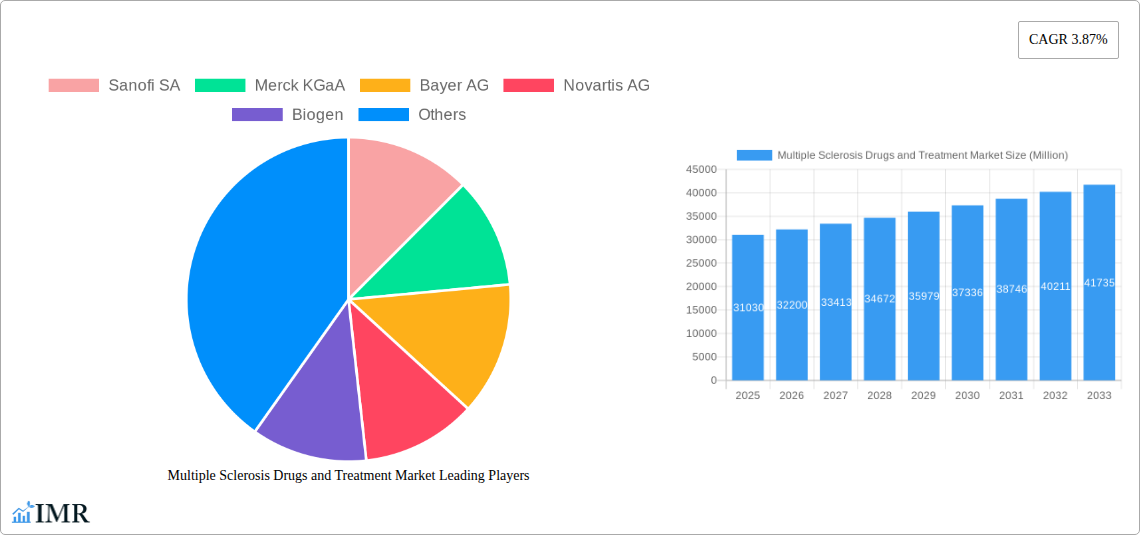
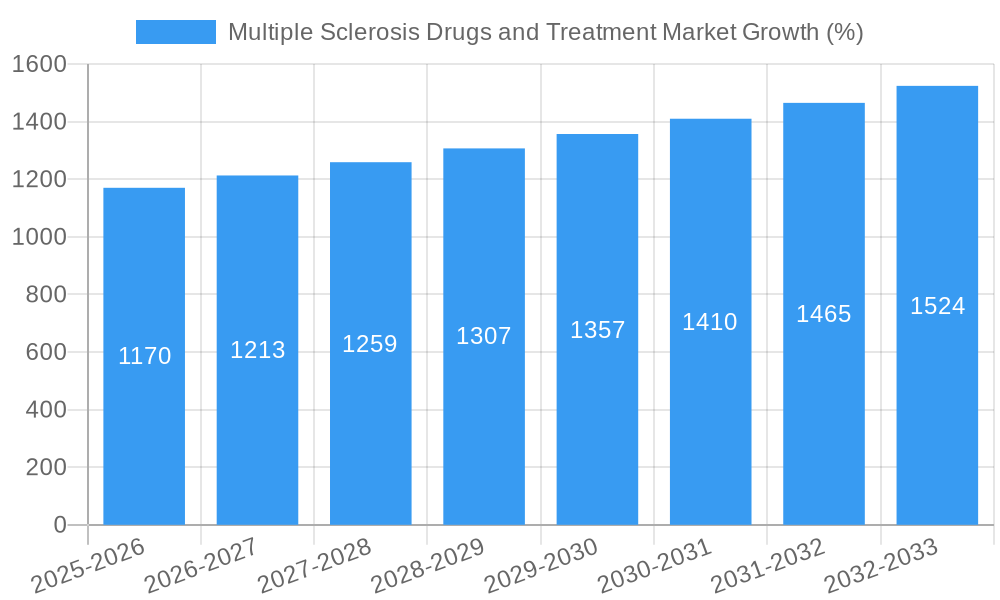
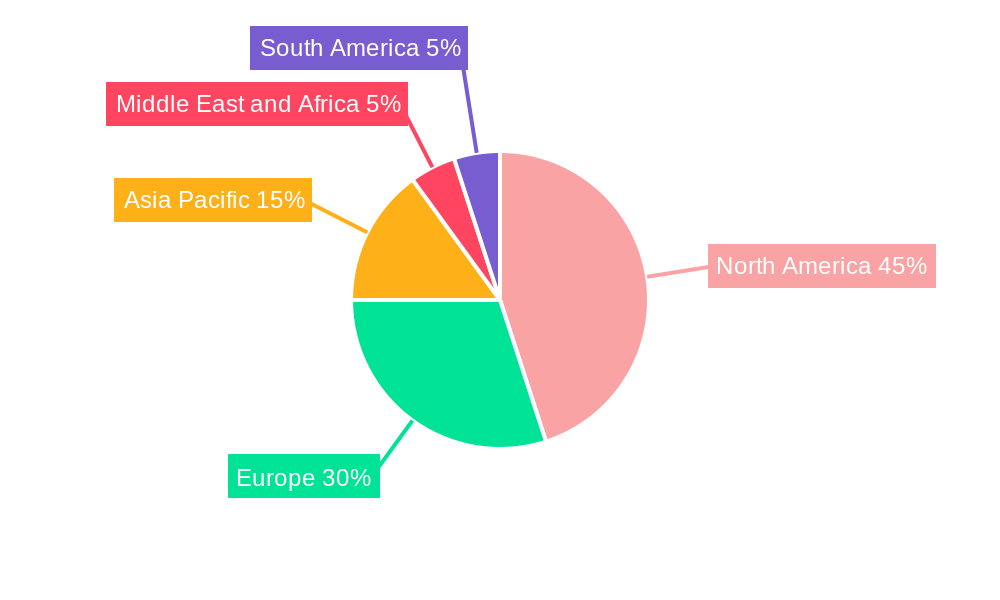
The Multiple Sclerosis (MS) Drugs and Treatment Market, valued at $31.03 billion in 2025, is projected to experience robust growth, driven by a rising prevalence of MS globally, an aging population, and increasing investments in research and development of novel therapies. The market's Compound Annual Growth Rate (CAGR) of 3.87% from 2025 to 2033 indicates a steady expansion, fueled by the continuous introduction of disease-modifying therapies (DMTs) offering improved efficacy and safety profiles. Key market segments include large-molecule drugs (such as monoclonal antibodies and interferons) and small-molecule drugs (including sphingosine-1-phosphate receptor modulators), administered via oral, injectable, or other routes. The North American market currently holds a significant share, attributable to high healthcare expenditure and a considerable MS patient population. However, emerging markets in Asia Pacific and other regions are anticipated to witness accelerated growth driven by improving healthcare infrastructure and increased awareness of MS. Competitive intensity is high, with major pharmaceutical companies like Sanofi, Merck KGaA, and Novartis leading the market, constantly striving for innovation and market penetration through clinical trials and strategic partnerships. Challenges include high drug costs, potential side effects of certain treatments, and the need for personalized therapies addressing the heterogeneity of MS.
The forecast period (2025-2033) will witness intensified competition as pharmaceutical companies introduce next-generation DMTs and explore novel therapeutic approaches targeting specific MS subtypes. The market will likely see consolidation through mergers and acquisitions, as companies seek to strengthen their portfolios and expand their reach. Furthermore, the focus will shift towards personalized medicine, aiming to tailor treatments to individual patient characteristics and disease progression. Factors such as improved access to healthcare, growing awareness campaigns, and ongoing research efforts are expected to positively influence market growth throughout the forecast period. However, the market will also be influenced by pricing pressures and the emergence of biosimilars. A crucial factor shaping market dynamics will be the regulatory landscape and reimbursement policies in various regions.
Multiple Sclerosis (MS) Drugs and Treatment Market: A Comprehensive Report (2019-2033)
This comprehensive report provides an in-depth analysis of the Multiple Sclerosis (MS) Drugs and Treatment Market, encompassing market dynamics, growth trends, regional segmentation, product landscape, and key players. The study period covers 2019-2033, with 2025 as the base and estimated year, and a forecast period of 2025-2033. This report is essential for industry professionals, investors, and researchers seeking a thorough understanding of this rapidly evolving market, valued at xx Million in 2025 and projected to reach xx Million by 2033.
Parent Market: Pharmaceutical Market Child Market: Neurological Disorder Treatment Market
Multiple Sclerosis Drugs and Treatment Market Dynamics & Structure
The MS Drugs and Treatment Market is characterized by a moderately concentrated landscape with several key players holding significant market share. Technological innovation, particularly in disease-modifying therapies (DMTs), is a primary growth driver. Stringent regulatory frameworks influence product approvals and market access, while the availability of competitive substitutes impacts pricing and market penetration. The end-user demographic primarily comprises individuals diagnosed with MS, with varying disease severities and treatment needs. M&A activities in the sector have been relatively active, with several large pharmaceutical companies acquiring smaller biotech firms to expand their MS treatment portfolios.
- Market Concentration: High, with top 5 players holding approximately xx% of the market share in 2025.
- Technological Innovation: Focus on novel DMTs, improved delivery systems (e.g., oral formulations), and personalized medicine approaches.
- Regulatory Framework: Stringent regulatory pathways for drug approval, impacting time-to-market and overall costs.
- Competitive Substitutes: Availability of various DMTs with differing efficacy and safety profiles.
- End-User Demographics: Primarily individuals aged 20-50, with a higher prevalence among women.
- M&A Trends: xx M&A deals in the MS drug space between 2019-2024, indicating an active market for consolidation.
Multiple Sclerosis Drugs and Treatment Market Growth Trends & Insights
The MS Drugs and Treatment Market is experiencing robust growth, driven by increasing MS prevalence, expanding treatment options, and rising healthcare expenditure. The market size witnessed a CAGR of xx% during the historical period (2019-2024) and is projected to maintain a CAGR of xx% during the forecast period (2025-2033). This growth is fueled by the increasing adoption of novel DMTs, improved diagnostic tools leading to earlier disease detection, and rising awareness among patients and healthcare professionals. Market penetration of newer drugs is expected to increase significantly in the forecast period due to improved efficacy profiles. Technological advancements such as the development of more targeted therapies and advanced diagnostic tools significantly contribute to the market's expansion. The changing consumer behavior, with patients becoming more actively involved in their treatment decisions, also impacts market trends.
Dominant Regions, Countries, or Segments in Multiple Sclerosis Drugs and Treatment Market
North America currently dominates the MS Drugs and Treatment Market, driven by high MS prevalence, advanced healthcare infrastructure, and substantial healthcare spending. Europe follows as a significant market, with similar drivers although perhaps slightly slower growth compared to North America. Within the segments, the Injectable drugs segment holds the largest share due to the established efficacy of injectable therapies. The oral drug segment is experiencing significant growth driven by improved patient convenience and compliance.
- Key Drivers in North America: High MS prevalence, advanced healthcare infrastructure, strong pharmaceutical industry presence, high per capita healthcare expenditure.
- Key Drivers in Europe: Significant MS prevalence, growing awareness about MS, increasing healthcare expenditure, expanding access to advanced therapies.
- Segment Dominance: Injectable drugs hold the largest market share in 2025 at xx Million due to their established efficacy; however, the Oral segment is expected to show the highest growth in the forecast period.
Multiple Sclerosis Drugs and Treatment Market Product Landscape
The market offers a diverse range of products, including large-molecule drugs (e.g., monoclonal antibodies, interferons) and small-molecule drugs (e.g., sphingosine-1-phosphate receptor modulators). These products are administered via various routes, such as oral, injectable (subcutaneous, intravenous), and other routes of administration. Recent innovations focus on enhancing efficacy, improving safety profiles, and developing more convenient delivery systems. Unique selling propositions include improved efficacy in reducing disease progression, better safety profiles, and reduced adverse effects. Technological advancements in drug delivery and personalized medicine are further shaping the product landscape.
Key Drivers, Barriers & Challenges in Multiple Sclerosis Drugs and Treatment Market
Key Drivers: Increasing prevalence of MS, rising healthcare expenditure, advancements in drug development, increased awareness and diagnosis rates, and supportive government initiatives.
Key Challenges: High drug costs limiting accessibility, stringent regulatory requirements hindering product approvals, and potential adverse effects associated with certain therapies. The market faces challenges related to drug pricing, particularly for newer, innovative treatments. Competition among existing and emerging players is intense.
Emerging Opportunities in Multiple Sclerosis Drugs and Treatment Market
Emerging opportunities lie in the development of personalized medicine approaches tailored to specific patient subgroups. Untapped markets in developing countries offer significant potential. Focus on improving the quality of life for MS patients and addressing unmet needs, such as treatment for progressive forms of MS, also represent key opportunities. Furthermore, exploring combination therapies and exploring new drug delivery methods to improve patient compliance could prove lucrative.
Growth Accelerators in the Multiple Sclerosis Drugs and Treatment Market Industry
Technological advancements in drug development, such as the development of more targeted and effective therapies, are major growth catalysts. Strategic partnerships between pharmaceutical companies and research institutions accelerate the development pipeline and enhance market reach. Expansion into emerging markets with increasing MS prevalence and improved healthcare access are additional key growth accelerators.
Key Players Shaping the Multiple Sclerosis Drugs and Treatment Market Market
- Sanofi SA
- Merck KGaA
- Bayer AG
- Novartis AG
- Biogen
- Johnson & Johnson
- Teva Pharmaceuticals Industries Ltd
- F Hoffmann-La Roche AG
- Acorda Therapeutics Inc
- Viatris Inc (Mylan NV)
- Bristol-Myers Squibb Company
Notable Milestones in Multiple Sclerosis Drugs and Treatment Market Sector
- October 2023: Bristol Myers Squibb presented positive long-term data for Zeposia (ozanimod) in relapsing MS, showing 76% of patients were free of six-month confirmed disability progression (CDP). This reinforces Zeposia's position in the market.
- September 2023: Sandoz received EC and US FDA approval for its biosimilar Tyruko (natalizumab), increasing competition and potentially reducing treatment costs.
In-Depth Multiple Sclerosis Drugs and Treatment Market Market Outlook
The MS Drugs and Treatment Market is poised for continued robust growth, fueled by ongoing innovation in drug development, expanding treatment options, and a growing patient population. Strategic partnerships, market expansion into new territories, and a focus on personalized medicine will further shape the market landscape. The development of novel therapies targeting progressive forms of MS presents a particularly significant opportunity for future growth.
Multiple Sclerosis Drugs and Treatment Market Segmentation
-
1. Drug Type
- 1.1. Large-molecule Drugs
- 1.2. Small-molecule Drugs
-
2. Route of Administration
- 2.1. Oral
- 2.2. Injectable and Other Routes of Administration
Multiple Sclerosis Drugs and Treatment Market Segmentation By Geography
-
1. North America
- 1.1. United States
- 1.2. Canada
- 1.3. Mexico
-
2. Europe
- 2.1. Germany
- 2.2. United Kingdom
- 2.3. France
- 2.4. Italy
- 2.5. Spain
- 2.6. Rest of Europe
-
3. Asia Pacific
- 3.1. China
- 3.2. Japan
- 3.3. India
- 3.4. Australia
- 3.5. South Korea
- 3.6. Rest of Asia Pacific
-
4. Middle East and Africa
- 4.1. GCC
- 4.2. South Africa
- 4.3. Rest of Middle East and Africa
-
5. South America
- 5.1. Brazil
- 5.2. Argentina
- 5.3. Rest of South America
Multiple Sclerosis Drugs and Treatment Market REPORT HIGHLIGHTS
| Aspects | Details |
|---|---|
| Study Period | 2019-2033 |
| Base Year | 2024 |
| Estimated Year | 2025 |
| Forecast Period | 2025-2033 |
| Historical Period | 2019-2024 |
| Growth Rate | CAGR of 3.87% from 2019-2033 |
| Segmentation |
|
Table of Contents
- 1. Introduction
- 1.1. Research Scope
- 1.2. Market Segmentation
- 1.3. Research Methodology
- 1.4. Definitions and Assumptions
- 2. Executive Summary
- 2.1. Introduction
- 3. Market Dynamics
- 3.1. Introduction
- 3.2. Market Drivers
- 3.2.1. Rising Cases of Multiple Sclerosis across the World; Growing Focus of Companies on Pipeline Products for MS
- 3.3. Market Restrains
- 3.3.1. Side Effects Associated with the Medication; High Cost of the Drugs
- 3.4. Market Trends
- 3.4.1. The Oral Route of Administration is Expected to Witness Rapid Growth in Over the Forecast Period
- 4. Market Factor Analysis
- 4.1. Porters Five Forces
- 4.2. Supply/Value Chain
- 4.3. PESTEL analysis
- 4.4. Market Entropy
- 4.5. Patent/Trademark Analysis
- 5. Global Multiple Sclerosis Drugs and Treatment Market Analysis, Insights and Forecast, 2019-2031
- 5.1. Market Analysis, Insights and Forecast - by Drug Type
- 5.1.1. Large-molecule Drugs
- 5.1.2. Small-molecule Drugs
- 5.2. Market Analysis, Insights and Forecast - by Route of Administration
- 5.2.1. Oral
- 5.2.2. Injectable and Other Routes of Administration
- 5.3. Market Analysis, Insights and Forecast - by Region
- 5.3.1. North America
- 5.3.2. Europe
- 5.3.3. Asia Pacific
- 5.3.4. Middle East and Africa
- 5.3.5. South America
- 5.1. Market Analysis, Insights and Forecast - by Drug Type
- 6. North America Multiple Sclerosis Drugs and Treatment Market Analysis, Insights and Forecast, 2019-2031
- 6.1. Market Analysis, Insights and Forecast - by Drug Type
- 6.1.1. Large-molecule Drugs
- 6.1.2. Small-molecule Drugs
- 6.2. Market Analysis, Insights and Forecast - by Route of Administration
- 6.2.1. Oral
- 6.2.2. Injectable and Other Routes of Administration
- 6.1. Market Analysis, Insights and Forecast - by Drug Type
- 7. Europe Multiple Sclerosis Drugs and Treatment Market Analysis, Insights and Forecast, 2019-2031
- 7.1. Market Analysis, Insights and Forecast - by Drug Type
- 7.1.1. Large-molecule Drugs
- 7.1.2. Small-molecule Drugs
- 7.2. Market Analysis, Insights and Forecast - by Route of Administration
- 7.2.1. Oral
- 7.2.2. Injectable and Other Routes of Administration
- 7.1. Market Analysis, Insights and Forecast - by Drug Type
- 8. Asia Pacific Multiple Sclerosis Drugs and Treatment Market Analysis, Insights and Forecast, 2019-2031
- 8.1. Market Analysis, Insights and Forecast - by Drug Type
- 8.1.1. Large-molecule Drugs
- 8.1.2. Small-molecule Drugs
- 8.2. Market Analysis, Insights and Forecast - by Route of Administration
- 8.2.1. Oral
- 8.2.2. Injectable and Other Routes of Administration
- 8.1. Market Analysis, Insights and Forecast - by Drug Type
- 9. Middle East and Africa Multiple Sclerosis Drugs and Treatment Market Analysis, Insights and Forecast, 2019-2031
- 9.1. Market Analysis, Insights and Forecast - by Drug Type
- 9.1.1. Large-molecule Drugs
- 9.1.2. Small-molecule Drugs
- 9.2. Market Analysis, Insights and Forecast - by Route of Administration
- 9.2.1. Oral
- 9.2.2. Injectable and Other Routes of Administration
- 9.1. Market Analysis, Insights and Forecast - by Drug Type
- 10. South America Multiple Sclerosis Drugs and Treatment Market Analysis, Insights and Forecast, 2019-2031
- 10.1. Market Analysis, Insights and Forecast - by Drug Type
- 10.1.1. Large-molecule Drugs
- 10.1.2. Small-molecule Drugs
- 10.2. Market Analysis, Insights and Forecast - by Route of Administration
- 10.2.1. Oral
- 10.2.2. Injectable and Other Routes of Administration
- 10.1. Market Analysis, Insights and Forecast - by Drug Type
- 11. North America Multiple Sclerosis Drugs and Treatment Market Analysis, Insights and Forecast, 2019-2031
- 11.1. Market Analysis, Insights and Forecast - By Country/Sub-region
- 11.1.1 United States
- 11.1.2 Canada
- 11.1.3 Mexico
- 12. Europe Multiple Sclerosis Drugs and Treatment Market Analysis, Insights and Forecast, 2019-2031
- 12.1. Market Analysis, Insights and Forecast - By Country/Sub-region
- 12.1.1 Germany
- 12.1.2 United Kingdom
- 12.1.3 France
- 12.1.4 Italy
- 12.1.5 Spain
- 12.1.6 Rest of Europe
- 13. Asia Pacific Multiple Sclerosis Drugs and Treatment Market Analysis, Insights and Forecast, 2019-2031
- 13.1. Market Analysis, Insights and Forecast - By Country/Sub-region
- 13.1.1 China
- 13.1.2 Japan
- 13.1.3 India
- 13.1.4 Australia
- 13.1.5 South Korea
- 13.1.6 Rest of Asia Pacific
- 14. Middle East and Africa Multiple Sclerosis Drugs and Treatment Market Analysis, Insights and Forecast, 2019-2031
- 14.1. Market Analysis, Insights and Forecast - By Country/Sub-region
- 14.1.1 GCC
- 14.1.2 South Africa
- 14.1.3 Rest of Middle East and Africa
- 15. South America Multiple Sclerosis Drugs and Treatment Market Analysis, Insights and Forecast, 2019-2031
- 15.1. Market Analysis, Insights and Forecast - By Country/Sub-region
- 15.1.1 Brazil
- 15.1.2 Argentina
- 15.1.3 Rest of South America
- 16. Competitive Analysis
- 16.1. Global Market Share Analysis 2024
- 16.2. Company Profiles
- 16.2.1 Sanofi SA
- 16.2.1.1. Overview
- 16.2.1.2. Products
- 16.2.1.3. SWOT Analysis
- 16.2.1.4. Recent Developments
- 16.2.1.5. Financials (Based on Availability)
- 16.2.2 Merck KGaA
- 16.2.2.1. Overview
- 16.2.2.2. Products
- 16.2.2.3. SWOT Analysis
- 16.2.2.4. Recent Developments
- 16.2.2.5. Financials (Based on Availability)
- 16.2.3 Bayer AG
- 16.2.3.1. Overview
- 16.2.3.2. Products
- 16.2.3.3. SWOT Analysis
- 16.2.3.4. Recent Developments
- 16.2.3.5. Financials (Based on Availability)
- 16.2.4 Novartis AG
- 16.2.4.1. Overview
- 16.2.4.2. Products
- 16.2.4.3. SWOT Analysis
- 16.2.4.4. Recent Developments
- 16.2.4.5. Financials (Based on Availability)
- 16.2.5 Biogen
- 16.2.5.1. Overview
- 16.2.5.2. Products
- 16.2.5.3. SWOT Analysis
- 16.2.5.4. Recent Developments
- 16.2.5.5. Financials (Based on Availability)
- 16.2.6 Johnson & Johnson
- 16.2.6.1. Overview
- 16.2.6.2. Products
- 16.2.6.3. SWOT Analysis
- 16.2.6.4. Recent Developments
- 16.2.6.5. Financials (Based on Availability)
- 16.2.7 Teva Pharmaceuticals Industries Ltd
- 16.2.7.1. Overview
- 16.2.7.2. Products
- 16.2.7.3. SWOT Analysis
- 16.2.7.4. Recent Developments
- 16.2.7.5. Financials (Based on Availability)
- 16.2.8 F Hoffmann-La Roche AG
- 16.2.8.1. Overview
- 16.2.8.2. Products
- 16.2.8.3. SWOT Analysis
- 16.2.8.4. Recent Developments
- 16.2.8.5. Financials (Based on Availability)
- 16.2.9 Acorda Therapeutics Inc
- 16.2.9.1. Overview
- 16.2.9.2. Products
- 16.2.9.3. SWOT Analysis
- 16.2.9.4. Recent Developments
- 16.2.9.5. Financials (Based on Availability)
- 16.2.10 Viatris Inc (Mylan NV)
- 16.2.10.1. Overview
- 16.2.10.2. Products
- 16.2.10.3. SWOT Analysis
- 16.2.10.4. Recent Developments
- 16.2.10.5. Financials (Based on Availability)
- 16.2.11 Bristol-Myers Squibb Company
- 16.2.11.1. Overview
- 16.2.11.2. Products
- 16.2.11.3. SWOT Analysis
- 16.2.11.4. Recent Developments
- 16.2.11.5. Financials (Based on Availability)
- 16.2.1 Sanofi SA
List of Figures
- Figure 1: Global Multiple Sclerosis Drugs and Treatment Market Revenue Breakdown (Million, %) by Region 2024 & 2032
- Figure 2: Global Multiple Sclerosis Drugs and Treatment Market Volume Breakdown (K Unit, %) by Region 2024 & 2032
- Figure 3: North America Multiple Sclerosis Drugs and Treatment Market Revenue (Million), by Country 2024 & 2032
- Figure 4: North America Multiple Sclerosis Drugs and Treatment Market Volume (K Unit), by Country 2024 & 2032
- Figure 5: North America Multiple Sclerosis Drugs and Treatment Market Revenue Share (%), by Country 2024 & 2032
- Figure 6: North America Multiple Sclerosis Drugs and Treatment Market Volume Share (%), by Country 2024 & 2032
- Figure 7: Europe Multiple Sclerosis Drugs and Treatment Market Revenue (Million), by Country 2024 & 2032
- Figure 8: Europe Multiple Sclerosis Drugs and Treatment Market Volume (K Unit), by Country 2024 & 2032
- Figure 9: Europe Multiple Sclerosis Drugs and Treatment Market Revenue Share (%), by Country 2024 & 2032
- Figure 10: Europe Multiple Sclerosis Drugs and Treatment Market Volume Share (%), by Country 2024 & 2032
- Figure 11: Asia Pacific Multiple Sclerosis Drugs and Treatment Market Revenue (Million), by Country 2024 & 2032
- Figure 12: Asia Pacific Multiple Sclerosis Drugs and Treatment Market Volume (K Unit), by Country 2024 & 2032
- Figure 13: Asia Pacific Multiple Sclerosis Drugs and Treatment Market Revenue Share (%), by Country 2024 & 2032
- Figure 14: Asia Pacific Multiple Sclerosis Drugs and Treatment Market Volume Share (%), by Country 2024 & 2032
- Figure 15: Middle East and Africa Multiple Sclerosis Drugs and Treatment Market Revenue (Million), by Country 2024 & 2032
- Figure 16: Middle East and Africa Multiple Sclerosis Drugs and Treatment Market Volume (K Unit), by Country 2024 & 2032
- Figure 17: Middle East and Africa Multiple Sclerosis Drugs and Treatment Market Revenue Share (%), by Country 2024 & 2032
- Figure 18: Middle East and Africa Multiple Sclerosis Drugs and Treatment Market Volume Share (%), by Country 2024 & 2032
- Figure 19: South America Multiple Sclerosis Drugs and Treatment Market Revenue (Million), by Country 2024 & 2032
- Figure 20: South America Multiple Sclerosis Drugs and Treatment Market Volume (K Unit), by Country 2024 & 2032
- Figure 21: South America Multiple Sclerosis Drugs and Treatment Market Revenue Share (%), by Country 2024 & 2032
- Figure 22: South America Multiple Sclerosis Drugs and Treatment Market Volume Share (%), by Country 2024 & 2032
- Figure 23: North America Multiple Sclerosis Drugs and Treatment Market Revenue (Million), by Drug Type 2024 & 2032
- Figure 24: North America Multiple Sclerosis Drugs and Treatment Market Volume (K Unit), by Drug Type 2024 & 2032
- Figure 25: North America Multiple Sclerosis Drugs and Treatment Market Revenue Share (%), by Drug Type 2024 & 2032
- Figure 26: North America Multiple Sclerosis Drugs and Treatment Market Volume Share (%), by Drug Type 2024 & 2032
- Figure 27: North America Multiple Sclerosis Drugs and Treatment Market Revenue (Million), by Route of Administration 2024 & 2032
- Figure 28: North America Multiple Sclerosis Drugs and Treatment Market Volume (K Unit), by Route of Administration 2024 & 2032
- Figure 29: North America Multiple Sclerosis Drugs and Treatment Market Revenue Share (%), by Route of Administration 2024 & 2032
- Figure 30: North America Multiple Sclerosis Drugs and Treatment Market Volume Share (%), by Route of Administration 2024 & 2032
- Figure 31: North America Multiple Sclerosis Drugs and Treatment Market Revenue (Million), by Country 2024 & 2032
- Figure 32: North America Multiple Sclerosis Drugs and Treatment Market Volume (K Unit), by Country 2024 & 2032
- Figure 33: North America Multiple Sclerosis Drugs and Treatment Market Revenue Share (%), by Country 2024 & 2032
- Figure 34: North America Multiple Sclerosis Drugs and Treatment Market Volume Share (%), by Country 2024 & 2032
- Figure 35: Europe Multiple Sclerosis Drugs and Treatment Market Revenue (Million), by Drug Type 2024 & 2032
- Figure 36: Europe Multiple Sclerosis Drugs and Treatment Market Volume (K Unit), by Drug Type 2024 & 2032
- Figure 37: Europe Multiple Sclerosis Drugs and Treatment Market Revenue Share (%), by Drug Type 2024 & 2032
- Figure 38: Europe Multiple Sclerosis Drugs and Treatment Market Volume Share (%), by Drug Type 2024 & 2032
- Figure 39: Europe Multiple Sclerosis Drugs and Treatment Market Revenue (Million), by Route of Administration 2024 & 2032
- Figure 40: Europe Multiple Sclerosis Drugs and Treatment Market Volume (K Unit), by Route of Administration 2024 & 2032
- Figure 41: Europe Multiple Sclerosis Drugs and Treatment Market Revenue Share (%), by Route of Administration 2024 & 2032
- Figure 42: Europe Multiple Sclerosis Drugs and Treatment Market Volume Share (%), by Route of Administration 2024 & 2032
- Figure 43: Europe Multiple Sclerosis Drugs and Treatment Market Revenue (Million), by Country 2024 & 2032
- Figure 44: Europe Multiple Sclerosis Drugs and Treatment Market Volume (K Unit), by Country 2024 & 2032
- Figure 45: Europe Multiple Sclerosis Drugs and Treatment Market Revenue Share (%), by Country 2024 & 2032
- Figure 46: Europe Multiple Sclerosis Drugs and Treatment Market Volume Share (%), by Country 2024 & 2032
- Figure 47: Asia Pacific Multiple Sclerosis Drugs and Treatment Market Revenue (Million), by Drug Type 2024 & 2032
- Figure 48: Asia Pacific Multiple Sclerosis Drugs and Treatment Market Volume (K Unit), by Drug Type 2024 & 2032
- Figure 49: Asia Pacific Multiple Sclerosis Drugs and Treatment Market Revenue Share (%), by Drug Type 2024 & 2032
- Figure 50: Asia Pacific Multiple Sclerosis Drugs and Treatment Market Volume Share (%), by Drug Type 2024 & 2032
- Figure 51: Asia Pacific Multiple Sclerosis Drugs and Treatment Market Revenue (Million), by Route of Administration 2024 & 2032
- Figure 52: Asia Pacific Multiple Sclerosis Drugs and Treatment Market Volume (K Unit), by Route of Administration 2024 & 2032
- Figure 53: Asia Pacific Multiple Sclerosis Drugs and Treatment Market Revenue Share (%), by Route of Administration 2024 & 2032
- Figure 54: Asia Pacific Multiple Sclerosis Drugs and Treatment Market Volume Share (%), by Route of Administration 2024 & 2032
- Figure 55: Asia Pacific Multiple Sclerosis Drugs and Treatment Market Revenue (Million), by Country 2024 & 2032
- Figure 56: Asia Pacific Multiple Sclerosis Drugs and Treatment Market Volume (K Unit), by Country 2024 & 2032
- Figure 57: Asia Pacific Multiple Sclerosis Drugs and Treatment Market Revenue Share (%), by Country 2024 & 2032
- Figure 58: Asia Pacific Multiple Sclerosis Drugs and Treatment Market Volume Share (%), by Country 2024 & 2032
- Figure 59: Middle East and Africa Multiple Sclerosis Drugs and Treatment Market Revenue (Million), by Drug Type 2024 & 2032
- Figure 60: Middle East and Africa Multiple Sclerosis Drugs and Treatment Market Volume (K Unit), by Drug Type 2024 & 2032
- Figure 61: Middle East and Africa Multiple Sclerosis Drugs and Treatment Market Revenue Share (%), by Drug Type 2024 & 2032
- Figure 62: Middle East and Africa Multiple Sclerosis Drugs and Treatment Market Volume Share (%), by Drug Type 2024 & 2032
- Figure 63: Middle East and Africa Multiple Sclerosis Drugs and Treatment Market Revenue (Million), by Route of Administration 2024 & 2032
- Figure 64: Middle East and Africa Multiple Sclerosis Drugs and Treatment Market Volume (K Unit), by Route of Administration 2024 & 2032
- Figure 65: Middle East and Africa Multiple Sclerosis Drugs and Treatment Market Revenue Share (%), by Route of Administration 2024 & 2032
- Figure 66: Middle East and Africa Multiple Sclerosis Drugs and Treatment Market Volume Share (%), by Route of Administration 2024 & 2032
- Figure 67: Middle East and Africa Multiple Sclerosis Drugs and Treatment Market Revenue (Million), by Country 2024 & 2032
- Figure 68: Middle East and Africa Multiple Sclerosis Drugs and Treatment Market Volume (K Unit), by Country 2024 & 2032
- Figure 69: Middle East and Africa Multiple Sclerosis Drugs and Treatment Market Revenue Share (%), by Country 2024 & 2032
- Figure 70: Middle East and Africa Multiple Sclerosis Drugs and Treatment Market Volume Share (%), by Country 2024 & 2032
- Figure 71: South America Multiple Sclerosis Drugs and Treatment Market Revenue (Million), by Drug Type 2024 & 2032
- Figure 72: South America Multiple Sclerosis Drugs and Treatment Market Volume (K Unit), by Drug Type 2024 & 2032
- Figure 73: South America Multiple Sclerosis Drugs and Treatment Market Revenue Share (%), by Drug Type 2024 & 2032
- Figure 74: South America Multiple Sclerosis Drugs and Treatment Market Volume Share (%), by Drug Type 2024 & 2032
- Figure 75: South America Multiple Sclerosis Drugs and Treatment Market Revenue (Million), by Route of Administration 2024 & 2032
- Figure 76: South America Multiple Sclerosis Drugs and Treatment Market Volume (K Unit), by Route of Administration 2024 & 2032
- Figure 77: South America Multiple Sclerosis Drugs and Treatment Market Revenue Share (%), by Route of Administration 2024 & 2032
- Figure 78: South America Multiple Sclerosis Drugs and Treatment Market Volume Share (%), by Route of Administration 2024 & 2032
- Figure 79: South America Multiple Sclerosis Drugs and Treatment Market Revenue (Million), by Country 2024 & 2032
- Figure 80: South America Multiple Sclerosis Drugs and Treatment Market Volume (K Unit), by Country 2024 & 2032
- Figure 81: South America Multiple Sclerosis Drugs and Treatment Market Revenue Share (%), by Country 2024 & 2032
- Figure 82: South America Multiple Sclerosis Drugs and Treatment Market Volume Share (%), by Country 2024 & 2032
List of Tables
- Table 1: Global Multiple Sclerosis Drugs and Treatment Market Revenue Million Forecast, by Region 2019 & 2032
- Table 2: Global Multiple Sclerosis Drugs and Treatment Market Volume K Unit Forecast, by Region 2019 & 2032
- Table 3: Global Multiple Sclerosis Drugs and Treatment Market Revenue Million Forecast, by Drug Type 2019 & 2032
- Table 4: Global Multiple Sclerosis Drugs and Treatment Market Volume K Unit Forecast, by Drug Type 2019 & 2032
- Table 5: Global Multiple Sclerosis Drugs and Treatment Market Revenue Million Forecast, by Route of Administration 2019 & 2032
- Table 6: Global Multiple Sclerosis Drugs and Treatment Market Volume K Unit Forecast, by Route of Administration 2019 & 2032
- Table 7: Global Multiple Sclerosis Drugs and Treatment Market Revenue Million Forecast, by Region 2019 & 2032
- Table 8: Global Multiple Sclerosis Drugs and Treatment Market Volume K Unit Forecast, by Region 2019 & 2032
- Table 9: Global Multiple Sclerosis Drugs and Treatment Market Revenue Million Forecast, by Country 2019 & 2032
- Table 10: Global Multiple Sclerosis Drugs and Treatment Market Volume K Unit Forecast, by Country 2019 & 2032
- Table 11: United States Multiple Sclerosis Drugs and Treatment Market Revenue (Million) Forecast, by Application 2019 & 2032
- Table 12: United States Multiple Sclerosis Drugs and Treatment Market Volume (K Unit) Forecast, by Application 2019 & 2032
- Table 13: Canada Multiple Sclerosis Drugs and Treatment Market Revenue (Million) Forecast, by Application 2019 & 2032
- Table 14: Canada Multiple Sclerosis Drugs and Treatment Market Volume (K Unit) Forecast, by Application 2019 & 2032
- Table 15: Mexico Multiple Sclerosis Drugs and Treatment Market Revenue (Million) Forecast, by Application 2019 & 2032
- Table 16: Mexico Multiple Sclerosis Drugs and Treatment Market Volume (K Unit) Forecast, by Application 2019 & 2032
- Table 17: Global Multiple Sclerosis Drugs and Treatment Market Revenue Million Forecast, by Country 2019 & 2032
- Table 18: Global Multiple Sclerosis Drugs and Treatment Market Volume K Unit Forecast, by Country 2019 & 2032
- Table 19: Germany Multiple Sclerosis Drugs and Treatment Market Revenue (Million) Forecast, by Application 2019 & 2032
- Table 20: Germany Multiple Sclerosis Drugs and Treatment Market Volume (K Unit) Forecast, by Application 2019 & 2032
- Table 21: United Kingdom Multiple Sclerosis Drugs and Treatment Market Revenue (Million) Forecast, by Application 2019 & 2032
- Table 22: United Kingdom Multiple Sclerosis Drugs and Treatment Market Volume (K Unit) Forecast, by Application 2019 & 2032
- Table 23: France Multiple Sclerosis Drugs and Treatment Market Revenue (Million) Forecast, by Application 2019 & 2032
- Table 24: France Multiple Sclerosis Drugs and Treatment Market Volume (K Unit) Forecast, by Application 2019 & 2032
- Table 25: Italy Multiple Sclerosis Drugs and Treatment Market Revenue (Million) Forecast, by Application 2019 & 2032
- Table 26: Italy Multiple Sclerosis Drugs and Treatment Market Volume (K Unit) Forecast, by Application 2019 & 2032
- Table 27: Spain Multiple Sclerosis Drugs and Treatment Market Revenue (Million) Forecast, by Application 2019 & 2032
- Table 28: Spain Multiple Sclerosis Drugs and Treatment Market Volume (K Unit) Forecast, by Application 2019 & 2032
- Table 29: Rest of Europe Multiple Sclerosis Drugs and Treatment Market Revenue (Million) Forecast, by Application 2019 & 2032
- Table 30: Rest of Europe Multiple Sclerosis Drugs and Treatment Market Volume (K Unit) Forecast, by Application 2019 & 2032
- Table 31: Global Multiple Sclerosis Drugs and Treatment Market Revenue Million Forecast, by Country 2019 & 2032
- Table 32: Global Multiple Sclerosis Drugs and Treatment Market Volume K Unit Forecast, by Country 2019 & 2032
- Table 33: China Multiple Sclerosis Drugs and Treatment Market Revenue (Million) Forecast, by Application 2019 & 2032
- Table 34: China Multiple Sclerosis Drugs and Treatment Market Volume (K Unit) Forecast, by Application 2019 & 2032
- Table 35: Japan Multiple Sclerosis Drugs and Treatment Market Revenue (Million) Forecast, by Application 2019 & 2032
- Table 36: Japan Multiple Sclerosis Drugs and Treatment Market Volume (K Unit) Forecast, by Application 2019 & 2032
- Table 37: India Multiple Sclerosis Drugs and Treatment Market Revenue (Million) Forecast, by Application 2019 & 2032
- Table 38: India Multiple Sclerosis Drugs and Treatment Market Volume (K Unit) Forecast, by Application 2019 & 2032
- Table 39: Australia Multiple Sclerosis Drugs and Treatment Market Revenue (Million) Forecast, by Application 2019 & 2032
- Table 40: Australia Multiple Sclerosis Drugs and Treatment Market Volume (K Unit) Forecast, by Application 2019 & 2032
- Table 41: South Korea Multiple Sclerosis Drugs and Treatment Market Revenue (Million) Forecast, by Application 2019 & 2032
- Table 42: South Korea Multiple Sclerosis Drugs and Treatment Market Volume (K Unit) Forecast, by Application 2019 & 2032
- Table 43: Rest of Asia Pacific Multiple Sclerosis Drugs and Treatment Market Revenue (Million) Forecast, by Application 2019 & 2032
- Table 44: Rest of Asia Pacific Multiple Sclerosis Drugs and Treatment Market Volume (K Unit) Forecast, by Application 2019 & 2032
- Table 45: Global Multiple Sclerosis Drugs and Treatment Market Revenue Million Forecast, by Country 2019 & 2032
- Table 46: Global Multiple Sclerosis Drugs and Treatment Market Volume K Unit Forecast, by Country 2019 & 2032
- Table 47: GCC Multiple Sclerosis Drugs and Treatment Market Revenue (Million) Forecast, by Application 2019 & 2032
- Table 48: GCC Multiple Sclerosis Drugs and Treatment Market Volume (K Unit) Forecast, by Application 2019 & 2032
- Table 49: South Africa Multiple Sclerosis Drugs and Treatment Market Revenue (Million) Forecast, by Application 2019 & 2032
- Table 50: South Africa Multiple Sclerosis Drugs and Treatment Market Volume (K Unit) Forecast, by Application 2019 & 2032
- Table 51: Rest of Middle East and Africa Multiple Sclerosis Drugs and Treatment Market Revenue (Million) Forecast, by Application 2019 & 2032
- Table 52: Rest of Middle East and Africa Multiple Sclerosis Drugs and Treatment Market Volume (K Unit) Forecast, by Application 2019 & 2032
- Table 53: Global Multiple Sclerosis Drugs and Treatment Market Revenue Million Forecast, by Country 2019 & 2032
- Table 54: Global Multiple Sclerosis Drugs and Treatment Market Volume K Unit Forecast, by Country 2019 & 2032
- Table 55: Brazil Multiple Sclerosis Drugs and Treatment Market Revenue (Million) Forecast, by Application 2019 & 2032
- Table 56: Brazil Multiple Sclerosis Drugs and Treatment Market Volume (K Unit) Forecast, by Application 2019 & 2032
- Table 57: Argentina Multiple Sclerosis Drugs and Treatment Market Revenue (Million) Forecast, by Application 2019 & 2032
- Table 58: Argentina Multiple Sclerosis Drugs and Treatment Market Volume (K Unit) Forecast, by Application 2019 & 2032
- Table 59: Rest of South America Multiple Sclerosis Drugs and Treatment Market Revenue (Million) Forecast, by Application 2019 & 2032
- Table 60: Rest of South America Multiple Sclerosis Drugs and Treatment Market Volume (K Unit) Forecast, by Application 2019 & 2032
- Table 61: Global Multiple Sclerosis Drugs and Treatment Market Revenue Million Forecast, by Drug Type 2019 & 2032
- Table 62: Global Multiple Sclerosis Drugs and Treatment Market Volume K Unit Forecast, by Drug Type 2019 & 2032
- Table 63: Global Multiple Sclerosis Drugs and Treatment Market Revenue Million Forecast, by Route of Administration 2019 & 2032
- Table 64: Global Multiple Sclerosis Drugs and Treatment Market Volume K Unit Forecast, by Route of Administration 2019 & 2032
- Table 65: Global Multiple Sclerosis Drugs and Treatment Market Revenue Million Forecast, by Country 2019 & 2032
- Table 66: Global Multiple Sclerosis Drugs and Treatment Market Volume K Unit Forecast, by Country 2019 & 2032
- Table 67: United States Multiple Sclerosis Drugs and Treatment Market Revenue (Million) Forecast, by Application 2019 & 2032
- Table 68: United States Multiple Sclerosis Drugs and Treatment Market Volume (K Unit) Forecast, by Application 2019 & 2032
- Table 69: Canada Multiple Sclerosis Drugs and Treatment Market Revenue (Million) Forecast, by Application 2019 & 2032
- Table 70: Canada Multiple Sclerosis Drugs and Treatment Market Volume (K Unit) Forecast, by Application 2019 & 2032
- Table 71: Mexico Multiple Sclerosis Drugs and Treatment Market Revenue (Million) Forecast, by Application 2019 & 2032
- Table 72: Mexico Multiple Sclerosis Drugs and Treatment Market Volume (K Unit) Forecast, by Application 2019 & 2032
- Table 73: Global Multiple Sclerosis Drugs and Treatment Market Revenue Million Forecast, by Drug Type 2019 & 2032
- Table 74: Global Multiple Sclerosis Drugs and Treatment Market Volume K Unit Forecast, by Drug Type 2019 & 2032
- Table 75: Global Multiple Sclerosis Drugs and Treatment Market Revenue Million Forecast, by Route of Administration 2019 & 2032
- Table 76: Global Multiple Sclerosis Drugs and Treatment Market Volume K Unit Forecast, by Route of Administration 2019 & 2032
- Table 77: Global Multiple Sclerosis Drugs and Treatment Market Revenue Million Forecast, by Country 2019 & 2032
- Table 78: Global Multiple Sclerosis Drugs and Treatment Market Volume K Unit Forecast, by Country 2019 & 2032
- Table 79: Germany Multiple Sclerosis Drugs and Treatment Market Revenue (Million) Forecast, by Application 2019 & 2032
- Table 80: Germany Multiple Sclerosis Drugs and Treatment Market Volume (K Unit) Forecast, by Application 2019 & 2032
- Table 81: United Kingdom Multiple Sclerosis Drugs and Treatment Market Revenue (Million) Forecast, by Application 2019 & 2032
- Table 82: United Kingdom Multiple Sclerosis Drugs and Treatment Market Volume (K Unit) Forecast, by Application 2019 & 2032
- Table 83: France Multiple Sclerosis Drugs and Treatment Market Revenue (Million) Forecast, by Application 2019 & 2032
- Table 84: France Multiple Sclerosis Drugs and Treatment Market Volume (K Unit) Forecast, by Application 2019 & 2032
- Table 85: Italy Multiple Sclerosis Drugs and Treatment Market Revenue (Million) Forecast, by Application 2019 & 2032
- Table 86: Italy Multiple Sclerosis Drugs and Treatment Market Volume (K Unit) Forecast, by Application 2019 & 2032
- Table 87: Spain Multiple Sclerosis Drugs and Treatment Market Revenue (Million) Forecast, by Application 2019 & 2032
- Table 88: Spain Multiple Sclerosis Drugs and Treatment Market Volume (K Unit) Forecast, by Application 2019 & 2032
- Table 89: Rest of Europe Multiple Sclerosis Drugs and Treatment Market Revenue (Million) Forecast, by Application 2019 & 2032
- Table 90: Rest of Europe Multiple Sclerosis Drugs and Treatment Market Volume (K Unit) Forecast, by Application 2019 & 2032
- Table 91: Global Multiple Sclerosis Drugs and Treatment Market Revenue Million Forecast, by Drug Type 2019 & 2032
- Table 92: Global Multiple Sclerosis Drugs and Treatment Market Volume K Unit Forecast, by Drug Type 2019 & 2032
- Table 93: Global Multiple Sclerosis Drugs and Treatment Market Revenue Million Forecast, by Route of Administration 2019 & 2032
- Table 94: Global Multiple Sclerosis Drugs and Treatment Market Volume K Unit Forecast, by Route of Administration 2019 & 2032
- Table 95: Global Multiple Sclerosis Drugs and Treatment Market Revenue Million Forecast, by Country 2019 & 2032
- Table 96: Global Multiple Sclerosis Drugs and Treatment Market Volume K Unit Forecast, by Country 2019 & 2032
- Table 97: China Multiple Sclerosis Drugs and Treatment Market Revenue (Million) Forecast, by Application 2019 & 2032
- Table 98: China Multiple Sclerosis Drugs and Treatment Market Volume (K Unit) Forecast, by Application 2019 & 2032
- Table 99: Japan Multiple Sclerosis Drugs and Treatment Market Revenue (Million) Forecast, by Application 2019 & 2032
- Table 100: Japan Multiple Sclerosis Drugs and Treatment Market Volume (K Unit) Forecast, by Application 2019 & 2032
- Table 101: India Multiple Sclerosis Drugs and Treatment Market Revenue (Million) Forecast, by Application 2019 & 2032
- Table 102: India Multiple Sclerosis Drugs and Treatment Market Volume (K Unit) Forecast, by Application 2019 & 2032
- Table 103: Australia Multiple Sclerosis Drugs and Treatment Market Revenue (Million) Forecast, by Application 2019 & 2032
- Table 104: Australia Multiple Sclerosis Drugs and Treatment Market Volume (K Unit) Forecast, by Application 2019 & 2032
- Table 105: South Korea Multiple Sclerosis Drugs and Treatment Market Revenue (Million) Forecast, by Application 2019 & 2032
- Table 106: South Korea Multiple Sclerosis Drugs and Treatment Market Volume (K Unit) Forecast, by Application 2019 & 2032
- Table 107: Rest of Asia Pacific Multiple Sclerosis Drugs and Treatment Market Revenue (Million) Forecast, by Application 2019 & 2032
- Table 108: Rest of Asia Pacific Multiple Sclerosis Drugs and Treatment Market Volume (K Unit) Forecast, by Application 2019 & 2032
- Table 109: Global Multiple Sclerosis Drugs and Treatment Market Revenue Million Forecast, by Drug Type 2019 & 2032
- Table 110: Global Multiple Sclerosis Drugs and Treatment Market Volume K Unit Forecast, by Drug Type 2019 & 2032
- Table 111: Global Multiple Sclerosis Drugs and Treatment Market Revenue Million Forecast, by Route of Administration 2019 & 2032
- Table 112: Global Multiple Sclerosis Drugs and Treatment Market Volume K Unit Forecast, by Route of Administration 2019 & 2032
- Table 113: Global Multiple Sclerosis Drugs and Treatment Market Revenue Million Forecast, by Country 2019 & 2032
- Table 114: Global Multiple Sclerosis Drugs and Treatment Market Volume K Unit Forecast, by Country 2019 & 2032
- Table 115: GCC Multiple Sclerosis Drugs and Treatment Market Revenue (Million) Forecast, by Application 2019 & 2032
- Table 116: GCC Multiple Sclerosis Drugs and Treatment Market Volume (K Unit) Forecast, by Application 2019 & 2032
- Table 117: South Africa Multiple Sclerosis Drugs and Treatment Market Revenue (Million) Forecast, by Application 2019 & 2032
- Table 118: South Africa Multiple Sclerosis Drugs and Treatment Market Volume (K Unit) Forecast, by Application 2019 & 2032
- Table 119: Rest of Middle East and Africa Multiple Sclerosis Drugs and Treatment Market Revenue (Million) Forecast, by Application 2019 & 2032
- Table 120: Rest of Middle East and Africa Multiple Sclerosis Drugs and Treatment Market Volume (K Unit) Forecast, by Application 2019 & 2032
- Table 121: Global Multiple Sclerosis Drugs and Treatment Market Revenue Million Forecast, by Drug Type 2019 & 2032
- Table 122: Global Multiple Sclerosis Drugs and Treatment Market Volume K Unit Forecast, by Drug Type 2019 & 2032
- Table 123: Global Multiple Sclerosis Drugs and Treatment Market Revenue Million Forecast, by Route of Administration 2019 & 2032
- Table 124: Global Multiple Sclerosis Drugs and Treatment Market Volume K Unit Forecast, by Route of Administration 2019 & 2032
- Table 125: Global Multiple Sclerosis Drugs and Treatment Market Revenue Million Forecast, by Country 2019 & 2032
- Table 126: Global Multiple Sclerosis Drugs and Treatment Market Volume K Unit Forecast, by Country 2019 & 2032
- Table 127: Brazil Multiple Sclerosis Drugs and Treatment Market Revenue (Million) Forecast, by Application 2019 & 2032
- Table 128: Brazil Multiple Sclerosis Drugs and Treatment Market Volume (K Unit) Forecast, by Application 2019 & 2032
- Table 129: Argentina Multiple Sclerosis Drugs and Treatment Market Revenue (Million) Forecast, by Application 2019 & 2032
- Table 130: Argentina Multiple Sclerosis Drugs and Treatment Market Volume (K Unit) Forecast, by Application 2019 & 2032
- Table 131: Rest of South America Multiple Sclerosis Drugs and Treatment Market Revenue (Million) Forecast, by Application 2019 & 2032
- Table 132: Rest of South America Multiple Sclerosis Drugs and Treatment Market Volume (K Unit) Forecast, by Application 2019 & 2032
Frequently Asked Questions
1. What is the projected Compound Annual Growth Rate (CAGR) of the Multiple Sclerosis Drugs and Treatment Market?
The projected CAGR is approximately 3.87%.
2. Which companies are prominent players in the Multiple Sclerosis Drugs and Treatment Market?
Key companies in the market include Sanofi SA, Merck KGaA, Bayer AG, Novartis AG, Biogen, Johnson & Johnson, Teva Pharmaceuticals Industries Ltd, F Hoffmann-La Roche AG, Acorda Therapeutics Inc, Viatris Inc (Mylan NV), Bristol-Myers Squibb Company.
3. What are the main segments of the Multiple Sclerosis Drugs and Treatment Market?
The market segments include Drug Type, Route of Administration.
4. Can you provide details about the market size?
The market size is estimated to be USD 31.03 Million as of 2022.
5. What are some drivers contributing to market growth?
Rising Cases of Multiple Sclerosis across the World; Growing Focus of Companies on Pipeline Products for MS.
6. What are the notable trends driving market growth?
The Oral Route of Administration is Expected to Witness Rapid Growth in Over the Forecast Period.
7. Are there any restraints impacting market growth?
Side Effects Associated with the Medication; High Cost of the Drugs.
8. Can you provide examples of recent developments in the market?
October 2023: Bristol Myers Squibb presented Zeposia's (ozanimod) data on long-term disease progression and cognition in patients with relapsing forms of multiple sclerosis (MS). 76% of patients treated with Zeposia for relapsing multiple sclerosis (RMS) were free of six-month confirmed disability progression (CDP).
9. What pricing options are available for accessing the report?
Pricing options include single-user, multi-user, and enterprise licenses priced at USD 4750, USD 5250, and USD 8750 respectively.
10. Is the market size provided in terms of value or volume?
The market size is provided in terms of value, measured in Million and volume, measured in K Unit.
11. Are there any specific market keywords associated with the report?
Yes, the market keyword associated with the report is "Multiple Sclerosis Drugs and Treatment Market," which aids in identifying and referencing the specific market segment covered.
12. How do I determine which pricing option suits my needs best?
The pricing options vary based on user requirements and access needs. Individual users may opt for single-user licenses, while businesses requiring broader access may choose multi-user or enterprise licenses for cost-effective access to the report.
13. Are there any additional resources or data provided in the Multiple Sclerosis Drugs and Treatment Market report?
While the report offers comprehensive insights, it's advisable to review the specific contents or supplementary materials provided to ascertain if additional resources or data are available.
14. How can I stay updated on further developments or reports in the Multiple Sclerosis Drugs and Treatment Market?
To stay informed about further developments, trends, and reports in the Multiple Sclerosis Drugs and Treatment Market, consider subscribing to industry newsletters, following relevant companies and organizations, or regularly checking reputable industry news sources and publications.
Methodology
Step 1 - Identification of Relevant Samples Size from Population Database


Step 2 - Approaches for Defining Global Market Size (Value, Volume* & Price*)

Note*: In applicable scenarios
Step 3 - Data Sources
Primary Research
- Web Analytics
- Survey Reports
- Research Institute
- Latest Research Reports
- Opinion Leaders
Secondary Research
- Annual Reports
- White Paper
- Latest Press Release
- Industry Association
- Paid Database
- Investor Presentations

Step 4 - Data Triangulation
Involves using different sources of information in order to increase the validity of a study
These sources are likely to be stakeholders in a program - participants, other researchers, program staff, other community members, and so on.
Then we put all data in single framework & apply various statistical tools to find out the dynamic on the market.
During the analysis stage, feedback from the stakeholder groups would be compared to determine areas of agreement as well as areas of divergence
