

Key Insights
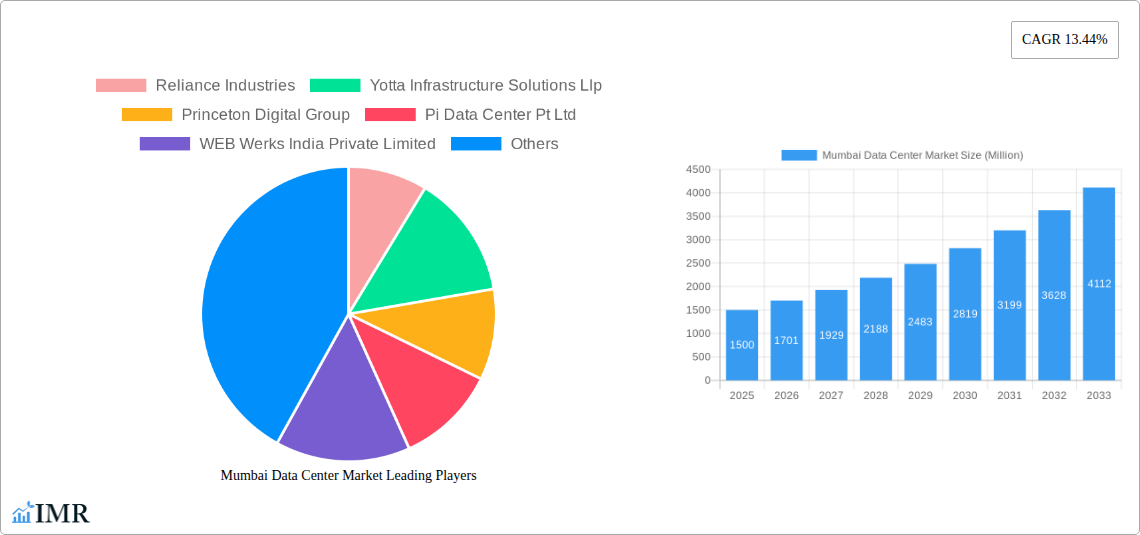
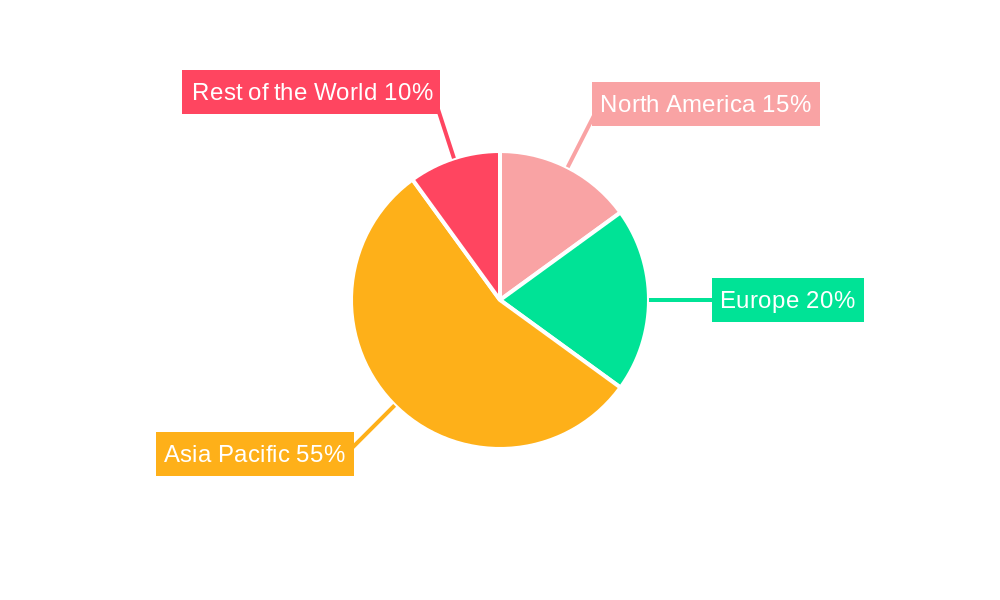
The Mumbai data center market is experiencing robust growth, driven by the burgeoning digital economy, increasing cloud adoption, and the expanding presence of hyperscale operators. A CAGR of 13.44% suggests a significant market expansion, indicating substantial investment in infrastructure to meet the rising demand for data storage and processing capabilities. The market is segmented across various parameters including absorption (utilized and non-utilized space), colocation type (retail, wholesale, hyperscale), end-user sectors (cloud & IT, telecom, media & entertainment, government, BFSI, manufacturing, e-commerce, and others), data center size (small, medium, large, massive, mega), and tier type (Tier 1, Tier 2, Tier 3). The dominance of specific segments, such as hyperscale colocation and the cloud & IT sector, is likely given the rapid digital transformation across industries. Major players like Reliance Industries, Yotta Infrastructure, and Equinix are key contributors to the market's growth, competing for market share within this dynamic landscape. The geographical distribution likely shows Asia Pacific, specifically India, as a significant contributor, while North America and Europe maintain substantial but potentially slower growth rates compared to the rapidly developing Asia Pacific region. Constraints could include infrastructure limitations, power availability challenges, and regulatory hurdles.
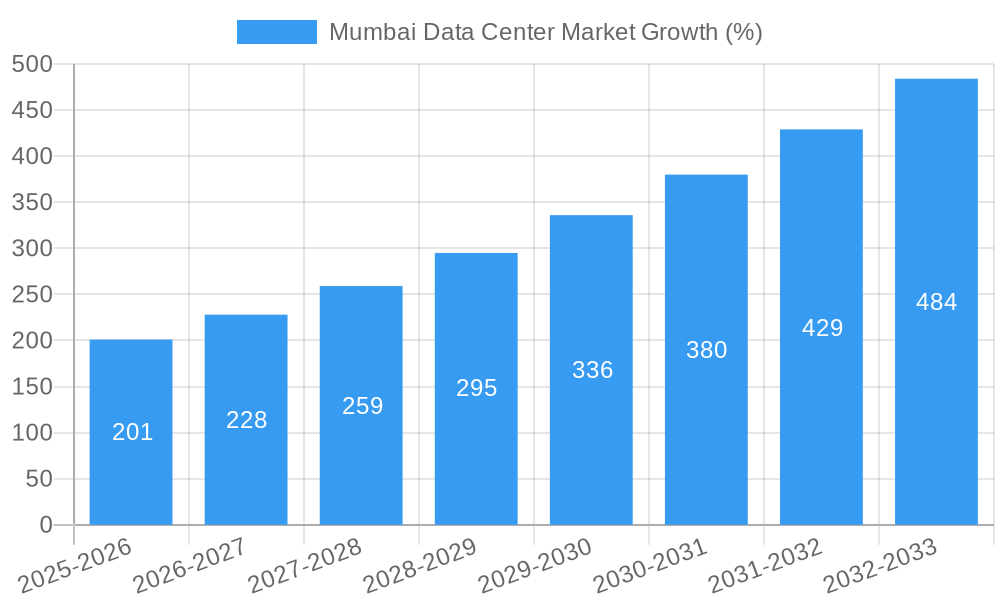
The forecast period (2025-2033) projects continued expansion, driven by factors such as the increasing adoption of 5G technology, the growth of the Internet of Things (IoT), and the government's push for digital initiatives in India. However, potential challenges remain, including land scarcity and rising energy costs. The competitive landscape is intensifying with both established players and new entrants vying for market share. This necessitates strategic partnerships, technological advancements, and operational efficiencies to thrive. Furthermore, the market is likely to witness a shift towards sustainable data center practices, driven by increasing environmental concerns and regulations. The analysis of Mumbai’s specific market will require additional data for a deeper understanding of local trends and the impact of unique local factors.
Mumbai Data Center Market: A Comprehensive Report (2019-2033)
This in-depth report provides a comprehensive analysis of the Mumbai data center market, encompassing market dynamics, growth trends, key players, and future outlook. The study period covers 2019-2033, with 2025 as the base and estimated year. This report is crucial for industry professionals, investors, and strategic decision-makers seeking to understand and capitalize on opportunities within this rapidly evolving market. The report segments the market by absorption (utilized, non-utilized), colocation type (retail, wholesale, hyperscale), end-user (cloud & IT, telecom, media & entertainment, government, BFSI, manufacturing, e-commerce, others), data center size (small, medium, large, massive, mega), and tier type (Tier 1, Tier 2, Tier 3, Tier 4).
Parent Market: Indian Data Center Market Child Market: Mumbai Data Center Market
Mumbai Data Center Market Dynamics & Structure
The Mumbai data center market exhibits a moderately concentrated structure, with key players such as Reliance Industries, Yotta Infrastructure Solutions LLP, and Equinix holding significant market share. Technological innovation, driven by increasing demand for cloud services and the adoption of advanced technologies like AI and IoT, fuels market growth. However, regulatory frameworks and the availability of reliable power infrastructure remain critical factors. Competition is intense, with existing players constantly upgrading their facilities and new entrants aiming to capture market share. The market witnesses significant M&A activity, with larger players acquiring smaller firms to expand their footprint and service offerings. The overall market size is predicted to reach xx Million USD by 2033.
- Market Concentration: Moderately concentrated, with top players holding xx% market share (2025).
- Technological Innovation: High adoption of AI, IoT, and edge computing drives demand.
- Regulatory Framework: Government initiatives regarding data localization and cybersecurity influence market dynamics.
- Competitive Substitutes: Cloud services and hybrid cloud models pose some level of substitution.
- M&A Activity: A moderate number of M&A deals are observed, estimated at xx deals annually (2022-2024).
- Innovation Barriers: High capital expenditure and skilled workforce availability present challenges.
Mumbai Data Center Market Growth Trends & Insights
The Mumbai data center market has experienced significant growth over the historical period (2019-2024), with a CAGR of xx%. This growth is fueled by increasing digitalization, expanding cloud adoption, and the burgeoning e-commerce sector. The market is expected to continue this trajectory during the forecast period (2025-2033), driven by the rising demand for data storage and processing across various industries. Technological disruptions, such as the emergence of edge computing, are creating new opportunities. Consumer behavior shifts, particularly the increased reliance on digital services, are further strengthening market growth. Market penetration in terms of data center capacity per capita is estimated at xx% in 2025 and is projected to reach xx% by 2033.
- Market Size (Million USD): 2019: xx; 2024: xx; 2025: xx; 2033: xx (projected)
- CAGR (2019-2024): xx%
- CAGR (2025-2033): xx% (projected)
- Market Penetration (2025): xx%
- Market Penetration (2033): xx% (projected)
Dominant Regions, Countries, or Segments in Mumbai Data Center Market
Within the Mumbai data center market, the utilized absorption segment demonstrates the most significant growth, driven by the increasing demand for data storage and processing capacity. The hyperscale colocation type is rapidly expanding due to the growing adoption of cloud services by large enterprises. In terms of end-users, the Cloud and IT sector leads the market, followed by the BFSI and Telecom sectors. The Large and Mega data center size segments are experiencing robust growth as hyperscale providers expand their footprint. The Tier III and Tier IV data centers are gaining popularity due to their high level of reliability and redundancy.
- Key Growth Drivers: Strong economic growth, supportive government policies, and rising investments in digital infrastructure.
- Dominant Segments: Utilized absorption, Hyperscale colocation, Cloud & IT end-users, Large & Mega data center sizes, Tier III & Tier IV data centers.
- Market Share (2025): Utilized: xx%; Hyperscale: xx%; Cloud & IT: xx%; Large: xx%; Tier III: xx%.
Mumbai Data Center Market Product Landscape
The Mumbai data center market offers a diverse range of products and services, including colocation, managed services, cloud connectivity, and cybersecurity solutions. Recent product innovations focus on enhanced energy efficiency, higher density deployments, and advanced security features. Data centers are increasingly utilizing AI-powered management systems for improved operational efficiency and predictive maintenance. The unique selling propositions often revolve around superior connectivity, resilient infrastructure, and tailored solutions to meet specific customer needs.
Key Drivers, Barriers & Challenges in Mumbai Data Center Market
Key Drivers:
- Increased digital transformation across sectors
- Growth of cloud computing and data analytics
- Government initiatives promoting digital infrastructure
Challenges and Restraints:
- High initial investment costs
- Power infrastructure limitations
- Skilled labor shortages
- Regulatory compliance complexities
- Intense competition
Emerging Opportunities in Mumbai Data Center Market
The Mumbai data center market presents exciting opportunities in areas such as edge computing deployments, the expansion of 5G networks, and the increasing demand for hybrid and multi-cloud solutions. Untapped markets exist within niche sectors and SMEs. Innovative applications are emerging, particularly in the areas of AI, IoT, and big data analytics.
Growth Accelerators in the Mumbai Data Center Market Industry
Long-term growth in the Mumbai data center market will be driven by continued technological advancements, strategic partnerships between data center providers and cloud service providers, and expansion into new geographic locations. Government incentives and investment in infrastructure are vital catalysts. The growing adoption of sustainable and green data center technologies will also play a significant role.
Key Players Shaping the Mumbai Data Center Market
- Reliance Industries
- Yotta Infrastructure Solutions LLP
- Princeton Digital Group
- Pi Data Center Pt Ltd
- WEB Werks India Private Limited
- ESDS Software Solution Limited
- Equinix
- Sify Technologies Limited
- NTT Data
- CtrlS
- Nxtra Data Limited
- STT Telemedia
- Colt Technology Services
Notable Milestones in Mumbai Data Center Market Sector
- Jan 2023: Web Werks announces the opening of its Mumbai-2 data center with a 10 MW capacity.
- Mar 2022: ZR Power Holdings plans a large data center in Navi Mumbai with an investment exceeding INR 1,700 crore.
In-Depth Mumbai Data Center Market Outlook
The Mumbai data center market is poised for continued strong growth driven by the aforementioned factors. Strategic opportunities lie in providing tailored solutions for specific industry verticals, investing in advanced technologies, and forming strategic partnerships to expand market reach. The focus on sustainability and energy efficiency will become increasingly important in shaping the future of the market.
Mumbai Data Center Market Segmentation
-
1. DC Size
- 1.1. Small
- 1.2. Medium
- 1.3. Large
- 1.4. Massive
- 1.5. Mega
-
2. Tier Type
- 2.1. Tier 1 and 2
- 2.2. Tier 3
- 2.3. Tier 4
-
3. Absorption
-
3.1. Utilized
-
3.1.1. By Colocation Type
- 3.1.1.1. Retail
- 3.1.1.2. Wholesale
- 3.1.1.3. Hyperscale
-
3.1.2. By End User
- 3.1.2.1. Cloud and IT
- 3.1.2.2. Telecom
- 3.1.2.3. Media and Entertainment
- 3.1.2.4. Government
- 3.1.2.5. BFSI
- 3.1.2.6. Manufacturing
- 3.1.2.7. E-Commerce
- 3.1.2.8. Other End Users
-
3.1.1. By Colocation Type
- 3.2. Non-Utilized
-
3.1. Utilized
Mumbai Data Center Market Segmentation By Geography
-
1. North America
- 1.1. United States
- 1.2. Canada
- 1.3. Mexico
-
2. South America
- 2.1. Brazil
- 2.2. Argentina
- 2.3. Rest of South America
-
3. Europe
- 3.1. United Kingdom
- 3.2. Germany
- 3.3. France
- 3.4. Italy
- 3.5. Spain
- 3.6. Russia
- 3.7. Benelux
- 3.8. Nordics
- 3.9. Rest of Europe
-
4. Middle East & Africa
- 4.1. Turkey
- 4.2. Israel
- 4.3. GCC
- 4.4. North Africa
- 4.5. South Africa
- 4.6. Rest of Middle East & Africa
-
5. Asia Pacific
- 5.1. China
- 5.2. India
- 5.3. Japan
- 5.4. South Korea
- 5.5. ASEAN
- 5.6. Oceania
- 5.7. Rest of Asia Pacific
Mumbai Data Center Market REPORT HIGHLIGHTS
| Aspects | Details |
|---|---|
| Study Period | 2019-2033 |
| Base Year | 2024 |
| Estimated Year | 2025 |
| Forecast Period | 2025-2033 |
| Historical Period | 2019-2024 |
| Growth Rate | CAGR of 13.44% from 2019-2033 |
| Segmentation |
|
Table of Contents
- 1. Introduction
- 1.1. Research Scope
- 1.2. Market Segmentation
- 1.3. Research Methodology
- 1.4. Definitions and Assumptions
- 2. Executive Summary
- 2.1. Introduction
- 3. Market Dynamics
- 3.1. Introduction
- 3.2. Market Drivers
- 3.2.1. Reduction in Power Consumption With the Use of Silicon Photonics Based Transceivers; Growing Need for High-Speed Connectivity and High Data Transfer Capabilities Across Data Centers
- 3.3. Market Restrains
- 3.3.1. Risk of Thermal Effect
- 3.4. Market Trends
- 3.4.1. Smartphones To Drive the Market Growth
- 4. Market Factor Analysis
- 4.1. Porters Five Forces
- 4.2. Supply/Value Chain
- 4.3. PESTEL analysis
- 4.4. Market Entropy
- 4.5. Patent/Trademark Analysis
- 5. Global Mumbai Data Center Market Analysis, Insights and Forecast, 2019-2031
- 5.1. Market Analysis, Insights and Forecast - by DC Size
- 5.1.1. Small
- 5.1.2. Medium
- 5.1.3. Large
- 5.1.4. Massive
- 5.1.5. Mega
- 5.2. Market Analysis, Insights and Forecast - by Tier Type
- 5.2.1. Tier 1 and 2
- 5.2.2. Tier 3
- 5.2.3. Tier 4
- 5.3. Market Analysis, Insights and Forecast - by Absorption
- 5.3.1. Utilized
- 5.3.1.1. By Colocation Type
- 5.3.1.1.1. Retail
- 5.3.1.1.2. Wholesale
- 5.3.1.1.3. Hyperscale
- 5.3.1.2. By End User
- 5.3.1.2.1. Cloud and IT
- 5.3.1.2.2. Telecom
- 5.3.1.2.3. Media and Entertainment
- 5.3.1.2.4. Government
- 5.3.1.2.5. BFSI
- 5.3.1.2.6. Manufacturing
- 5.3.1.2.7. E-Commerce
- 5.3.1.2.8. Other End Users
- 5.3.1.1. By Colocation Type
- 5.3.2. Non-Utilized
- 5.3.1. Utilized
- 5.4. Market Analysis, Insights and Forecast - by Region
- 5.4.1. North America
- 5.4.2. South America
- 5.4.3. Europe
- 5.4.4. Middle East & Africa
- 5.4.5. Asia Pacific
- 5.1. Market Analysis, Insights and Forecast - by DC Size
- 6. North America Mumbai Data Center Market Analysis, Insights and Forecast, 2019-2031
- 6.1. Market Analysis, Insights and Forecast - by DC Size
- 6.1.1. Small
- 6.1.2. Medium
- 6.1.3. Large
- 6.1.4. Massive
- 6.1.5. Mega
- 6.2. Market Analysis, Insights and Forecast - by Tier Type
- 6.2.1. Tier 1 and 2
- 6.2.2. Tier 3
- 6.2.3. Tier 4
- 6.3. Market Analysis, Insights and Forecast - by Absorption
- 6.3.1. Utilized
- 6.3.1.1. By Colocation Type
- 6.3.1.1.1. Retail
- 6.3.1.1.2. Wholesale
- 6.3.1.1.3. Hyperscale
- 6.3.1.2. By End User
- 6.3.1.2.1. Cloud and IT
- 6.3.1.2.2. Telecom
- 6.3.1.2.3. Media and Entertainment
- 6.3.1.2.4. Government
- 6.3.1.2.5. BFSI
- 6.3.1.2.6. Manufacturing
- 6.3.1.2.7. E-Commerce
- 6.3.1.2.8. Other End Users
- 6.3.1.1. By Colocation Type
- 6.3.2. Non-Utilized
- 6.3.1. Utilized
- 6.1. Market Analysis, Insights and Forecast - by DC Size
- 7. South America Mumbai Data Center Market Analysis, Insights and Forecast, 2019-2031
- 7.1. Market Analysis, Insights and Forecast - by DC Size
- 7.1.1. Small
- 7.1.2. Medium
- 7.1.3. Large
- 7.1.4. Massive
- 7.1.5. Mega
- 7.2. Market Analysis, Insights and Forecast - by Tier Type
- 7.2.1. Tier 1 and 2
- 7.2.2. Tier 3
- 7.2.3. Tier 4
- 7.3. Market Analysis, Insights and Forecast - by Absorption
- 7.3.1. Utilized
- 7.3.1.1. By Colocation Type
- 7.3.1.1.1. Retail
- 7.3.1.1.2. Wholesale
- 7.3.1.1.3. Hyperscale
- 7.3.1.2. By End User
- 7.3.1.2.1. Cloud and IT
- 7.3.1.2.2. Telecom
- 7.3.1.2.3. Media and Entertainment
- 7.3.1.2.4. Government
- 7.3.1.2.5. BFSI
- 7.3.1.2.6. Manufacturing
- 7.3.1.2.7. E-Commerce
- 7.3.1.2.8. Other End Users
- 7.3.1.1. By Colocation Type
- 7.3.2. Non-Utilized
- 7.3.1. Utilized
- 7.1. Market Analysis, Insights and Forecast - by DC Size
- 8. Europe Mumbai Data Center Market Analysis, Insights and Forecast, 2019-2031
- 8.1. Market Analysis, Insights and Forecast - by DC Size
- 8.1.1. Small
- 8.1.2. Medium
- 8.1.3. Large
- 8.1.4. Massive
- 8.1.5. Mega
- 8.2. Market Analysis, Insights and Forecast - by Tier Type
- 8.2.1. Tier 1 and 2
- 8.2.2. Tier 3
- 8.2.3. Tier 4
- 8.3. Market Analysis, Insights and Forecast - by Absorption
- 8.3.1. Utilized
- 8.3.1.1. By Colocation Type
- 8.3.1.1.1. Retail
- 8.3.1.1.2. Wholesale
- 8.3.1.1.3. Hyperscale
- 8.3.1.2. By End User
- 8.3.1.2.1. Cloud and IT
- 8.3.1.2.2. Telecom
- 8.3.1.2.3. Media and Entertainment
- 8.3.1.2.4. Government
- 8.3.1.2.5. BFSI
- 8.3.1.2.6. Manufacturing
- 8.3.1.2.7. E-Commerce
- 8.3.1.2.8. Other End Users
- 8.3.1.1. By Colocation Type
- 8.3.2. Non-Utilized
- 8.3.1. Utilized
- 8.1. Market Analysis, Insights and Forecast - by DC Size
- 9. Middle East & Africa Mumbai Data Center Market Analysis, Insights and Forecast, 2019-2031
- 9.1. Market Analysis, Insights and Forecast - by DC Size
- 9.1.1. Small
- 9.1.2. Medium
- 9.1.3. Large
- 9.1.4. Massive
- 9.1.5. Mega
- 9.2. Market Analysis, Insights and Forecast - by Tier Type
- 9.2.1. Tier 1 and 2
- 9.2.2. Tier 3
- 9.2.3. Tier 4
- 9.3. Market Analysis, Insights and Forecast - by Absorption
- 9.3.1. Utilized
- 9.3.1.1. By Colocation Type
- 9.3.1.1.1. Retail
- 9.3.1.1.2. Wholesale
- 9.3.1.1.3. Hyperscale
- 9.3.1.2. By End User
- 9.3.1.2.1. Cloud and IT
- 9.3.1.2.2. Telecom
- 9.3.1.2.3. Media and Entertainment
- 9.3.1.2.4. Government
- 9.3.1.2.5. BFSI
- 9.3.1.2.6. Manufacturing
- 9.3.1.2.7. E-Commerce
- 9.3.1.2.8. Other End Users
- 9.3.1.1. By Colocation Type
- 9.3.2. Non-Utilized
- 9.3.1. Utilized
- 9.1. Market Analysis, Insights and Forecast - by DC Size
- 10. Asia Pacific Mumbai Data Center Market Analysis, Insights and Forecast, 2019-2031
- 10.1. Market Analysis, Insights and Forecast - by DC Size
- 10.1.1. Small
- 10.1.2. Medium
- 10.1.3. Large
- 10.1.4. Massive
- 10.1.5. Mega
- 10.2. Market Analysis, Insights and Forecast - by Tier Type
- 10.2.1. Tier 1 and 2
- 10.2.2. Tier 3
- 10.2.3. Tier 4
- 10.3. Market Analysis, Insights and Forecast - by Absorption
- 10.3.1. Utilized
- 10.3.1.1. By Colocation Type
- 10.3.1.1.1. Retail
- 10.3.1.1.2. Wholesale
- 10.3.1.1.3. Hyperscale
- 10.3.1.2. By End User
- 10.3.1.2.1. Cloud and IT
- 10.3.1.2.2. Telecom
- 10.3.1.2.3. Media and Entertainment
- 10.3.1.2.4. Government
- 10.3.1.2.5. BFSI
- 10.3.1.2.6. Manufacturing
- 10.3.1.2.7. E-Commerce
- 10.3.1.2.8. Other End Users
- 10.3.1.1. By Colocation Type
- 10.3.2. Non-Utilized
- 10.3.1. Utilized
- 10.1. Market Analysis, Insights and Forecast - by DC Size
- 11. North America Mumbai Data Center Market Analysis, Insights and Forecast, 2019-2031
- 11.1. Market Analysis, Insights and Forecast - By Country/Sub-region
- 11.1.1.
- 12. Europe Mumbai Data Center Market Analysis, Insights and Forecast, 2019-2031
- 12.1. Market Analysis, Insights and Forecast - By Country/Sub-region
- 12.1.1.
- 13. Asia Pacific Mumbai Data Center Market Analysis, Insights and Forecast, 2019-2031
- 13.1. Market Analysis, Insights and Forecast - By Country/Sub-region
- 13.1.1.
- 14. Rest of the World Mumbai Data Center Market Analysis, Insights and Forecast, 2019-2031
- 14.1. Market Analysis, Insights and Forecast - By Country/Sub-region
- 14.1.1.
- 15. Competitive Analysis
- 15.1. Global Market Share Analysis 2024
- 15.2. Company Profiles
- 15.2.1 Reliance Industries
- 15.2.1.1. Overview
- 15.2.1.2. Products
- 15.2.1.3. SWOT Analysis
- 15.2.1.4. Recent Developments
- 15.2.1.5. Financials (Based on Availability)
- 15.2.2 Yotta Infrastructure Solutions Llp
- 15.2.2.1. Overview
- 15.2.2.2. Products
- 15.2.2.3. SWOT Analysis
- 15.2.2.4. Recent Developments
- 15.2.2.5. Financials (Based on Availability)
- 15.2.3 Princeton Digital Group
- 15.2.3.1. Overview
- 15.2.3.2. Products
- 15.2.3.3. SWOT Analysis
- 15.2.3.4. Recent Developments
- 15.2.3.5. Financials (Based on Availability)
- 15.2.4 Pi Data Center Pt Ltd
- 15.2.4.1. Overview
- 15.2.4.2. Products
- 15.2.4.3. SWOT Analysis
- 15.2.4.4. Recent Developments
- 15.2.4.5. Financials (Based on Availability)
- 15.2.5 WEB Werks India Private Limited
- 15.2.5.1. Overview
- 15.2.5.2. Products
- 15.2.5.3. SWOT Analysis
- 15.2.5.4. Recent Developments
- 15.2.5.5. Financials (Based on Availability)
- 15.2.6 ESDS Software Solution Limited
- 15.2.6.1. Overview
- 15.2.6.2. Products
- 15.2.6.3. SWOT Analysis
- 15.2.6.4. Recent Developments
- 15.2.6.5. Financials (Based on Availability)
- 15.2.7 Equinix
- 15.2.7.1. Overview
- 15.2.7.2. Products
- 15.2.7.3. SWOT Analysis
- 15.2.7.4. Recent Developments
- 15.2.7.5. Financials (Based on Availability)
- 15.2.8 Sify Technologies Limited
- 15.2.8.1. Overview
- 15.2.8.2. Products
- 15.2.8.3. SWOT Analysis
- 15.2.8.4. Recent Developments
- 15.2.8.5. Financials (Based on Availability)
- 15.2.9 NTT Data
- 15.2.9.1. Overview
- 15.2.9.2. Products
- 15.2.9.3. SWOT Analysis
- 15.2.9.4. Recent Developments
- 15.2.9.5. Financials (Based on Availability)
- 15.2.10 CtrlS
- 15.2.10.1. Overview
- 15.2.10.2. Products
- 15.2.10.3. SWOT Analysis
- 15.2.10.4. Recent Developments
- 15.2.10.5. Financials (Based on Availability)
- 15.2.11 Nxtra Data Limited
- 15.2.11.1. Overview
- 15.2.11.2. Products
- 15.2.11.3. SWOT Analysis
- 15.2.11.4. Recent Developments
- 15.2.11.5. Financials (Based on Availability)
- 15.2.12 STT Telemedia
- 15.2.12.1. Overview
- 15.2.12.2. Products
- 15.2.12.3. SWOT Analysis
- 15.2.12.4. Recent Developments
- 15.2.12.5. Financials (Based on Availability)
- 15.2.13 Colt Technology Services7 2 Market Share Analysis (In terms of MW)7 3 List of Companie
- 15.2.13.1. Overview
- 15.2.13.2. Products
- 15.2.13.3. SWOT Analysis
- 15.2.13.4. Recent Developments
- 15.2.13.5. Financials (Based on Availability)
- 15.2.1 Reliance Industries
List of Figures
- Figure 1: Global Mumbai Data Center Market Revenue Breakdown (Million, %) by Region 2024 & 2032
- Figure 2: North America Mumbai Data Center Market Revenue (Million), by Country 2024 & 2032
- Figure 3: North America Mumbai Data Center Market Revenue Share (%), by Country 2024 & 2032
- Figure 4: Europe Mumbai Data Center Market Revenue (Million), by Country 2024 & 2032
- Figure 5: Europe Mumbai Data Center Market Revenue Share (%), by Country 2024 & 2032
- Figure 6: Asia Pacific Mumbai Data Center Market Revenue (Million), by Country 2024 & 2032
- Figure 7: Asia Pacific Mumbai Data Center Market Revenue Share (%), by Country 2024 & 2032
- Figure 8: Rest of the World Mumbai Data Center Market Revenue (Million), by Country 2024 & 2032
- Figure 9: Rest of the World Mumbai Data Center Market Revenue Share (%), by Country 2024 & 2032
- Figure 10: North America Mumbai Data Center Market Revenue (Million), by DC Size 2024 & 2032
- Figure 11: North America Mumbai Data Center Market Revenue Share (%), by DC Size 2024 & 2032
- Figure 12: North America Mumbai Data Center Market Revenue (Million), by Tier Type 2024 & 2032
- Figure 13: North America Mumbai Data Center Market Revenue Share (%), by Tier Type 2024 & 2032
- Figure 14: North America Mumbai Data Center Market Revenue (Million), by Absorption 2024 & 2032
- Figure 15: North America Mumbai Data Center Market Revenue Share (%), by Absorption 2024 & 2032
- Figure 16: North America Mumbai Data Center Market Revenue (Million), by Country 2024 & 2032
- Figure 17: North America Mumbai Data Center Market Revenue Share (%), by Country 2024 & 2032
- Figure 18: South America Mumbai Data Center Market Revenue (Million), by DC Size 2024 & 2032
- Figure 19: South America Mumbai Data Center Market Revenue Share (%), by DC Size 2024 & 2032
- Figure 20: South America Mumbai Data Center Market Revenue (Million), by Tier Type 2024 & 2032
- Figure 21: South America Mumbai Data Center Market Revenue Share (%), by Tier Type 2024 & 2032
- Figure 22: South America Mumbai Data Center Market Revenue (Million), by Absorption 2024 & 2032
- Figure 23: South America Mumbai Data Center Market Revenue Share (%), by Absorption 2024 & 2032
- Figure 24: South America Mumbai Data Center Market Revenue (Million), by Country 2024 & 2032
- Figure 25: South America Mumbai Data Center Market Revenue Share (%), by Country 2024 & 2032
- Figure 26: Europe Mumbai Data Center Market Revenue (Million), by DC Size 2024 & 2032
- Figure 27: Europe Mumbai Data Center Market Revenue Share (%), by DC Size 2024 & 2032
- Figure 28: Europe Mumbai Data Center Market Revenue (Million), by Tier Type 2024 & 2032
- Figure 29: Europe Mumbai Data Center Market Revenue Share (%), by Tier Type 2024 & 2032
- Figure 30: Europe Mumbai Data Center Market Revenue (Million), by Absorption 2024 & 2032
- Figure 31: Europe Mumbai Data Center Market Revenue Share (%), by Absorption 2024 & 2032
- Figure 32: Europe Mumbai Data Center Market Revenue (Million), by Country 2024 & 2032
- Figure 33: Europe Mumbai Data Center Market Revenue Share (%), by Country 2024 & 2032
- Figure 34: Middle East & Africa Mumbai Data Center Market Revenue (Million), by DC Size 2024 & 2032
- Figure 35: Middle East & Africa Mumbai Data Center Market Revenue Share (%), by DC Size 2024 & 2032
- Figure 36: Middle East & Africa Mumbai Data Center Market Revenue (Million), by Tier Type 2024 & 2032
- Figure 37: Middle East & Africa Mumbai Data Center Market Revenue Share (%), by Tier Type 2024 & 2032
- Figure 38: Middle East & Africa Mumbai Data Center Market Revenue (Million), by Absorption 2024 & 2032
- Figure 39: Middle East & Africa Mumbai Data Center Market Revenue Share (%), by Absorption 2024 & 2032
- Figure 40: Middle East & Africa Mumbai Data Center Market Revenue (Million), by Country 2024 & 2032
- Figure 41: Middle East & Africa Mumbai Data Center Market Revenue Share (%), by Country 2024 & 2032
- Figure 42: Asia Pacific Mumbai Data Center Market Revenue (Million), by DC Size 2024 & 2032
- Figure 43: Asia Pacific Mumbai Data Center Market Revenue Share (%), by DC Size 2024 & 2032
- Figure 44: Asia Pacific Mumbai Data Center Market Revenue (Million), by Tier Type 2024 & 2032
- Figure 45: Asia Pacific Mumbai Data Center Market Revenue Share (%), by Tier Type 2024 & 2032
- Figure 46: Asia Pacific Mumbai Data Center Market Revenue (Million), by Absorption 2024 & 2032
- Figure 47: Asia Pacific Mumbai Data Center Market Revenue Share (%), by Absorption 2024 & 2032
- Figure 48: Asia Pacific Mumbai Data Center Market Revenue (Million), by Country 2024 & 2032
- Figure 49: Asia Pacific Mumbai Data Center Market Revenue Share (%), by Country 2024 & 2032
List of Tables
- Table 1: Global Mumbai Data Center Market Revenue Million Forecast, by Region 2019 & 2032
- Table 2: Global Mumbai Data Center Market Revenue Million Forecast, by DC Size 2019 & 2032
- Table 3: Global Mumbai Data Center Market Revenue Million Forecast, by Tier Type 2019 & 2032
- Table 4: Global Mumbai Data Center Market Revenue Million Forecast, by Absorption 2019 & 2032
- Table 5: Global Mumbai Data Center Market Revenue Million Forecast, by Region 2019 & 2032
- Table 6: Global Mumbai Data Center Market Revenue Million Forecast, by Country 2019 & 2032
- Table 7: Mumbai Data Center Market Revenue (Million) Forecast, by Application 2019 & 2032
- Table 8: Global Mumbai Data Center Market Revenue Million Forecast, by Country 2019 & 2032
- Table 9: Mumbai Data Center Market Revenue (Million) Forecast, by Application 2019 & 2032
- Table 10: Global Mumbai Data Center Market Revenue Million Forecast, by Country 2019 & 2032
- Table 11: Mumbai Data Center Market Revenue (Million) Forecast, by Application 2019 & 2032
- Table 12: Global Mumbai Data Center Market Revenue Million Forecast, by Country 2019 & 2032
- Table 13: Mumbai Data Center Market Revenue (Million) Forecast, by Application 2019 & 2032
- Table 14: Global Mumbai Data Center Market Revenue Million Forecast, by DC Size 2019 & 2032
- Table 15: Global Mumbai Data Center Market Revenue Million Forecast, by Tier Type 2019 & 2032
- Table 16: Global Mumbai Data Center Market Revenue Million Forecast, by Absorption 2019 & 2032
- Table 17: Global Mumbai Data Center Market Revenue Million Forecast, by Country 2019 & 2032
- Table 18: United States Mumbai Data Center Market Revenue (Million) Forecast, by Application 2019 & 2032
- Table 19: Canada Mumbai Data Center Market Revenue (Million) Forecast, by Application 2019 & 2032
- Table 20: Mexico Mumbai Data Center Market Revenue (Million) Forecast, by Application 2019 & 2032
- Table 21: Global Mumbai Data Center Market Revenue Million Forecast, by DC Size 2019 & 2032
- Table 22: Global Mumbai Data Center Market Revenue Million Forecast, by Tier Type 2019 & 2032
- Table 23: Global Mumbai Data Center Market Revenue Million Forecast, by Absorption 2019 & 2032
- Table 24: Global Mumbai Data Center Market Revenue Million Forecast, by Country 2019 & 2032
- Table 25: Brazil Mumbai Data Center Market Revenue (Million) Forecast, by Application 2019 & 2032
- Table 26: Argentina Mumbai Data Center Market Revenue (Million) Forecast, by Application 2019 & 2032
- Table 27: Rest of South America Mumbai Data Center Market Revenue (Million) Forecast, by Application 2019 & 2032
- Table 28: Global Mumbai Data Center Market Revenue Million Forecast, by DC Size 2019 & 2032
- Table 29: Global Mumbai Data Center Market Revenue Million Forecast, by Tier Type 2019 & 2032
- Table 30: Global Mumbai Data Center Market Revenue Million Forecast, by Absorption 2019 & 2032
- Table 31: Global Mumbai Data Center Market Revenue Million Forecast, by Country 2019 & 2032
- Table 32: United Kingdom Mumbai Data Center Market Revenue (Million) Forecast, by Application 2019 & 2032
- Table 33: Germany Mumbai Data Center Market Revenue (Million) Forecast, by Application 2019 & 2032
- Table 34: France Mumbai Data Center Market Revenue (Million) Forecast, by Application 2019 & 2032
- Table 35: Italy Mumbai Data Center Market Revenue (Million) Forecast, by Application 2019 & 2032
- Table 36: Spain Mumbai Data Center Market Revenue (Million) Forecast, by Application 2019 & 2032
- Table 37: Russia Mumbai Data Center Market Revenue (Million) Forecast, by Application 2019 & 2032
- Table 38: Benelux Mumbai Data Center Market Revenue (Million) Forecast, by Application 2019 & 2032
- Table 39: Nordics Mumbai Data Center Market Revenue (Million) Forecast, by Application 2019 & 2032
- Table 40: Rest of Europe Mumbai Data Center Market Revenue (Million) Forecast, by Application 2019 & 2032
- Table 41: Global Mumbai Data Center Market Revenue Million Forecast, by DC Size 2019 & 2032
- Table 42: Global Mumbai Data Center Market Revenue Million Forecast, by Tier Type 2019 & 2032
- Table 43: Global Mumbai Data Center Market Revenue Million Forecast, by Absorption 2019 & 2032
- Table 44: Global Mumbai Data Center Market Revenue Million Forecast, by Country 2019 & 2032
- Table 45: Turkey Mumbai Data Center Market Revenue (Million) Forecast, by Application 2019 & 2032
- Table 46: Israel Mumbai Data Center Market Revenue (Million) Forecast, by Application 2019 & 2032
- Table 47: GCC Mumbai Data Center Market Revenue (Million) Forecast, by Application 2019 & 2032
- Table 48: North Africa Mumbai Data Center Market Revenue (Million) Forecast, by Application 2019 & 2032
- Table 49: South Africa Mumbai Data Center Market Revenue (Million) Forecast, by Application 2019 & 2032
- Table 50: Rest of Middle East & Africa Mumbai Data Center Market Revenue (Million) Forecast, by Application 2019 & 2032
- Table 51: Global Mumbai Data Center Market Revenue Million Forecast, by DC Size 2019 & 2032
- Table 52: Global Mumbai Data Center Market Revenue Million Forecast, by Tier Type 2019 & 2032
- Table 53: Global Mumbai Data Center Market Revenue Million Forecast, by Absorption 2019 & 2032
- Table 54: Global Mumbai Data Center Market Revenue Million Forecast, by Country 2019 & 2032
- Table 55: China Mumbai Data Center Market Revenue (Million) Forecast, by Application 2019 & 2032
- Table 56: India Mumbai Data Center Market Revenue (Million) Forecast, by Application 2019 & 2032
- Table 57: Japan Mumbai Data Center Market Revenue (Million) Forecast, by Application 2019 & 2032
- Table 58: South Korea Mumbai Data Center Market Revenue (Million) Forecast, by Application 2019 & 2032
- Table 59: ASEAN Mumbai Data Center Market Revenue (Million) Forecast, by Application 2019 & 2032
- Table 60: Oceania Mumbai Data Center Market Revenue (Million) Forecast, by Application 2019 & 2032
- Table 61: Rest of Asia Pacific Mumbai Data Center Market Revenue (Million) Forecast, by Application 2019 & 2032
Frequently Asked Questions
1. What is the projected Compound Annual Growth Rate (CAGR) of the Mumbai Data Center Market?
The projected CAGR is approximately 13.44%.
2. Which companies are prominent players in the Mumbai Data Center Market?
Key companies in the market include Reliance Industries, Yotta Infrastructure Solutions Llp, Princeton Digital Group, Pi Data Center Pt Ltd, WEB Werks India Private Limited, ESDS Software Solution Limited, Equinix, Sify Technologies Limited, NTT Data, CtrlS, Nxtra Data Limited, STT Telemedia, Colt Technology Services7 2 Market Share Analysis (In terms of MW)7 3 List of Companie.
3. What are the main segments of the Mumbai Data Center Market?
The market segments include DC Size, Tier Type, Absorption.
4. Can you provide details about the market size?
The market size is estimated to be USD XX Million as of 2022.
5. What are some drivers contributing to market growth?
Reduction in Power Consumption With the Use of Silicon Photonics Based Transceivers; Growing Need for High-Speed Connectivity and High Data Transfer Capabilities Across Data Centers.
6. What are the notable trends driving market growth?
Smartphones To Drive the Market Growth.
7. Are there any restraints impacting market growth?
Risk of Thermal Effect.
8. Can you provide examples of recent developments in the market?
Jan 2023: The company announced that Web Werks will open a new data center in Mumbai, India. The building, known as the Mumbai-2 data center, will have a 120,000-square-foot (11,150 square meters) footprint and a 10 MW capacity. Mumbai-2 DC will give enterprise customers the densest interconnection ecosystem in APAC, with 200+ ISPs, all major carriers, internet exchanges, cloud service providers, and content delivery networks. Mumbai-2 DC will complement the current Mumbai-1 DC.
9. What pricing options are available for accessing the report?
Pricing options include single-user, multi-user, and enterprise licenses priced at USD 3800, USD 4500, and USD 5800 respectively.
10. Is the market size provided in terms of value or volume?
The market size is provided in terms of value, measured in Million.
11. Are there any specific market keywords associated with the report?
Yes, the market keyword associated with the report is "Mumbai Data Center Market," which aids in identifying and referencing the specific market segment covered.
12. How do I determine which pricing option suits my needs best?
The pricing options vary based on user requirements and access needs. Individual users may opt for single-user licenses, while businesses requiring broader access may choose multi-user or enterprise licenses for cost-effective access to the report.
13. Are there any additional resources or data provided in the Mumbai Data Center Market report?
While the report offers comprehensive insights, it's advisable to review the specific contents or supplementary materials provided to ascertain if additional resources or data are available.
14. How can I stay updated on further developments or reports in the Mumbai Data Center Market?
To stay informed about further developments, trends, and reports in the Mumbai Data Center Market, consider subscribing to industry newsletters, following relevant companies and organizations, or regularly checking reputable industry news sources and publications.
Methodology
Step 1 - Identification of Relevant Samples Size from Population Database


Step 2 - Approaches for Defining Global Market Size (Value, Volume* & Price*)

Note*: In applicable scenarios
Step 3 - Data Sources
Primary Research
- Web Analytics
- Survey Reports
- Research Institute
- Latest Research Reports
- Opinion Leaders
Secondary Research
- Annual Reports
- White Paper
- Latest Press Release
- Industry Association
- Paid Database
- Investor Presentations

Step 4 - Data Triangulation
Involves using different sources of information in order to increase the validity of a study
These sources are likely to be stakeholders in a program - participants, other researchers, program staff, other community members, and so on.
Then we put all data in single framework & apply various statistical tools to find out the dynamic on the market.
During the analysis stage, feedback from the stakeholder groups would be compared to determine areas of agreement as well as areas of divergence
