

Key Insights
The novel cancer diagnostic solutions market is experiencing robust growth, driven by the increasing prevalence of cancer globally, advancements in molecular diagnostics, and a rising demand for early and accurate diagnosis. The market is projected to expand significantly over the forecast period (2025-2033), fueled by continuous technological innovation leading to more sensitive and specific tests. This includes liquid biopsies, next-generation sequencing (NGS), and advanced imaging techniques offering minimally invasive procedures and improved diagnostic accuracy compared to traditional methods. The rising adoption of personalized medicine further contributes to market expansion, as tailored treatments necessitate precise diagnostic information for optimal patient outcomes. Key players like Philips Healthcare, Thermo Fisher Scientific, and Abbott Laboratories are at the forefront of this innovation, investing heavily in research and development to bring cutting-edge diagnostic solutions to the market. Competitive dynamics are shaped by mergers and acquisitions, strategic collaborations, and the continuous launch of novel diagnostic technologies.
Despite the promising outlook, the market faces certain challenges. High costs associated with advanced diagnostic technologies, regulatory hurdles for approval and reimbursement, and the need for skilled professionals to operate and interpret complex diagnostic data represent key restraints. However, ongoing technological advancements are expected to lead to cost reductions and improved accessibility over time. Furthermore, increased government funding for cancer research and public awareness campaigns are contributing to market growth by driving earlier detection and diagnosis. The segmentation of the market reflects the diversity of diagnostic approaches, with molecular diagnostics and imaging techniques leading the charge, followed by other emerging methodologies. Regional variations in market growth are expected, with developed economies such as North America and Europe exhibiting strong growth due to advanced healthcare infrastructure and higher adoption rates of innovative technologies, while developing regions are projected to witness significant growth in the coming years driven by increasing healthcare expenditure.
Novel Cancer Diagnostic Solutions Market Report: 2019-2033
This comprehensive report provides an in-depth analysis of the Novel Cancer Diagnostic Solutions market, encompassing market dynamics, growth trends, regional analysis, product landscape, key players, and future outlook. The report covers the period 2019-2033, with a focus on the forecast period 2025-2033 and a base year of 2025. The parent market is the broader In-Vitro Diagnostics Market and the child market is specifically Cancer Diagnostics. The total market size in 2025 is estimated at $XX billion.
Novel Cancer Diagnostic Solutions Market Dynamics & Structure
This section analyzes the competitive landscape, technological advancements, regulatory influences, and market trends within the Novel Cancer Diagnostic Solutions market. The market is characterized by a moderately concentrated structure, with key players holding significant market share. Technological innovation, particularly in areas like liquid biopsies and next-generation sequencing, is a major driver. Stringent regulatory frameworks, varying across regions, influence market entry and product approval. The market also faces competition from established diagnostic methods.
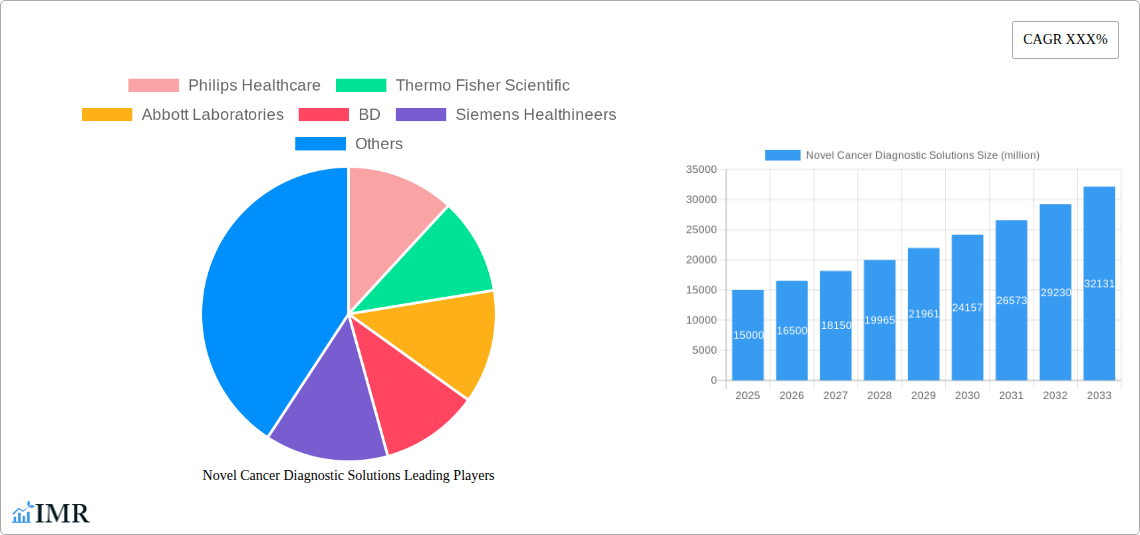
- Market Concentration: Highly concentrated, with the top 5 players holding approximately 60% market share in 2025.
- Technological Innovation: Rapid advancements in genomics, proteomics, and imaging technologies are driving market growth.
- Regulatory Frameworks: Varying regulations across different geographies pose challenges for market expansion.
- Competitive Substitutes: Traditional diagnostic methods remain prevalent, creating competitive pressure.
- End-User Demographics: Growth driven by an aging population and rising cancer incidence rates globally.
- M&A Trends: Consolidation is expected to continue, with an estimated XX M&A deals in the forecast period (2025-2033).
Novel Cancer Diagnostic Solutions Growth Trends & Insights
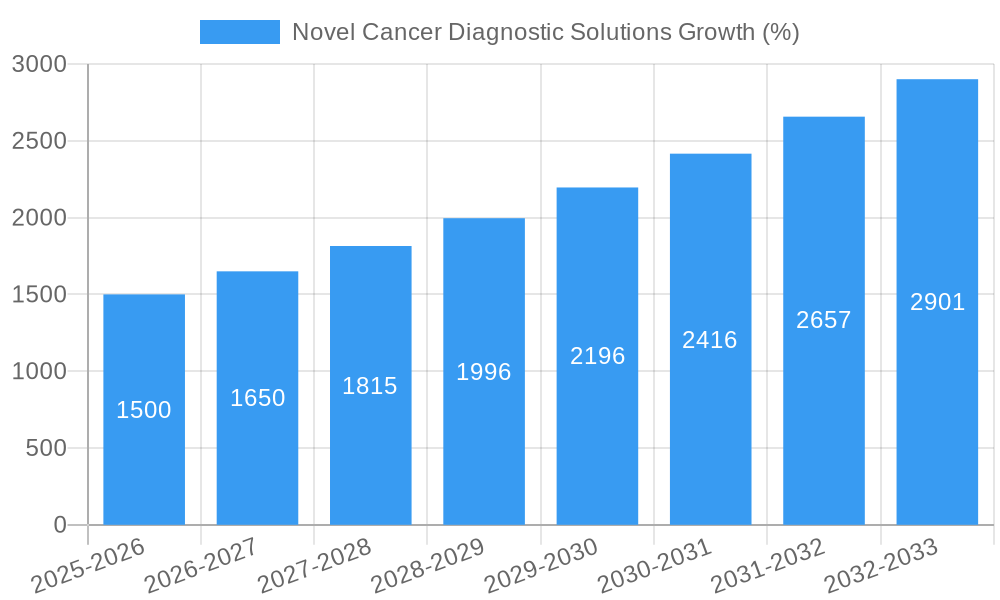
The Novel Cancer Diagnostic Solutions market exhibits robust growth, driven by technological advancements and increasing demand for early and accurate cancer detection. The market size is projected to reach $XX billion by 2033, exhibiting a CAGR of XX% during the forecast period. Increased adoption of advanced diagnostic techniques, fueled by rising healthcare expenditure and improved patient outcomes, is a key factor. Technological disruptions, such as the integration of AI and machine learning, are further accelerating market expansion. Consumer behavior shifts towards proactive healthcare and personalized medicine are also contributing to market growth. Market penetration of novel diagnostic solutions is expected to increase from XX% in 2025 to XX% by 2033.
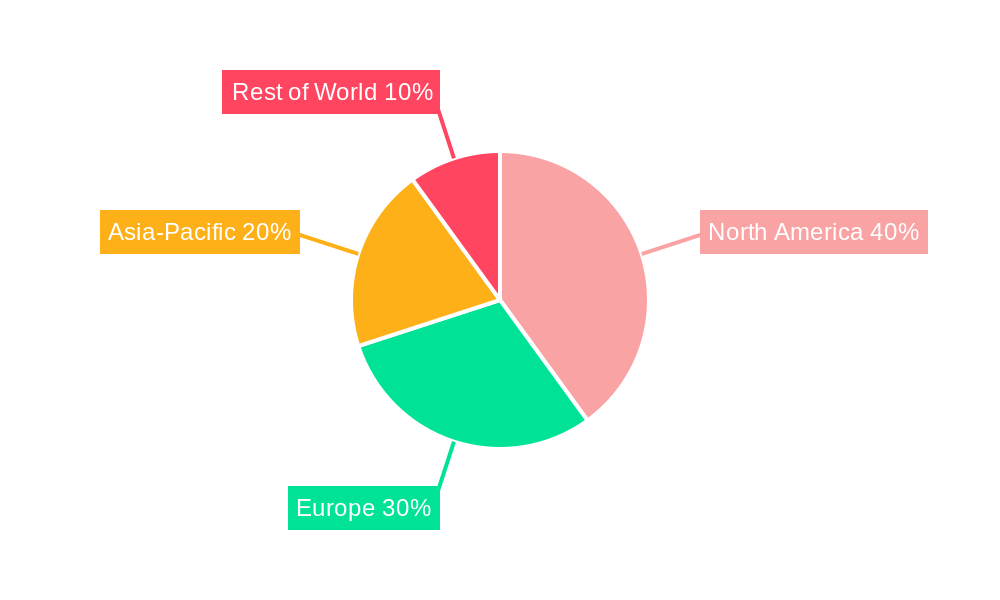
Dominant Regions, Countries, or Segments in Novel Cancer Diagnostic Solutions
North America currently holds the largest market share, driven by high healthcare expenditure, technological advancements, and strong regulatory support. However, Asia-Pacific is projected to experience the fastest growth rate during the forecast period, owing to rising cancer incidence rates, increasing healthcare infrastructure development, and growing awareness about early cancer detection.
- North America: High adoption rates of advanced technologies and substantial healthcare spending drive market dominance.
- Europe: Stringent regulations and a focus on precision oncology contribute to steady market growth.
- Asia-Pacific: Rapid growth fueled by rising cancer prevalence, increasing healthcare investments, and expanding healthcare infrastructure.
Novel Cancer Diagnostic Solutions Product Landscape
The market offers a diverse range of products, including liquid biopsies, next-generation sequencing (NGS) platforms, advanced imaging technologies, and molecular diagnostic assays. These technologies offer improved accuracy, sensitivity, and specificity in cancer detection and diagnosis, allowing for earlier intervention and personalized treatment strategies. Key innovations include minimally invasive procedures, faster turnaround times, and enhanced data analytics capabilities.
Key Drivers, Barriers & Challenges in Novel Cancer Diagnostic Solutions
Key Drivers:
- Technological advancements (e.g., liquid biopsies, AI-driven diagnostics)
- Rising cancer incidence and prevalence
- Increasing healthcare expenditure
- Growing demand for personalized medicine
Challenges and Restraints:
- High cost of advanced diagnostic technologies
- Stringent regulatory approvals
- Skilled personnel shortages
- Competition from existing diagnostic methods
- Supply chain disruptions potentially impacting availability of key components.
Emerging Opportunities in Novel Cancer Diagnostic Solutions
- Expansion into untapped markets in developing countries.
- Development of point-of-care diagnostic tools for improved accessibility.
- Integration of AI and big data analytics for enhanced diagnostic accuracy and personalized treatment plans.
- Focus on early detection and screening programs for improved patient outcomes.
Growth Accelerators in the Novel Cancer Diagnostic Solutions Industry
Technological breakthroughs, strategic partnerships between diagnostic companies and pharmaceutical firms, and market expansion into emerging economies are key catalysts for long-term growth in the Novel Cancer Diagnostic Solutions industry. Increased investment in research and development and the integration of advanced technologies are expected to further drive innovation and market expansion.
Key Players Shaping the Novel Cancer Diagnostic Solutions Market
- Philips Healthcare
- Thermo Fisher Scientific
- Abbott Laboratories
- BD
- Siemens Healthineers
- PHC Holdings
- Agilent
- Sakura Finetek
- Epredia
- bioMeriux
- MDx Health
- DiaSorin
Notable Milestones in Novel Cancer Diagnostic Solutions Sector
- 2021: FDA approval of a novel liquid biopsy test for early cancer detection.
- 2022: Launch of a new AI-powered diagnostic platform for improved cancer diagnosis accuracy.
- 2023: Strategic partnership between two major players to develop a next-generation sequencing platform for oncology applications.
- 2024: Acquisition of a smaller company specializing in novel cancer diagnostic solutions by a major player in the field.
In-Depth Novel Cancer Diagnostic Solutions Market Outlook
The Novel Cancer Diagnostic Solutions market is poised for significant growth in the coming years, driven by ongoing technological advancements, increasing awareness of cancer, and rising healthcare expenditure. Strategic partnerships, acquisitions, and the development of innovative diagnostic tools will further fuel market expansion. The market presents lucrative opportunities for companies to capitalize on the growing demand for accurate and timely cancer detection.
Novel Cancer Diagnostic Solutions Segmentation
-
1. Application
- 1.1. Hospital & Diagnostic Centers
- 1.2. Laboratories & Research Institutes
-
2. Type
- 2.1. Hardware
- 2.2. Software and Services
Novel Cancer Diagnostic Solutions Segmentation By Geography
-
1. North America
- 1.1. United States
- 1.2. Canada
- 1.3. Mexico
-
2. South America
- 2.1. Brazil
- 2.2. Argentina
- 2.3. Rest of South America
-
3. Europe
- 3.1. United Kingdom
- 3.2. Germany
- 3.3. France
- 3.4. Italy
- 3.5. Spain
- 3.6. Russia
- 3.7. Benelux
- 3.8. Nordics
- 3.9. Rest of Europe
-
4. Middle East & Africa
- 4.1. Turkey
- 4.2. Israel
- 4.3. GCC
- 4.4. North Africa
- 4.5. South Africa
- 4.6. Rest of Middle East & Africa
-
5. Asia Pacific
- 5.1. China
- 5.2. India
- 5.3. Japan
- 5.4. South Korea
- 5.5. ASEAN
- 5.6. Oceania
- 5.7. Rest of Asia Pacific
Novel Cancer Diagnostic Solutions REPORT HIGHLIGHTS
| Aspects | Details |
|---|---|
| Study Period | 2019-2033 |
| Base Year | 2024 |
| Estimated Year | 2025 |
| Forecast Period | 2025-2033 |
| Historical Period | 2019-2024 |
| Growth Rate | CAGR of XXX% from 2019-2033 |
| Segmentation |
|
Table of Contents
- 1. Introduction
- 1.1. Research Scope
- 1.2. Market Segmentation
- 1.3. Research Methodology
- 1.4. Definitions and Assumptions
- 2. Executive Summary
- 2.1. Introduction
- 3. Market Dynamics
- 3.1. Introduction
- 3.2. Market Drivers
- 3.3. Market Restrains
- 3.4. Market Trends
- 4. Market Factor Analysis
- 4.1. Porters Five Forces
- 4.2. Supply/Value Chain
- 4.3. PESTEL analysis
- 4.4. Market Entropy
- 4.5. Patent/Trademark Analysis
- 5. Global Novel Cancer Diagnostic Solutions Analysis, Insights and Forecast, 2019-2031
- 5.1. Market Analysis, Insights and Forecast - by Application
- 5.1.1. Hospital & Diagnostic Centers
- 5.1.2. Laboratories & Research Institutes
- 5.2. Market Analysis, Insights and Forecast - by Type
- 5.2.1. Hardware
- 5.2.2. Software and Services
- 5.3. Market Analysis, Insights and Forecast - by Region
- 5.3.1. North America
- 5.3.2. South America
- 5.3.3. Europe
- 5.3.4. Middle East & Africa
- 5.3.5. Asia Pacific
- 5.1. Market Analysis, Insights and Forecast - by Application
- 6. North America Novel Cancer Diagnostic Solutions Analysis, Insights and Forecast, 2019-2031
- 6.1. Market Analysis, Insights and Forecast - by Application
- 6.1.1. Hospital & Diagnostic Centers
- 6.1.2. Laboratories & Research Institutes
- 6.2. Market Analysis, Insights and Forecast - by Type
- 6.2.1. Hardware
- 6.2.2. Software and Services
- 6.1. Market Analysis, Insights and Forecast - by Application
- 7. South America Novel Cancer Diagnostic Solutions Analysis, Insights and Forecast, 2019-2031
- 7.1. Market Analysis, Insights and Forecast - by Application
- 7.1.1. Hospital & Diagnostic Centers
- 7.1.2. Laboratories & Research Institutes
- 7.2. Market Analysis, Insights and Forecast - by Type
- 7.2.1. Hardware
- 7.2.2. Software and Services
- 7.1. Market Analysis, Insights and Forecast - by Application
- 8. Europe Novel Cancer Diagnostic Solutions Analysis, Insights and Forecast, 2019-2031
- 8.1. Market Analysis, Insights and Forecast - by Application
- 8.1.1. Hospital & Diagnostic Centers
- 8.1.2. Laboratories & Research Institutes
- 8.2. Market Analysis, Insights and Forecast - by Type
- 8.2.1. Hardware
- 8.2.2. Software and Services
- 8.1. Market Analysis, Insights and Forecast - by Application
- 9. Middle East & Africa Novel Cancer Diagnostic Solutions Analysis, Insights and Forecast, 2019-2031
- 9.1. Market Analysis, Insights and Forecast - by Application
- 9.1.1. Hospital & Diagnostic Centers
- 9.1.2. Laboratories & Research Institutes
- 9.2. Market Analysis, Insights and Forecast - by Type
- 9.2.1. Hardware
- 9.2.2. Software and Services
- 9.1. Market Analysis, Insights and Forecast - by Application
- 10. Asia Pacific Novel Cancer Diagnostic Solutions Analysis, Insights and Forecast, 2019-2031
- 10.1. Market Analysis, Insights and Forecast - by Application
- 10.1.1. Hospital & Diagnostic Centers
- 10.1.2. Laboratories & Research Institutes
- 10.2. Market Analysis, Insights and Forecast - by Type
- 10.2.1. Hardware
- 10.2.2. Software and Services
- 10.1. Market Analysis, Insights and Forecast - by Application
- 11. Competitive Analysis
- 11.1. Global Market Share Analysis 2024
- 11.2. Company Profiles
- 11.2.1 Philips Healthcare
- 11.2.1.1. Overview
- 11.2.1.2. Products
- 11.2.1.3. SWOT Analysis
- 11.2.1.4. Recent Developments
- 11.2.1.5. Financials (Based on Availability)
- 11.2.2 Thermo Fisher Scientific
- 11.2.2.1. Overview
- 11.2.2.2. Products
- 11.2.2.3. SWOT Analysis
- 11.2.2.4. Recent Developments
- 11.2.2.5. Financials (Based on Availability)
- 11.2.3 Abbott Laboratories
- 11.2.3.1. Overview
- 11.2.3.2. Products
- 11.2.3.3. SWOT Analysis
- 11.2.3.4. Recent Developments
- 11.2.3.5. Financials (Based on Availability)
- 11.2.4 BD
- 11.2.4.1. Overview
- 11.2.4.2. Products
- 11.2.4.3. SWOT Analysis
- 11.2.4.4. Recent Developments
- 11.2.4.5. Financials (Based on Availability)
- 11.2.5 Siemens Healthineers
- 11.2.5.1. Overview
- 11.2.5.2. Products
- 11.2.5.3. SWOT Analysis
- 11.2.5.4. Recent Developments
- 11.2.5.5. Financials (Based on Availability)
- 11.2.6 PHC Holdings
- 11.2.6.1. Overview
- 11.2.6.2. Products
- 11.2.6.3. SWOT Analysis
- 11.2.6.4. Recent Developments
- 11.2.6.5. Financials (Based on Availability)
- 11.2.7 Agilent
- 11.2.7.1. Overview
- 11.2.7.2. Products
- 11.2.7.3. SWOT Analysis
- 11.2.7.4. Recent Developments
- 11.2.7.5. Financials (Based on Availability)
- 11.2.8 Sakura Finetek
- 11.2.8.1. Overview
- 11.2.8.2. Products
- 11.2.8.3. SWOT Analysis
- 11.2.8.4. Recent Developments
- 11.2.8.5. Financials (Based on Availability)
- 11.2.9 Epredia
- 11.2.9.1. Overview
- 11.2.9.2. Products
- 11.2.9.3. SWOT Analysis
- 11.2.9.4. Recent Developments
- 11.2.9.5. Financials (Based on Availability)
- 11.2.10 bioMeriux
- 11.2.10.1. Overview
- 11.2.10.2. Products
- 11.2.10.3. SWOT Analysis
- 11.2.10.4. Recent Developments
- 11.2.10.5. Financials (Based on Availability)
- 11.2.11 MDx Health
- 11.2.11.1. Overview
- 11.2.11.2. Products
- 11.2.11.3. SWOT Analysis
- 11.2.11.4. Recent Developments
- 11.2.11.5. Financials (Based on Availability)
- 11.2.12 DiaSorin
- 11.2.12.1. Overview
- 11.2.12.2. Products
- 11.2.12.3. SWOT Analysis
- 11.2.12.4. Recent Developments
- 11.2.12.5. Financials (Based on Availability)
- 11.2.1 Philips Healthcare
List of Figures
- Figure 1: Global Novel Cancer Diagnostic Solutions Revenue Breakdown (million, %) by Region 2024 & 2032
- Figure 2: North America Novel Cancer Diagnostic Solutions Revenue (million), by Application 2024 & 2032
- Figure 3: North America Novel Cancer Diagnostic Solutions Revenue Share (%), by Application 2024 & 2032
- Figure 4: North America Novel Cancer Diagnostic Solutions Revenue (million), by Type 2024 & 2032
- Figure 5: North America Novel Cancer Diagnostic Solutions Revenue Share (%), by Type 2024 & 2032
- Figure 6: North America Novel Cancer Diagnostic Solutions Revenue (million), by Country 2024 & 2032
- Figure 7: North America Novel Cancer Diagnostic Solutions Revenue Share (%), by Country 2024 & 2032
- Figure 8: South America Novel Cancer Diagnostic Solutions Revenue (million), by Application 2024 & 2032
- Figure 9: South America Novel Cancer Diagnostic Solutions Revenue Share (%), by Application 2024 & 2032
- Figure 10: South America Novel Cancer Diagnostic Solutions Revenue (million), by Type 2024 & 2032
- Figure 11: South America Novel Cancer Diagnostic Solutions Revenue Share (%), by Type 2024 & 2032
- Figure 12: South America Novel Cancer Diagnostic Solutions Revenue (million), by Country 2024 & 2032
- Figure 13: South America Novel Cancer Diagnostic Solutions Revenue Share (%), by Country 2024 & 2032
- Figure 14: Europe Novel Cancer Diagnostic Solutions Revenue (million), by Application 2024 & 2032
- Figure 15: Europe Novel Cancer Diagnostic Solutions Revenue Share (%), by Application 2024 & 2032
- Figure 16: Europe Novel Cancer Diagnostic Solutions Revenue (million), by Type 2024 & 2032
- Figure 17: Europe Novel Cancer Diagnostic Solutions Revenue Share (%), by Type 2024 & 2032
- Figure 18: Europe Novel Cancer Diagnostic Solutions Revenue (million), by Country 2024 & 2032
- Figure 19: Europe Novel Cancer Diagnostic Solutions Revenue Share (%), by Country 2024 & 2032
- Figure 20: Middle East & Africa Novel Cancer Diagnostic Solutions Revenue (million), by Application 2024 & 2032
- Figure 21: Middle East & Africa Novel Cancer Diagnostic Solutions Revenue Share (%), by Application 2024 & 2032
- Figure 22: Middle East & Africa Novel Cancer Diagnostic Solutions Revenue (million), by Type 2024 & 2032
- Figure 23: Middle East & Africa Novel Cancer Diagnostic Solutions Revenue Share (%), by Type 2024 & 2032
- Figure 24: Middle East & Africa Novel Cancer Diagnostic Solutions Revenue (million), by Country 2024 & 2032
- Figure 25: Middle East & Africa Novel Cancer Diagnostic Solutions Revenue Share (%), by Country 2024 & 2032
- Figure 26: Asia Pacific Novel Cancer Diagnostic Solutions Revenue (million), by Application 2024 & 2032
- Figure 27: Asia Pacific Novel Cancer Diagnostic Solutions Revenue Share (%), by Application 2024 & 2032
- Figure 28: Asia Pacific Novel Cancer Diagnostic Solutions Revenue (million), by Type 2024 & 2032
- Figure 29: Asia Pacific Novel Cancer Diagnostic Solutions Revenue Share (%), by Type 2024 & 2032
- Figure 30: Asia Pacific Novel Cancer Diagnostic Solutions Revenue (million), by Country 2024 & 2032
- Figure 31: Asia Pacific Novel Cancer Diagnostic Solutions Revenue Share (%), by Country 2024 & 2032
List of Tables
- Table 1: Global Novel Cancer Diagnostic Solutions Revenue million Forecast, by Region 2019 & 2032
- Table 2: Global Novel Cancer Diagnostic Solutions Revenue million Forecast, by Application 2019 & 2032
- Table 3: Global Novel Cancer Diagnostic Solutions Revenue million Forecast, by Type 2019 & 2032
- Table 4: Global Novel Cancer Diagnostic Solutions Revenue million Forecast, by Region 2019 & 2032
- Table 5: Global Novel Cancer Diagnostic Solutions Revenue million Forecast, by Application 2019 & 2032
- Table 6: Global Novel Cancer Diagnostic Solutions Revenue million Forecast, by Type 2019 & 2032
- Table 7: Global Novel Cancer Diagnostic Solutions Revenue million Forecast, by Country 2019 & 2032
- Table 8: United States Novel Cancer Diagnostic Solutions Revenue (million) Forecast, by Application 2019 & 2032
- Table 9: Canada Novel Cancer Diagnostic Solutions Revenue (million) Forecast, by Application 2019 & 2032
- Table 10: Mexico Novel Cancer Diagnostic Solutions Revenue (million) Forecast, by Application 2019 & 2032
- Table 11: Global Novel Cancer Diagnostic Solutions Revenue million Forecast, by Application 2019 & 2032
- Table 12: Global Novel Cancer Diagnostic Solutions Revenue million Forecast, by Type 2019 & 2032
- Table 13: Global Novel Cancer Diagnostic Solutions Revenue million Forecast, by Country 2019 & 2032
- Table 14: Brazil Novel Cancer Diagnostic Solutions Revenue (million) Forecast, by Application 2019 & 2032
- Table 15: Argentina Novel Cancer Diagnostic Solutions Revenue (million) Forecast, by Application 2019 & 2032
- Table 16: Rest of South America Novel Cancer Diagnostic Solutions Revenue (million) Forecast, by Application 2019 & 2032
- Table 17: Global Novel Cancer Diagnostic Solutions Revenue million Forecast, by Application 2019 & 2032
- Table 18: Global Novel Cancer Diagnostic Solutions Revenue million Forecast, by Type 2019 & 2032
- Table 19: Global Novel Cancer Diagnostic Solutions Revenue million Forecast, by Country 2019 & 2032
- Table 20: United Kingdom Novel Cancer Diagnostic Solutions Revenue (million) Forecast, by Application 2019 & 2032
- Table 21: Germany Novel Cancer Diagnostic Solutions Revenue (million) Forecast, by Application 2019 & 2032
- Table 22: France Novel Cancer Diagnostic Solutions Revenue (million) Forecast, by Application 2019 & 2032
- Table 23: Italy Novel Cancer Diagnostic Solutions Revenue (million) Forecast, by Application 2019 & 2032
- Table 24: Spain Novel Cancer Diagnostic Solutions Revenue (million) Forecast, by Application 2019 & 2032
- Table 25: Russia Novel Cancer Diagnostic Solutions Revenue (million) Forecast, by Application 2019 & 2032
- Table 26: Benelux Novel Cancer Diagnostic Solutions Revenue (million) Forecast, by Application 2019 & 2032
- Table 27: Nordics Novel Cancer Diagnostic Solutions Revenue (million) Forecast, by Application 2019 & 2032
- Table 28: Rest of Europe Novel Cancer Diagnostic Solutions Revenue (million) Forecast, by Application 2019 & 2032
- Table 29: Global Novel Cancer Diagnostic Solutions Revenue million Forecast, by Application 2019 & 2032
- Table 30: Global Novel Cancer Diagnostic Solutions Revenue million Forecast, by Type 2019 & 2032
- Table 31: Global Novel Cancer Diagnostic Solutions Revenue million Forecast, by Country 2019 & 2032
- Table 32: Turkey Novel Cancer Diagnostic Solutions Revenue (million) Forecast, by Application 2019 & 2032
- Table 33: Israel Novel Cancer Diagnostic Solutions Revenue (million) Forecast, by Application 2019 & 2032
- Table 34: GCC Novel Cancer Diagnostic Solutions Revenue (million) Forecast, by Application 2019 & 2032
- Table 35: North Africa Novel Cancer Diagnostic Solutions Revenue (million) Forecast, by Application 2019 & 2032
- Table 36: South Africa Novel Cancer Diagnostic Solutions Revenue (million) Forecast, by Application 2019 & 2032
- Table 37: Rest of Middle East & Africa Novel Cancer Diagnostic Solutions Revenue (million) Forecast, by Application 2019 & 2032
- Table 38: Global Novel Cancer Diagnostic Solutions Revenue million Forecast, by Application 2019 & 2032
- Table 39: Global Novel Cancer Diagnostic Solutions Revenue million Forecast, by Type 2019 & 2032
- Table 40: Global Novel Cancer Diagnostic Solutions Revenue million Forecast, by Country 2019 & 2032
- Table 41: China Novel Cancer Diagnostic Solutions Revenue (million) Forecast, by Application 2019 & 2032
- Table 42: India Novel Cancer Diagnostic Solutions Revenue (million) Forecast, by Application 2019 & 2032
- Table 43: Japan Novel Cancer Diagnostic Solutions Revenue (million) Forecast, by Application 2019 & 2032
- Table 44: South Korea Novel Cancer Diagnostic Solutions Revenue (million) Forecast, by Application 2019 & 2032
- Table 45: ASEAN Novel Cancer Diagnostic Solutions Revenue (million) Forecast, by Application 2019 & 2032
- Table 46: Oceania Novel Cancer Diagnostic Solutions Revenue (million) Forecast, by Application 2019 & 2032
- Table 47: Rest of Asia Pacific Novel Cancer Diagnostic Solutions Revenue (million) Forecast, by Application 2019 & 2032
Frequently Asked Questions
1. What is the projected Compound Annual Growth Rate (CAGR) of the Novel Cancer Diagnostic Solutions?
The projected CAGR is approximately XXX%.
2. Which companies are prominent players in the Novel Cancer Diagnostic Solutions?
Key companies in the market include Philips Healthcare, Thermo Fisher Scientific, Abbott Laboratories, BD, Siemens Healthineers, PHC Holdings, Agilent, Sakura Finetek, Epredia, bioMeriux, MDx Health, DiaSorin.
3. What are the main segments of the Novel Cancer Diagnostic Solutions?
The market segments include Application, Type.
4. Can you provide details about the market size?
The market size is estimated to be USD XXX million as of 2022.
5. What are some drivers contributing to market growth?
N/A
6. What are the notable trends driving market growth?
N/A
7. Are there any restraints impacting market growth?
N/A
8. Can you provide examples of recent developments in the market?
N/A
9. What pricing options are available for accessing the report?
Pricing options include single-user, multi-user, and enterprise licenses priced at USD 2900.00, USD 4350.00, and USD 5800.00 respectively.
10. Is the market size provided in terms of value or volume?
The market size is provided in terms of value, measured in million.
11. Are there any specific market keywords associated with the report?
Yes, the market keyword associated with the report is "Novel Cancer Diagnostic Solutions," which aids in identifying and referencing the specific market segment covered.
12. How do I determine which pricing option suits my needs best?
The pricing options vary based on user requirements and access needs. Individual users may opt for single-user licenses, while businesses requiring broader access may choose multi-user or enterprise licenses for cost-effective access to the report.
13. Are there any additional resources or data provided in the Novel Cancer Diagnostic Solutions report?
While the report offers comprehensive insights, it's advisable to review the specific contents or supplementary materials provided to ascertain if additional resources or data are available.
14. How can I stay updated on further developments or reports in the Novel Cancer Diagnostic Solutions?
To stay informed about further developments, trends, and reports in the Novel Cancer Diagnostic Solutions, consider subscribing to industry newsletters, following relevant companies and organizations, or regularly checking reputable industry news sources and publications.
Methodology
Step 1 - Identification of Relevant Samples Size from Population Database


Step 2 - Approaches for Defining Global Market Size (Value, Volume* & Price*)

Note*: In applicable scenarios
Step 3 - Data Sources
Primary Research
- Web Analytics
- Survey Reports
- Research Institute
- Latest Research Reports
- Opinion Leaders
Secondary Research
- Annual Reports
- White Paper
- Latest Press Release
- Industry Association
- Paid Database
- Investor Presentations

Step 4 - Data Triangulation
Involves using different sources of information in order to increase the validity of a study
These sources are likely to be stakeholders in a program - participants, other researchers, program staff, other community members, and so on.
Then we put all data in single framework & apply various statistical tools to find out the dynamic on the market.
During the analysis stage, feedback from the stakeholder groups would be compared to determine areas of agreement as well as areas of divergence
