

Key Insights
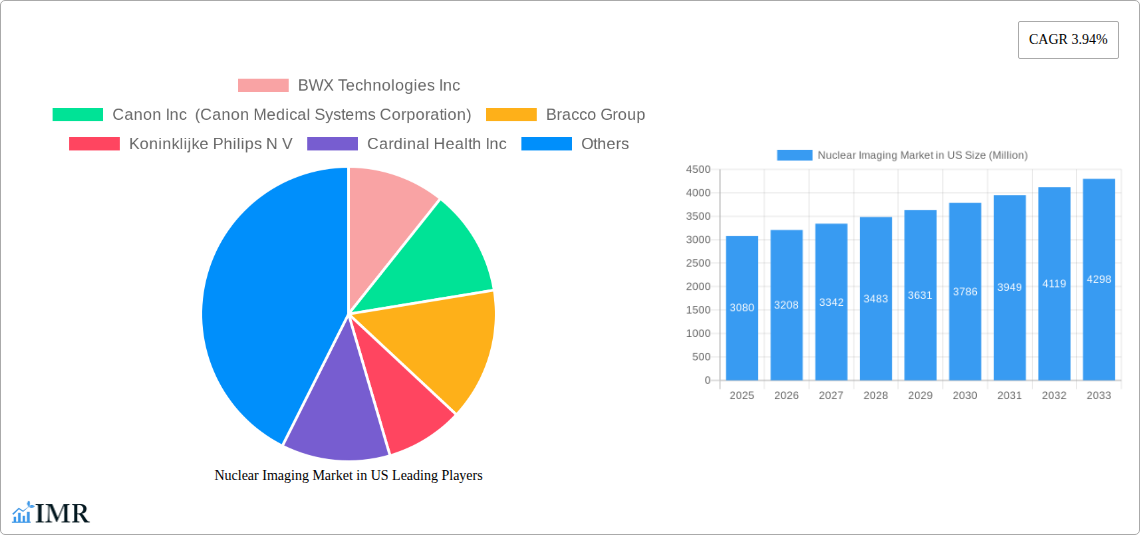
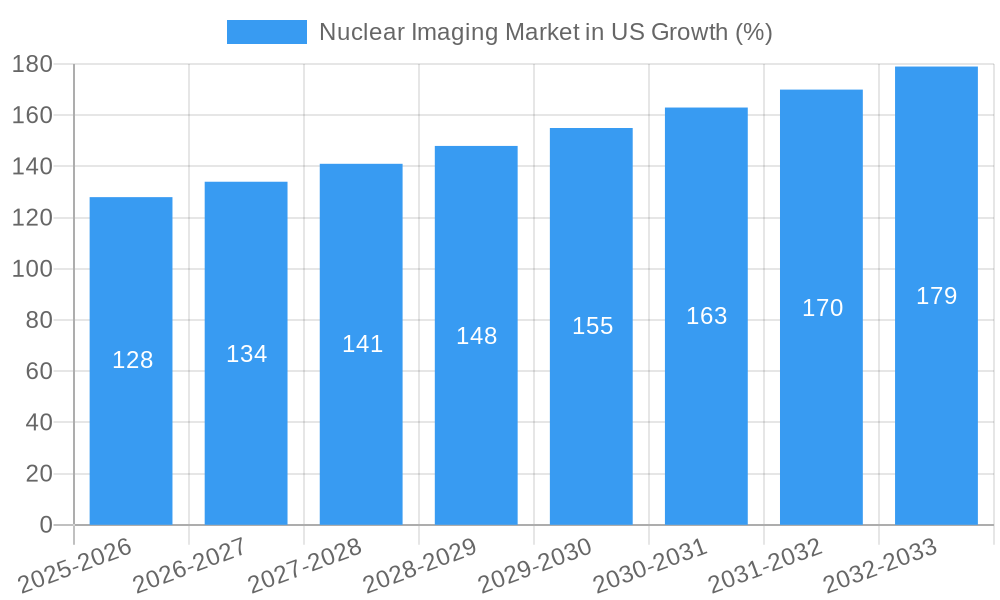
The US nuclear imaging market, valued at approximately $3.08 billion in 2025, is projected to experience robust growth, exhibiting a Compound Annual Growth Rate (CAGR) of 3.94% from 2025 to 2033. This expansion is fueled by several key drivers. The rising prevalence of chronic diseases like cancer, cardiovascular diseases, and neurological disorders necessitates increased diagnostic capabilities, significantly boosting demand for nuclear imaging techniques such as SPECT and PET scans. Technological advancements, including the development of higher-resolution imaging systems and improved radiopharmaceuticals, are enhancing diagnostic accuracy and patient outcomes, further propelling market growth. Furthermore, increasing government initiatives focused on improving healthcare infrastructure and expanding access to advanced diagnostic technologies in both urban and rural settings contribute to market expansion. The market is segmented into equipment (cameras, generators, etc.), diagnostic radioisotopes, and applications (SPECT and PET). Leading players like GE Healthcare, Siemens Healthineers, and Philips are driving innovation and competition, constantly introducing advanced products and services.
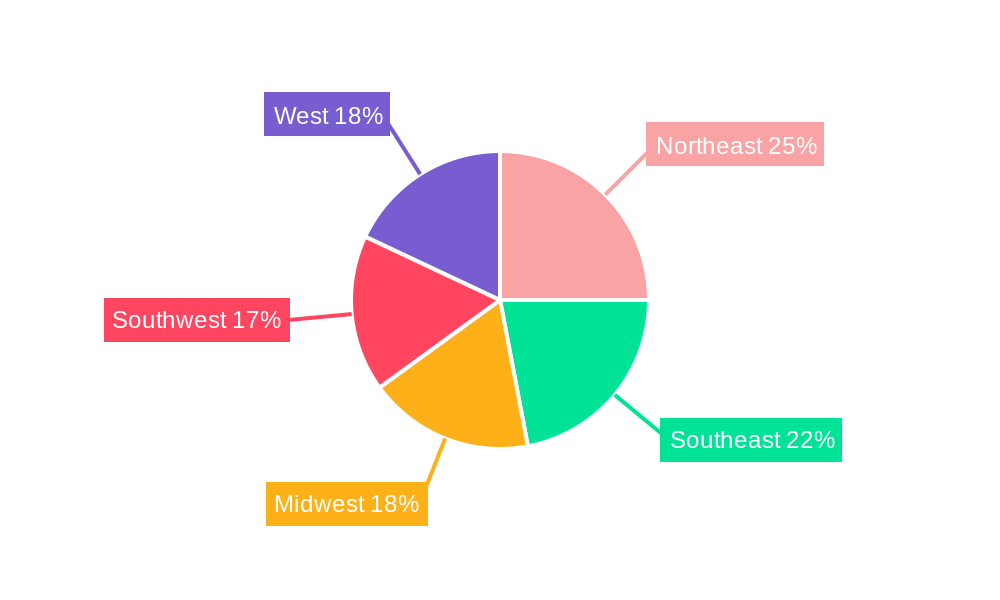
However, the market faces certain challenges. The high cost associated with nuclear imaging procedures, including equipment acquisition, radioisotope production, and skilled personnel, presents a significant barrier to wider accessibility, particularly in under-resourced areas. Stringent regulatory frameworks surrounding the handling and disposal of radioactive materials also pose operational complexities and increase costs. Despite these restraints, the long-term outlook remains positive, with the growing geriatric population and the increasing adoption of nuclear imaging in oncology and cardiology expected to offset these challenges and sustain the market's upward trajectory. Regional analysis within the US reveals significant variations in market penetration across Northeast, Southeast, Midwest, Southwest, and West regions, influenced by factors like healthcare infrastructure, population density, and prevalence of target diseases.
Nuclear Imaging Market in US: A Comprehensive Market Report (2019-2033)
This in-depth report provides a comprehensive analysis of the Nuclear Imaging Market in the US, encompassing market dynamics, growth trends, regional dominance, product landscape, key players, and future outlook. The study period covers 2019-2033, with a base year of 2025 and a forecast period of 2025-2033. The report segments the market by Product (Equipment, Diagnostic Radioisotope) and Application (SPECT Application, PET Application), offering granular insights into this vital sector of the US healthcare landscape. Market values are presented in million USD.
Nuclear Imaging Market in US Market Dynamics & Structure
The US nuclear imaging market is characterized by a moderately concentrated landscape with a few major players holding significant market share. Technological innovation, particularly in AI-driven image analysis and radiotracer development, is a key driver. Stringent regulatory frameworks from the FDA influence product approvals and market entry. Competition from alternative imaging modalities, such as MRI and CT scans, presents a challenge. The market is driven by an aging population with increasing prevalence of chronic diseases necessitating advanced diagnostics. M&A activity has been moderate, with a projected xx number of deals in the past five years, driven primarily by consolidation efforts and the pursuit of technological advancements.
- Market Concentration: The top 5 players hold approximately xx% of the market share in 2024.
- Technological Innovation: Focus on AI-integrated systems, improved radiotracer specificity, and miniaturized equipment.
- Regulatory Landscape: FDA approvals are critical for market access, impacting timelines and investment decisions.
- Competitive Substitutes: MRI and CT scans present alternative diagnostic options, influencing market growth.
- End-User Demographics: The aging population and rise in chronic diseases fuel demand for nuclear imaging services.
- M&A Trends: Consolidation amongst manufacturers and radiopharmaceutical companies remains moderate.
Nuclear Imaging Market in US Growth Trends & Insights
The US nuclear imaging market experienced a CAGR of xx% during the historical period (2019-2024), reaching a market size of xx million in 2024. This growth is projected to continue at a CAGR of xx% during the forecast period (2025-2033), driven by technological advancements, increasing adoption rates, and rising healthcare expenditure. Market penetration is currently at xx%, with significant potential for growth in underserved areas. Technological disruptions, such as the integration of AI and machine learning, are enhancing diagnostic accuracy and efficiency, further boosting market expansion. Shifting consumer preferences towards minimally invasive diagnostic techniques and personalized medicine are also positively influencing market growth. The increasing demand for advanced molecular imaging techniques and the development of novel radiopharmaceuticals contribute to the positive growth trajectory.
Dominant Regions, Countries, or Segments in Nuclear Imaging Market in US
The Northeast and West Coast regions of the US currently dominate the nuclear imaging market, accounting for approximately xx% of the total market value. This dominance is attributable to a higher concentration of specialized healthcare facilities, research institutions, and a higher prevalence of chronic diseases requiring advanced diagnostic techniques. Within the product segment, Equipment commands the largest share, followed by Diagnostic Radioisotope. The PET Application segment exhibits higher growth potential compared to SPECT due to its superior imaging capabilities.
- Key Drivers (Northeast & West Coast):
- High concentration of specialized healthcare facilities.
- Presence of leading research institutions.
- Higher prevalence of chronic diseases.
- Robust healthcare infrastructure and higher per capita healthcare expenditure.
- Growth Potential (PET Application):
- Superior imaging resolution and functional information compared to SPECT.
- Growing demand for early disease detection and treatment monitoring.
Nuclear Imaging Market in US Product Landscape
The market offers a diverse range of equipment, including SPECT and PET scanners, with ongoing innovation in areas like detector technology and image processing algorithms. Diagnostic radioisotopes are crucial, with ongoing efforts to develop radiotracers with improved specificity and targeting capabilities. Key performance metrics include image resolution, sensitivity, and specificity. Unique selling propositions focus on speed, image quality, and ease of use, while technological advancements are aimed at improving patient comfort, reducing radiation exposure, and enhancing diagnostic accuracy.
Key Drivers, Barriers & Challenges in Nuclear Imaging Market in US
Key Drivers:
- Increasing prevalence of chronic diseases (cancer, cardiovascular diseases).
- Technological advancements leading to improved image quality and diagnostic accuracy.
- Growing demand for minimally invasive diagnostic procedures.
- Increased healthcare spending and insurance coverage.
Key Challenges:
- High cost of equipment and radioisotopes limiting accessibility.
- Stringent regulatory approvals increasing time to market.
- Potential risks associated with radiation exposure.
- Competition from alternative imaging modalities.
- Supply chain vulnerabilities impacting the availability of radioisotopes.
Emerging Opportunities in Nuclear Imaging Market in US
- Growing adoption of theranostics (combining diagnostics and therapeutics).
- Development of novel radiopharmaceuticals with improved targeting capabilities.
- Expansion into underserved markets through mobile imaging units.
- Increased utilization of AI and machine learning for image analysis.
- Growing demand for personalized medicine approaches.
Growth Accelerators in the Nuclear Imaging Market in US Industry
Technological breakthroughs in radioisotope production, detector technology, and AI-driven image analysis are accelerating market growth. Strategic partnerships between equipment manufacturers and radiopharmaceutical companies are also driving innovation and market expansion. Furthermore, the expansion of nuclear medicine services into underserved areas and the increasing focus on preventative healthcare are creating significant growth opportunities.
Key Players Shaping the Nuclear Imaging Market in US Market
- BWX Technologies Inc
- Canon Inc (Canon Medical Systems Corporation)
- Bracco Group
- Koninklijke Philips N V
- Cardinal Health Inc
- Siemens Healthineers AG
- Novartis AG (Advanced Accelerator Applications)
- GE Healthcare
- Curium
- Fujifilm Holdings Corporation
Notable Milestones in Nuclear Imaging Market in US Sector
- June 2022: The Mars Shot Fund established by SNMMI to generate USD 100 million for nuclear medicine research.
- March 2022: Canon Medical Systems USA Inc. launches the "Canon Across America" mobile tour showcasing advanced AI medical gadgets.
In-Depth Nuclear Imaging Market in US Market Outlook
The US nuclear imaging market is poised for continued growth, driven by ongoing technological advancements, an aging population, and the increasing prevalence of chronic diseases. Strategic opportunities exist in the development and commercialization of novel radiopharmaceuticals, AI-powered image analysis tools, and mobile imaging units. Expanding access to nuclear imaging services in underserved areas and fostering collaborations between research institutions and healthcare providers will further accelerate market expansion and enhance patient care.
Nuclear Imaging Market in US Segmentation
-
1. Product
- 1.1. Equipment
-
1.2. Diagnostic Radioisotope
- 1.2.1. SPECT Radioisotopes
- 1.2.2. PET Radioisotopes
-
2. Application
-
2.1. SPECT Application
- 2.1.1. Cardiology
- 2.1.2. Neurology
- 2.1.3. Thyroid
- 2.1.4. Other SPECT Applications
-
2.2. PET Application
- 2.2.1. Oncology
- 2.2.2. Other PET Applications
-
2.1. SPECT Application
Nuclear Imaging Market in US Segmentation By Geography
-
1. North America
- 1.1. United States
- 1.2. Canada
- 1.3. Mexico
-
2. South America
- 2.1. Brazil
- 2.2. Argentina
- 2.3. Rest of South America
-
3. Europe
- 3.1. United Kingdom
- 3.2. Germany
- 3.3. France
- 3.4. Italy
- 3.5. Spain
- 3.6. Russia
- 3.7. Benelux
- 3.8. Nordics
- 3.9. Rest of Europe
-
4. Middle East & Africa
- 4.1. Turkey
- 4.2. Israel
- 4.3. GCC
- 4.4. North Africa
- 4.5. South Africa
- 4.6. Rest of Middle East & Africa
-
5. Asia Pacific
- 5.1. China
- 5.2. India
- 5.3. Japan
- 5.4. South Korea
- 5.5. ASEAN
- 5.6. Oceania
- 5.7. Rest of Asia Pacific
Nuclear Imaging Market in US REPORT HIGHLIGHTS
| Aspects | Details |
|---|---|
| Study Period | 2019-2033 |
| Base Year | 2024 |
| Estimated Year | 2025 |
| Forecast Period | 2025-2033 |
| Historical Period | 2019-2024 |
| Growth Rate | CAGR of 3.94% from 2019-2033 |
| Segmentation |
|
Table of Contents
- 1. Introduction
- 1.1. Research Scope
- 1.2. Market Segmentation
- 1.3. Research Methodology
- 1.4. Definitions and Assumptions
- 2. Executive Summary
- 2.1. Introduction
- 3. Market Dynamics
- 3.1. Introduction
- 3.2. Market Drivers
- 3.2.1. Increasing Prevalence of Chronic Diseases; Rising Geriatric Population; Increasing Technological Advancements
- 3.3. Market Restrains
- 3.3.1. Lack Of Proper Reimbursement And Stringent Regulatory Approval Procedures; High Cost of Equipment
- 3.4. Market Trends
- 3.4.1. Equipment Segment is Expected to Hold a Significant Market Share Over the Forecast Period
- 4. Market Factor Analysis
- 4.1. Porters Five Forces
- 4.2. Supply/Value Chain
- 4.3. PESTEL analysis
- 4.4. Market Entropy
- 4.5. Patent/Trademark Analysis
- 5. Global Nuclear Imaging Market in US Analysis, Insights and Forecast, 2019-2031
- 5.1. Market Analysis, Insights and Forecast - by Product
- 5.1.1. Equipment
- 5.1.2. Diagnostic Radioisotope
- 5.1.2.1. SPECT Radioisotopes
- 5.1.2.2. PET Radioisotopes
- 5.2. Market Analysis, Insights and Forecast - by Application
- 5.2.1. SPECT Application
- 5.2.1.1. Cardiology
- 5.2.1.2. Neurology
- 5.2.1.3. Thyroid
- 5.2.1.4. Other SPECT Applications
- 5.2.2. PET Application
- 5.2.2.1. Oncology
- 5.2.2.2. Other PET Applications
- 5.2.1. SPECT Application
- 5.3. Market Analysis, Insights and Forecast - by Region
- 5.3.1. North America
- 5.3.2. South America
- 5.3.3. Europe
- 5.3.4. Middle East & Africa
- 5.3.5. Asia Pacific
- 5.1. Market Analysis, Insights and Forecast - by Product
- 6. North America Nuclear Imaging Market in US Analysis, Insights and Forecast, 2019-2031
- 6.1. Market Analysis, Insights and Forecast - by Product
- 6.1.1. Equipment
- 6.1.2. Diagnostic Radioisotope
- 6.1.2.1. SPECT Radioisotopes
- 6.1.2.2. PET Radioisotopes
- 6.2. Market Analysis, Insights and Forecast - by Application
- 6.2.1. SPECT Application
- 6.2.1.1. Cardiology
- 6.2.1.2. Neurology
- 6.2.1.3. Thyroid
- 6.2.1.4. Other SPECT Applications
- 6.2.2. PET Application
- 6.2.2.1. Oncology
- 6.2.2.2. Other PET Applications
- 6.2.1. SPECT Application
- 6.1. Market Analysis, Insights and Forecast - by Product
- 7. South America Nuclear Imaging Market in US Analysis, Insights and Forecast, 2019-2031
- 7.1. Market Analysis, Insights and Forecast - by Product
- 7.1.1. Equipment
- 7.1.2. Diagnostic Radioisotope
- 7.1.2.1. SPECT Radioisotopes
- 7.1.2.2. PET Radioisotopes
- 7.2. Market Analysis, Insights and Forecast - by Application
- 7.2.1. SPECT Application
- 7.2.1.1. Cardiology
- 7.2.1.2. Neurology
- 7.2.1.3. Thyroid
- 7.2.1.4. Other SPECT Applications
- 7.2.2. PET Application
- 7.2.2.1. Oncology
- 7.2.2.2. Other PET Applications
- 7.2.1. SPECT Application
- 7.1. Market Analysis, Insights and Forecast - by Product
- 8. Europe Nuclear Imaging Market in US Analysis, Insights and Forecast, 2019-2031
- 8.1. Market Analysis, Insights and Forecast - by Product
- 8.1.1. Equipment
- 8.1.2. Diagnostic Radioisotope
- 8.1.2.1. SPECT Radioisotopes
- 8.1.2.2. PET Radioisotopes
- 8.2. Market Analysis, Insights and Forecast - by Application
- 8.2.1. SPECT Application
- 8.2.1.1. Cardiology
- 8.2.1.2. Neurology
- 8.2.1.3. Thyroid
- 8.2.1.4. Other SPECT Applications
- 8.2.2. PET Application
- 8.2.2.1. Oncology
- 8.2.2.2. Other PET Applications
- 8.2.1. SPECT Application
- 8.1. Market Analysis, Insights and Forecast - by Product
- 9. Middle East & Africa Nuclear Imaging Market in US Analysis, Insights and Forecast, 2019-2031
- 9.1. Market Analysis, Insights and Forecast - by Product
- 9.1.1. Equipment
- 9.1.2. Diagnostic Radioisotope
- 9.1.2.1. SPECT Radioisotopes
- 9.1.2.2. PET Radioisotopes
- 9.2. Market Analysis, Insights and Forecast - by Application
- 9.2.1. SPECT Application
- 9.2.1.1. Cardiology
- 9.2.1.2. Neurology
- 9.2.1.3. Thyroid
- 9.2.1.4. Other SPECT Applications
- 9.2.2. PET Application
- 9.2.2.1. Oncology
- 9.2.2.2. Other PET Applications
- 9.2.1. SPECT Application
- 9.1. Market Analysis, Insights and Forecast - by Product
- 10. Asia Pacific Nuclear Imaging Market in US Analysis, Insights and Forecast, 2019-2031
- 10.1. Market Analysis, Insights and Forecast - by Product
- 10.1.1. Equipment
- 10.1.2. Diagnostic Radioisotope
- 10.1.2.1. SPECT Radioisotopes
- 10.1.2.2. PET Radioisotopes
- 10.2. Market Analysis, Insights and Forecast - by Application
- 10.2.1. SPECT Application
- 10.2.1.1. Cardiology
- 10.2.1.2. Neurology
- 10.2.1.3. Thyroid
- 10.2.1.4. Other SPECT Applications
- 10.2.2. PET Application
- 10.2.2.1. Oncology
- 10.2.2.2. Other PET Applications
- 10.2.1. SPECT Application
- 10.1. Market Analysis, Insights and Forecast - by Product
- 11. Northeast Nuclear Imaging Market in US Analysis, Insights and Forecast, 2019-2031
- 12. Southeast Nuclear Imaging Market in US Analysis, Insights and Forecast, 2019-2031
- 13. Midwest Nuclear Imaging Market in US Analysis, Insights and Forecast, 2019-2031
- 14. Southwest Nuclear Imaging Market in US Analysis, Insights and Forecast, 2019-2031
- 15. West Nuclear Imaging Market in US Analysis, Insights and Forecast, 2019-2031
- 16. Competitive Analysis
- 16.1. Global Market Share Analysis 2024
- 16.2. Company Profiles
- 16.2.1 BWX Technologies Inc
- 16.2.1.1. Overview
- 16.2.1.2. Products
- 16.2.1.3. SWOT Analysis
- 16.2.1.4. Recent Developments
- 16.2.1.5. Financials (Based on Availability)
- 16.2.2 Canon Inc (Canon Medical Systems Corporation)
- 16.2.2.1. Overview
- 16.2.2.2. Products
- 16.2.2.3. SWOT Analysis
- 16.2.2.4. Recent Developments
- 16.2.2.5. Financials (Based on Availability)
- 16.2.3 Bracco Group
- 16.2.3.1. Overview
- 16.2.3.2. Products
- 16.2.3.3. SWOT Analysis
- 16.2.3.4. Recent Developments
- 16.2.3.5. Financials (Based on Availability)
- 16.2.4 Koninklijke Philips N V
- 16.2.4.1. Overview
- 16.2.4.2. Products
- 16.2.4.3. SWOT Analysis
- 16.2.4.4. Recent Developments
- 16.2.4.5. Financials (Based on Availability)
- 16.2.5 Cardinal Health Inc
- 16.2.5.1. Overview
- 16.2.5.2. Products
- 16.2.5.3. SWOT Analysis
- 16.2.5.4. Recent Developments
- 16.2.5.5. Financials (Based on Availability)
- 16.2.6 Siemens Healthineers AG
- 16.2.6.1. Overview
- 16.2.6.2. Products
- 16.2.6.3. SWOT Analysis
- 16.2.6.4. Recent Developments
- 16.2.6.5. Financials (Based on Availability)
- 16.2.7 Novartis AG (Advanced Accelerator Applications)
- 16.2.7.1. Overview
- 16.2.7.2. Products
- 16.2.7.3. SWOT Analysis
- 16.2.7.4. Recent Developments
- 16.2.7.5. Financials (Based on Availability)
- 16.2.8 GE Healthcare
- 16.2.8.1. Overview
- 16.2.8.2. Products
- 16.2.8.3. SWOT Analysis
- 16.2.8.4. Recent Developments
- 16.2.8.5. Financials (Based on Availability)
- 16.2.9 Curium
- 16.2.9.1. Overview
- 16.2.9.2. Products
- 16.2.9.3. SWOT Analysis
- 16.2.9.4. Recent Developments
- 16.2.9.5. Financials (Based on Availability)
- 16.2.10 Fujifilm Holdings Corporation
- 16.2.10.1. Overview
- 16.2.10.2. Products
- 16.2.10.3. SWOT Analysis
- 16.2.10.4. Recent Developments
- 16.2.10.5. Financials (Based on Availability)
- 16.2.1 BWX Technologies Inc
List of Figures
- Figure 1: Global Nuclear Imaging Market in US Revenue Breakdown (Million, %) by Region 2024 & 2032
- Figure 2: United states Nuclear Imaging Market in US Revenue (Million), by Country 2024 & 2032
- Figure 3: United states Nuclear Imaging Market in US Revenue Share (%), by Country 2024 & 2032
- Figure 4: North America Nuclear Imaging Market in US Revenue (Million), by Product 2024 & 2032
- Figure 5: North America Nuclear Imaging Market in US Revenue Share (%), by Product 2024 & 2032
- Figure 6: North America Nuclear Imaging Market in US Revenue (Million), by Application 2024 & 2032
- Figure 7: North America Nuclear Imaging Market in US Revenue Share (%), by Application 2024 & 2032
- Figure 8: North America Nuclear Imaging Market in US Revenue (Million), by Country 2024 & 2032
- Figure 9: North America Nuclear Imaging Market in US Revenue Share (%), by Country 2024 & 2032
- Figure 10: South America Nuclear Imaging Market in US Revenue (Million), by Product 2024 & 2032
- Figure 11: South America Nuclear Imaging Market in US Revenue Share (%), by Product 2024 & 2032
- Figure 12: South America Nuclear Imaging Market in US Revenue (Million), by Application 2024 & 2032
- Figure 13: South America Nuclear Imaging Market in US Revenue Share (%), by Application 2024 & 2032
- Figure 14: South America Nuclear Imaging Market in US Revenue (Million), by Country 2024 & 2032
- Figure 15: South America Nuclear Imaging Market in US Revenue Share (%), by Country 2024 & 2032
- Figure 16: Europe Nuclear Imaging Market in US Revenue (Million), by Product 2024 & 2032
- Figure 17: Europe Nuclear Imaging Market in US Revenue Share (%), by Product 2024 & 2032
- Figure 18: Europe Nuclear Imaging Market in US Revenue (Million), by Application 2024 & 2032
- Figure 19: Europe Nuclear Imaging Market in US Revenue Share (%), by Application 2024 & 2032
- Figure 20: Europe Nuclear Imaging Market in US Revenue (Million), by Country 2024 & 2032
- Figure 21: Europe Nuclear Imaging Market in US Revenue Share (%), by Country 2024 & 2032
- Figure 22: Middle East & Africa Nuclear Imaging Market in US Revenue (Million), by Product 2024 & 2032
- Figure 23: Middle East & Africa Nuclear Imaging Market in US Revenue Share (%), by Product 2024 & 2032
- Figure 24: Middle East & Africa Nuclear Imaging Market in US Revenue (Million), by Application 2024 & 2032
- Figure 25: Middle East & Africa Nuclear Imaging Market in US Revenue Share (%), by Application 2024 & 2032
- Figure 26: Middle East & Africa Nuclear Imaging Market in US Revenue (Million), by Country 2024 & 2032
- Figure 27: Middle East & Africa Nuclear Imaging Market in US Revenue Share (%), by Country 2024 & 2032
- Figure 28: Asia Pacific Nuclear Imaging Market in US Revenue (Million), by Product 2024 & 2032
- Figure 29: Asia Pacific Nuclear Imaging Market in US Revenue Share (%), by Product 2024 & 2032
- Figure 30: Asia Pacific Nuclear Imaging Market in US Revenue (Million), by Application 2024 & 2032
- Figure 31: Asia Pacific Nuclear Imaging Market in US Revenue Share (%), by Application 2024 & 2032
- Figure 32: Asia Pacific Nuclear Imaging Market in US Revenue (Million), by Country 2024 & 2032
- Figure 33: Asia Pacific Nuclear Imaging Market in US Revenue Share (%), by Country 2024 & 2032
List of Tables
- Table 1: Global Nuclear Imaging Market in US Revenue Million Forecast, by Region 2019 & 2032
- Table 2: Global Nuclear Imaging Market in US Revenue Million Forecast, by Product 2019 & 2032
- Table 3: Global Nuclear Imaging Market in US Revenue Million Forecast, by Application 2019 & 2032
- Table 4: Global Nuclear Imaging Market in US Revenue Million Forecast, by Region 2019 & 2032
- Table 5: Global Nuclear Imaging Market in US Revenue Million Forecast, by Country 2019 & 2032
- Table 6: Northeast Nuclear Imaging Market in US Revenue (Million) Forecast, by Application 2019 & 2032
- Table 7: Southeast Nuclear Imaging Market in US Revenue (Million) Forecast, by Application 2019 & 2032
- Table 8: Midwest Nuclear Imaging Market in US Revenue (Million) Forecast, by Application 2019 & 2032
- Table 9: Southwest Nuclear Imaging Market in US Revenue (Million) Forecast, by Application 2019 & 2032
- Table 10: West Nuclear Imaging Market in US Revenue (Million) Forecast, by Application 2019 & 2032
- Table 11: Global Nuclear Imaging Market in US Revenue Million Forecast, by Product 2019 & 2032
- Table 12: Global Nuclear Imaging Market in US Revenue Million Forecast, by Application 2019 & 2032
- Table 13: Global Nuclear Imaging Market in US Revenue Million Forecast, by Country 2019 & 2032
- Table 14: United States Nuclear Imaging Market in US Revenue (Million) Forecast, by Application 2019 & 2032
- Table 15: Canada Nuclear Imaging Market in US Revenue (Million) Forecast, by Application 2019 & 2032
- Table 16: Mexico Nuclear Imaging Market in US Revenue (Million) Forecast, by Application 2019 & 2032
- Table 17: Global Nuclear Imaging Market in US Revenue Million Forecast, by Product 2019 & 2032
- Table 18: Global Nuclear Imaging Market in US Revenue Million Forecast, by Application 2019 & 2032
- Table 19: Global Nuclear Imaging Market in US Revenue Million Forecast, by Country 2019 & 2032
- Table 20: Brazil Nuclear Imaging Market in US Revenue (Million) Forecast, by Application 2019 & 2032
- Table 21: Argentina Nuclear Imaging Market in US Revenue (Million) Forecast, by Application 2019 & 2032
- Table 22: Rest of South America Nuclear Imaging Market in US Revenue (Million) Forecast, by Application 2019 & 2032
- Table 23: Global Nuclear Imaging Market in US Revenue Million Forecast, by Product 2019 & 2032
- Table 24: Global Nuclear Imaging Market in US Revenue Million Forecast, by Application 2019 & 2032
- Table 25: Global Nuclear Imaging Market in US Revenue Million Forecast, by Country 2019 & 2032
- Table 26: United Kingdom Nuclear Imaging Market in US Revenue (Million) Forecast, by Application 2019 & 2032
- Table 27: Germany Nuclear Imaging Market in US Revenue (Million) Forecast, by Application 2019 & 2032
- Table 28: France Nuclear Imaging Market in US Revenue (Million) Forecast, by Application 2019 & 2032
- Table 29: Italy Nuclear Imaging Market in US Revenue (Million) Forecast, by Application 2019 & 2032
- Table 30: Spain Nuclear Imaging Market in US Revenue (Million) Forecast, by Application 2019 & 2032
- Table 31: Russia Nuclear Imaging Market in US Revenue (Million) Forecast, by Application 2019 & 2032
- Table 32: Benelux Nuclear Imaging Market in US Revenue (Million) Forecast, by Application 2019 & 2032
- Table 33: Nordics Nuclear Imaging Market in US Revenue (Million) Forecast, by Application 2019 & 2032
- Table 34: Rest of Europe Nuclear Imaging Market in US Revenue (Million) Forecast, by Application 2019 & 2032
- Table 35: Global Nuclear Imaging Market in US Revenue Million Forecast, by Product 2019 & 2032
- Table 36: Global Nuclear Imaging Market in US Revenue Million Forecast, by Application 2019 & 2032
- Table 37: Global Nuclear Imaging Market in US Revenue Million Forecast, by Country 2019 & 2032
- Table 38: Turkey Nuclear Imaging Market in US Revenue (Million) Forecast, by Application 2019 & 2032
- Table 39: Israel Nuclear Imaging Market in US Revenue (Million) Forecast, by Application 2019 & 2032
- Table 40: GCC Nuclear Imaging Market in US Revenue (Million) Forecast, by Application 2019 & 2032
- Table 41: North Africa Nuclear Imaging Market in US Revenue (Million) Forecast, by Application 2019 & 2032
- Table 42: South Africa Nuclear Imaging Market in US Revenue (Million) Forecast, by Application 2019 & 2032
- Table 43: Rest of Middle East & Africa Nuclear Imaging Market in US Revenue (Million) Forecast, by Application 2019 & 2032
- Table 44: Global Nuclear Imaging Market in US Revenue Million Forecast, by Product 2019 & 2032
- Table 45: Global Nuclear Imaging Market in US Revenue Million Forecast, by Application 2019 & 2032
- Table 46: Global Nuclear Imaging Market in US Revenue Million Forecast, by Country 2019 & 2032
- Table 47: China Nuclear Imaging Market in US Revenue (Million) Forecast, by Application 2019 & 2032
- Table 48: India Nuclear Imaging Market in US Revenue (Million) Forecast, by Application 2019 & 2032
- Table 49: Japan Nuclear Imaging Market in US Revenue (Million) Forecast, by Application 2019 & 2032
- Table 50: South Korea Nuclear Imaging Market in US Revenue (Million) Forecast, by Application 2019 & 2032
- Table 51: ASEAN Nuclear Imaging Market in US Revenue (Million) Forecast, by Application 2019 & 2032
- Table 52: Oceania Nuclear Imaging Market in US Revenue (Million) Forecast, by Application 2019 & 2032
- Table 53: Rest of Asia Pacific Nuclear Imaging Market in US Revenue (Million) Forecast, by Application 2019 & 2032
Frequently Asked Questions
1. What is the projected Compound Annual Growth Rate (CAGR) of the Nuclear Imaging Market in US?
The projected CAGR is approximately 3.94%.
2. Which companies are prominent players in the Nuclear Imaging Market in US?
Key companies in the market include BWX Technologies Inc, Canon Inc (Canon Medical Systems Corporation), Bracco Group, Koninklijke Philips N V, Cardinal Health Inc, Siemens Healthineers AG, Novartis AG (Advanced Accelerator Applications), GE Healthcare, Curium, Fujifilm Holdings Corporation.
3. What are the main segments of the Nuclear Imaging Market in US?
The market segments include Product, Application.
4. Can you provide details about the market size?
The market size is estimated to be USD 3.08 Million as of 2022.
5. What are some drivers contributing to market growth?
Increasing Prevalence of Chronic Diseases; Rising Geriatric Population; Increasing Technological Advancements.
6. What are the notable trends driving market growth?
Equipment Segment is Expected to Hold a Significant Market Share Over the Forecast Period.
7. Are there any restraints impacting market growth?
Lack Of Proper Reimbursement And Stringent Regulatory Approval Procedures; High Cost of Equipment.
8. Can you provide examples of recent developments in the market?
In June 2022, The Mars Shot Fund was established by the Society of Nuclear Medicine and Molecular Imaging (SNMMI) as a campaign to generate USD 100 million to support nuclear medicine, molecular imaging, and therapeutic research. Grants and pledges of USD 600,000 have been made to the fund so far, and efforts are being made to boost federal spending on this problem.
9. What pricing options are available for accessing the report?
Pricing options include single-user, multi-user, and enterprise licenses priced at USD 3800, USD 4500, and USD 5800 respectively.
10. Is the market size provided in terms of value or volume?
The market size is provided in terms of value, measured in Million.
11. Are there any specific market keywords associated with the report?
Yes, the market keyword associated with the report is "Nuclear Imaging Market in US," which aids in identifying and referencing the specific market segment covered.
12. How do I determine which pricing option suits my needs best?
The pricing options vary based on user requirements and access needs. Individual users may opt for single-user licenses, while businesses requiring broader access may choose multi-user or enterprise licenses for cost-effective access to the report.
13. Are there any additional resources or data provided in the Nuclear Imaging Market in US report?
While the report offers comprehensive insights, it's advisable to review the specific contents or supplementary materials provided to ascertain if additional resources or data are available.
14. How can I stay updated on further developments or reports in the Nuclear Imaging Market in US?
To stay informed about further developments, trends, and reports in the Nuclear Imaging Market in US, consider subscribing to industry newsletters, following relevant companies and organizations, or regularly checking reputable industry news sources and publications.
Methodology
Step 1 - Identification of Relevant Samples Size from Population Database


Step 2 - Approaches for Defining Global Market Size (Value, Volume* & Price*)

Note*: In applicable scenarios
Step 3 - Data Sources
Primary Research
- Web Analytics
- Survey Reports
- Research Institute
- Latest Research Reports
- Opinion Leaders
Secondary Research
- Annual Reports
- White Paper
- Latest Press Release
- Industry Association
- Paid Database
- Investor Presentations

Step 4 - Data Triangulation
Involves using different sources of information in order to increase the validity of a study
These sources are likely to be stakeholders in a program - participants, other researchers, program staff, other community members, and so on.
Then we put all data in single framework & apply various statistical tools to find out the dynamic on the market.
During the analysis stage, feedback from the stakeholder groups would be compared to determine areas of agreement as well as areas of divergence
