

Key Insights
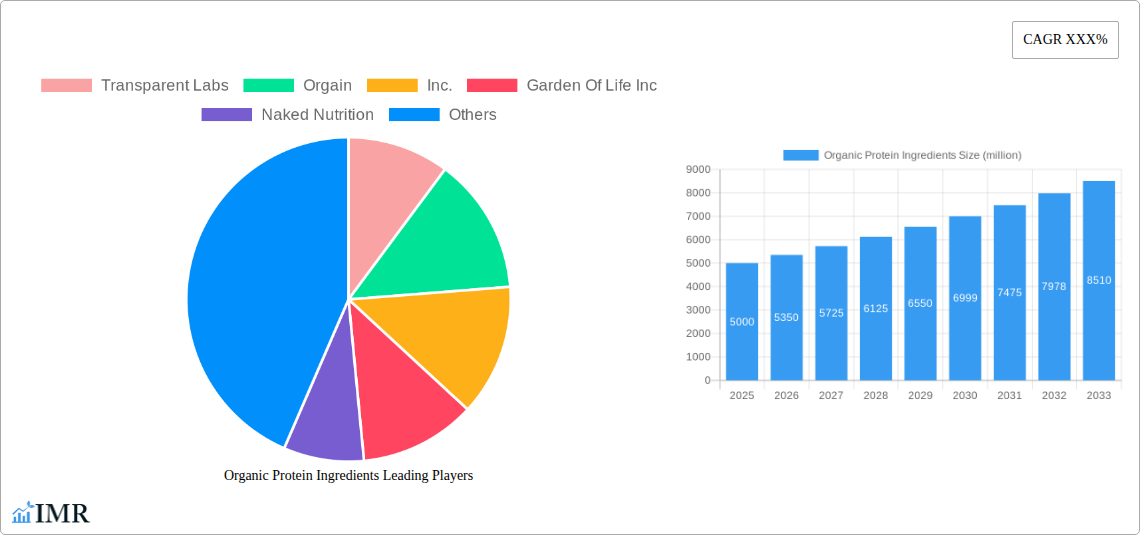
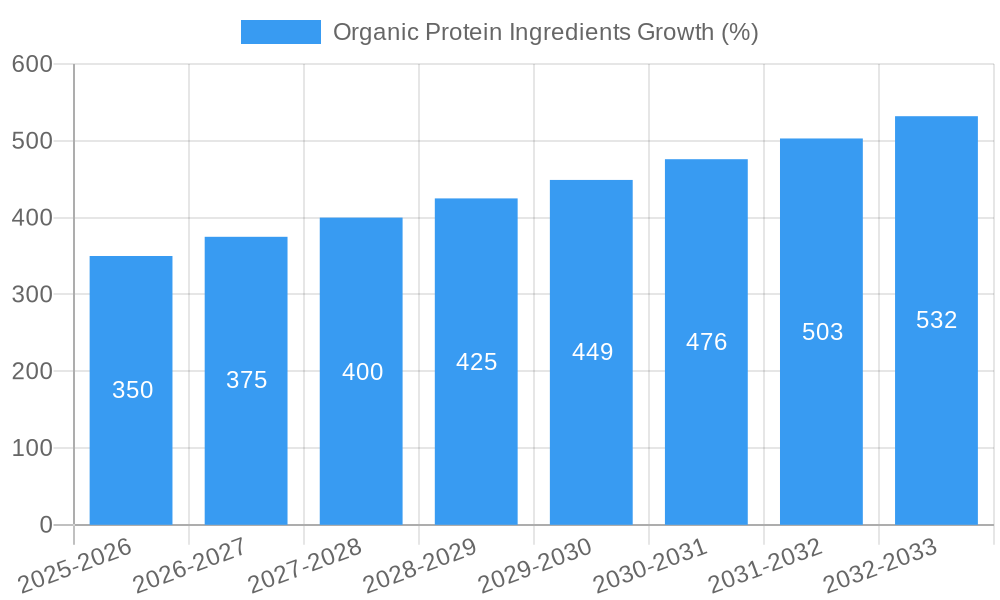
The organic protein ingredients market is experiencing robust growth, driven by increasing consumer demand for clean-label, health-conscious products and a rising awareness of the benefits of plant-based protein sources. The market, currently estimated at $5 billion in 2025, is projected to maintain a healthy Compound Annual Growth Rate (CAGR) of approximately 7% from 2025 to 2033. This growth is fueled by several key trends: the burgeoning popularity of vegan and vegetarian diets, a focus on sustainable and ethically sourced ingredients, and the growing prevalence of chronic diseases linked to poor nutrition, prompting consumers to seek out healthier alternatives. Key players like Transparent Labs, Orgain, Garden of Life, Naked Nutrition, Natural Force, Reserveage, LLC, and Jarrow Formulas are actively shaping the market landscape through product innovation and strategic expansions.
However, the market faces certain restraints. Fluctuations in raw material prices, particularly for organic crops, can impact profitability. Moreover, stringent regulations surrounding organic certification and labeling processes add to the cost of production, potentially limiting market accessibility. Despite these challenges, the long-term outlook for organic protein ingredients remains positive. The increasing penetration of e-commerce channels and the rising disposable incomes in developing economies are expected to further stimulate market expansion. Segmentation within the market includes various protein sources (e.g., pea, soy, brown rice) and forms (powders, isolates, concentrates), catering to diverse consumer needs and preferences. The market is expected to reach approximately $9 billion by 2033, propelled by the ongoing health and wellness trends and the rising preference for natural and organic products.
Organic Protein Ingredients Market Report: 2019-2033
This comprehensive report provides an in-depth analysis of the organic protein ingredients market, encompassing market dynamics, growth trends, regional dominance, product landscape, key players, and future outlook. The study period covers 2019-2033, with 2025 as the base and estimated year. The forecast period is 2025-2033, and the historical period is 2019-2024. This report is invaluable for industry professionals, investors, and anyone seeking a detailed understanding of this rapidly evolving market. The market is segmented by source (e.g., pea, soy, brown rice) and application (e.g., dietary supplements, functional foods). The parent market is the broader protein ingredients market, while the child market focuses specifically on the organic segment.
Organic Protein Ingredients Market Dynamics & Structure
The organic protein ingredients market is characterized by moderate concentration, with a few large players and numerous smaller niche businesses. Technological innovation, particularly in extraction and processing methods, is a key driver, alongside increasing consumer demand for clean-label and sustainable products. Stringent regulatory frameworks governing organic certification influence market dynamics. Competitive substitutes include conventional protein sources, although the organic segment benefits from a premium pricing strategy. End-user demographics are shifting towards health-conscious consumers, driving demand. M&A activity has been moderate, with larger companies seeking to expand their portfolio and gain market share.
- Market Concentration: Moderately concentrated, with top 5 players holding approximately xx% market share in 2025.
- Technological Innovation: Focus on sustainable and efficient extraction methods, improving protein quality and yield.
- Regulatory Framework: Stringent organic certifications (e.g., USDA Organic) impacting sourcing and processing costs.
- Competitive Substitutes: Conventional protein ingredients (soy, whey) pose competition, but organic options command premium prices.
- End-User Demographics: Increasing demand from health-conscious consumers, athletes, and vegans/vegetarians.
- M&A Trends: xx M&A deals were recorded between 2019-2024, with an estimated xx deals predicted for 2025-2033.
Organic Protein Ingredients Growth Trends & Insights
The organic protein ingredients market experienced significant growth between 2019 and 2024, driven by increasing consumer awareness of health and wellness, coupled with the growing popularity of plant-based diets. The market size in 2024 was estimated at $xx million, and is projected to reach $xx million by 2033, exhibiting a CAGR of xx% during the forecast period. Technological advancements, such as improved extraction techniques and the development of novel protein sources, have accelerated market growth. Changing consumer preferences towards natural and organic products have fueled adoption rates, exceeding xx% market penetration in key regions by 2025. Furthermore, the rise of e-commerce and direct-to-consumer brands has played a vital role in expanding market reach.
Dominant Regions, Countries, or Segments in Organic Protein Ingredients
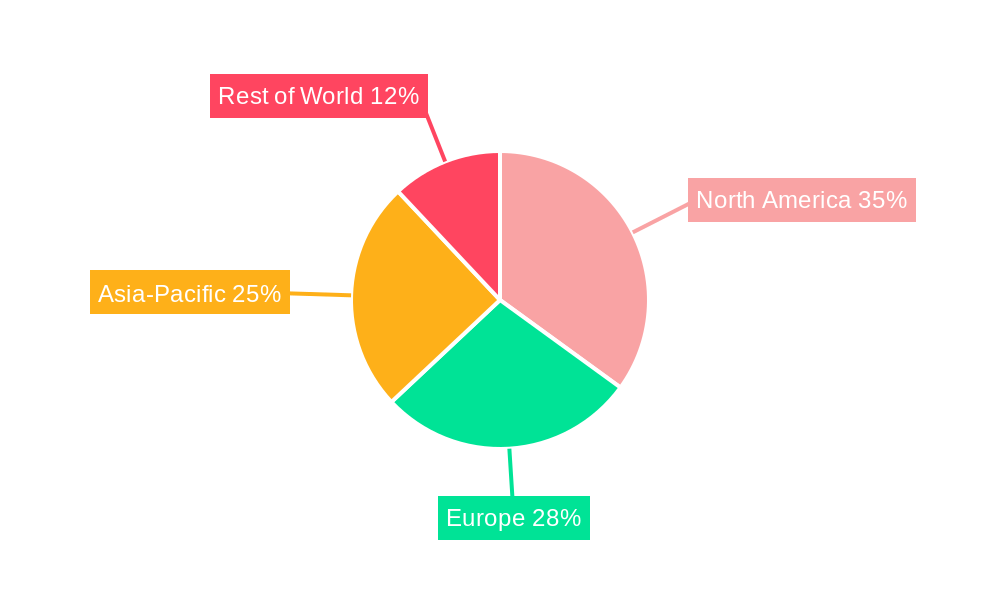
North America currently dominates the organic protein ingredients market, driven by high consumer disposable income, increasing health awareness, and a strong regulatory framework supporting organic agriculture. Europe holds a significant share, while Asia-Pacific is experiencing the fastest growth due to rising middle-class incomes and changing dietary habits. Within segments, pea protein and soy protein remain the dominant players, although other sources, such as brown rice and sunflower protein, are gaining traction.
- North America: High consumer spending, strong regulatory support for organic farming, established distribution networks.
- Europe: Growing demand for plant-based proteins, increasing awareness of sustainable food choices.
- Asia-Pacific: Fastest-growing region, driven by rising middle-class incomes and adoption of Western dietary trends.
- Dominant Segments: Pea protein and soy protein hold the largest market share. However, growth is expected in other segments, including chia seed, pumpkin seed and other novel ingredients.
Organic Protein Ingredients Product Landscape
The organic protein ingredients market offers a diverse range of products, tailored to various applications. Innovations focus on improving protein solubility, digestibility, and functional properties. Technological advancements involve optimizing extraction methods to minimize environmental impact and enhance nutritional value. Unique selling propositions include certifications (e.g., Non-GMO, USDA Organic), traceability, and specific health benefits associated with certain protein sources. The market is witnessing a growing trend towards clean-label products with minimal processing and natural flavors.
Key Drivers, Barriers & Challenges in Organic Protein Ingredients
Key Drivers:
- Growing consumer demand for plant-based protein sources.
- Increasing awareness of the health benefits of organic foods.
- Stricter regulations on food labeling and transparency.
- Expansion of the food and beverage industries.
Challenges and Restraints:
- Higher production costs compared to conventional protein ingredients.
- Limited availability of organic raw materials.
- Supply chain complexities and potential for contamination.
- Intense competition from established players and new entrants. This has led to a price war in some segments, reducing profitability for smaller producers.
Emerging Opportunities in Organic Protein Ingredients
- Growing demand for organic protein in specialized food products like vegan meat alternatives and dairy-free products.
- Expansion into emerging markets with growing middle classes and increased health consciousness.
- Development of innovative product formulations, incorporating organic proteins in sports nutrition and functional foods.
- Utilizing advanced technologies to improve the sustainability and efficiency of organic protein production.
Growth Accelerators in the Organic Protein Ingredients Industry
Technological advancements in extraction and processing are pivotal, alongside strategic partnerships between ingredient suppliers and food manufacturers. Expanding into untapped markets and developing innovative product applications (e.g., organic protein bars, plant-based meat alternatives) significantly boost growth. Furthermore, effective marketing strategies highlighting the health and environmental benefits of organic protein ingredients create high-value consumer adoption.
Key Players Shaping the Organic Protein Ingredients Market
- Transparent Labs
- Orgain, Inc.
- Garden Of Life Inc
- Naked Nutrition
- NATURAL FORCE
- Reserveage, LLC
- Jarrow Formulas, Inc.
Notable Milestones in Organic Protein Ingredients Sector
- 2020: Increased demand for plant-based protein sources due to COVID-19 lockdowns.
- 2021: Several key players announced investments in sustainable farming practices.
- 2022: Launch of several new products featuring innovative organic protein blends.
- 2023: New regulations regarding organic certification standards implemented.
- 2024: Significant increase in mergers and acquisitions in the sector.
In-Depth Organic Protein Ingredients Market Outlook
The organic protein ingredients market is poised for substantial growth driven by sustained consumer preference for health and wellness. Strategic partnerships, innovative product developments, and technological advancements will continue to shape the market landscape. Untapped markets in developing economies present lucrative opportunities for expansion. Focusing on sustainability and traceability will be crucial for building consumer trust and securing long-term market leadership.
Organic Protein Ingredients Segmentation
-
1. Application
- 1.1. Ready-to-drink
- 1.2. Sports Supplement
- 1.3. Nutritional Bars
- 1.4. Others
-
2. Type
- 2.1. Whey
- 2.2. Casein
- 2.3. Milk Protein
Organic Protein Ingredients Segmentation By Geography
-
1. North America
- 1.1. United States
- 1.2. Canada
- 1.3. Mexico
-
2. South America
- 2.1. Brazil
- 2.2. Argentina
- 2.3. Rest of South America
-
3. Europe
- 3.1. United Kingdom
- 3.2. Germany
- 3.3. France
- 3.4. Italy
- 3.5. Spain
- 3.6. Russia
- 3.7. Benelux
- 3.8. Nordics
- 3.9. Rest of Europe
-
4. Middle East & Africa
- 4.1. Turkey
- 4.2. Israel
- 4.3. GCC
- 4.4. North Africa
- 4.5. South Africa
- 4.6. Rest of Middle East & Africa
-
5. Asia Pacific
- 5.1. China
- 5.2. India
- 5.3. Japan
- 5.4. South Korea
- 5.5. ASEAN
- 5.6. Oceania
- 5.7. Rest of Asia Pacific
Organic Protein Ingredients REPORT HIGHLIGHTS
| Aspects | Details |
|---|---|
| Study Period | 2019-2033 |
| Base Year | 2024 |
| Estimated Year | 2025 |
| Forecast Period | 2025-2033 |
| Historical Period | 2019-2024 |
| Growth Rate | CAGR of XXX% from 2019-2033 |
| Segmentation |
|
Table of Contents
- 1. Introduction
- 1.1. Research Scope
- 1.2. Market Segmentation
- 1.3. Research Methodology
- 1.4. Definitions and Assumptions
- 2. Executive Summary
- 2.1. Introduction
- 3. Market Dynamics
- 3.1. Introduction
- 3.2. Market Drivers
- 3.3. Market Restrains
- 3.4. Market Trends
- 4. Market Factor Analysis
- 4.1. Porters Five Forces
- 4.2. Supply/Value Chain
- 4.3. PESTEL analysis
- 4.4. Market Entropy
- 4.5. Patent/Trademark Analysis
- 5. Global Organic Protein Ingredients Analysis, Insights and Forecast, 2019-2031
- 5.1. Market Analysis, Insights and Forecast - by Application
- 5.1.1. Ready-to-drink
- 5.1.2. Sports Supplement
- 5.1.3. Nutritional Bars
- 5.1.4. Others
- 5.2. Market Analysis, Insights and Forecast - by Type
- 5.2.1. Whey
- 5.2.2. Casein
- 5.2.3. Milk Protein
- 5.3. Market Analysis, Insights and Forecast - by Region
- 5.3.1. North America
- 5.3.2. South America
- 5.3.3. Europe
- 5.3.4. Middle East & Africa
- 5.3.5. Asia Pacific
- 5.1. Market Analysis, Insights and Forecast - by Application
- 6. North America Organic Protein Ingredients Analysis, Insights and Forecast, 2019-2031
- 6.1. Market Analysis, Insights and Forecast - by Application
- 6.1.1. Ready-to-drink
- 6.1.2. Sports Supplement
- 6.1.3. Nutritional Bars
- 6.1.4. Others
- 6.2. Market Analysis, Insights and Forecast - by Type
- 6.2.1. Whey
- 6.2.2. Casein
- 6.2.3. Milk Protein
- 6.1. Market Analysis, Insights and Forecast - by Application
- 7. South America Organic Protein Ingredients Analysis, Insights and Forecast, 2019-2031
- 7.1. Market Analysis, Insights and Forecast - by Application
- 7.1.1. Ready-to-drink
- 7.1.2. Sports Supplement
- 7.1.3. Nutritional Bars
- 7.1.4. Others
- 7.2. Market Analysis, Insights and Forecast - by Type
- 7.2.1. Whey
- 7.2.2. Casein
- 7.2.3. Milk Protein
- 7.1. Market Analysis, Insights and Forecast - by Application
- 8. Europe Organic Protein Ingredients Analysis, Insights and Forecast, 2019-2031
- 8.1. Market Analysis, Insights and Forecast - by Application
- 8.1.1. Ready-to-drink
- 8.1.2. Sports Supplement
- 8.1.3. Nutritional Bars
- 8.1.4. Others
- 8.2. Market Analysis, Insights and Forecast - by Type
- 8.2.1. Whey
- 8.2.2. Casein
- 8.2.3. Milk Protein
- 8.1. Market Analysis, Insights and Forecast - by Application
- 9. Middle East & Africa Organic Protein Ingredients Analysis, Insights and Forecast, 2019-2031
- 9.1. Market Analysis, Insights and Forecast - by Application
- 9.1.1. Ready-to-drink
- 9.1.2. Sports Supplement
- 9.1.3. Nutritional Bars
- 9.1.4. Others
- 9.2. Market Analysis, Insights and Forecast - by Type
- 9.2.1. Whey
- 9.2.2. Casein
- 9.2.3. Milk Protein
- 9.1. Market Analysis, Insights and Forecast - by Application
- 10. Asia Pacific Organic Protein Ingredients Analysis, Insights and Forecast, 2019-2031
- 10.1. Market Analysis, Insights and Forecast - by Application
- 10.1.1. Ready-to-drink
- 10.1.2. Sports Supplement
- 10.1.3. Nutritional Bars
- 10.1.4. Others
- 10.2. Market Analysis, Insights and Forecast - by Type
- 10.2.1. Whey
- 10.2.2. Casein
- 10.2.3. Milk Protein
- 10.1. Market Analysis, Insights and Forecast - by Application
- 11. Competitive Analysis
- 11.1. Global Market Share Analysis 2024
- 11.2. Company Profiles
- 11.2.1 Transparent Labs
- 11.2.1.1. Overview
- 11.2.1.2. Products
- 11.2.1.3. SWOT Analysis
- 11.2.1.4. Recent Developments
- 11.2.1.5. Financials (Based on Availability)
- 11.2.2 Orgain
- 11.2.2.1. Overview
- 11.2.2.2. Products
- 11.2.2.3. SWOT Analysis
- 11.2.2.4. Recent Developments
- 11.2.2.5. Financials (Based on Availability)
- 11.2.3 Inc.
- 11.2.3.1. Overview
- 11.2.3.2. Products
- 11.2.3.3. SWOT Analysis
- 11.2.3.4. Recent Developments
- 11.2.3.5. Financials (Based on Availability)
- 11.2.4 Garden Of Life Inc
- 11.2.4.1. Overview
- 11.2.4.2. Products
- 11.2.4.3. SWOT Analysis
- 11.2.4.4. Recent Developments
- 11.2.4.5. Financials (Based on Availability)
- 11.2.5 Naked Nutrition
- 11.2.5.1. Overview
- 11.2.5.2. Products
- 11.2.5.3. SWOT Analysis
- 11.2.5.4. Recent Developments
- 11.2.5.5. Financials (Based on Availability)
- 11.2.6 Opportunities
- 11.2.6.1. Overview
- 11.2.6.2. Products
- 11.2.6.3. SWOT Analysis
- 11.2.6.4. Recent Developments
- 11.2.6.5. Financials (Based on Availability)
- 11.2.7 NATURAL FORCE
- 11.2.7.1. Overview
- 11.2.7.2. Products
- 11.2.7.3. SWOT Analysis
- 11.2.7.4. Recent Developments
- 11.2.7.5. Financials (Based on Availability)
- 11.2.8 Reserveage
- 11.2.8.1. Overview
- 11.2.8.2. Products
- 11.2.8.3. SWOT Analysis
- 11.2.8.4. Recent Developments
- 11.2.8.5. Financials (Based on Availability)
- 11.2.9 LLC
- 11.2.9.1. Overview
- 11.2.9.2. Products
- 11.2.9.3. SWOT Analysis
- 11.2.9.4. Recent Developments
- 11.2.9.5. Financials (Based on Availability)
- 11.2.10 Jarrow Formulas
- 11.2.10.1. Overview
- 11.2.10.2. Products
- 11.2.10.3. SWOT Analysis
- 11.2.10.4. Recent Developments
- 11.2.10.5. Financials (Based on Availability)
- 11.2.11 Inc.
- 11.2.11.1. Overview
- 11.2.11.2. Products
- 11.2.11.3. SWOT Analysis
- 11.2.11.4. Recent Developments
- 11.2.11.5. Financials (Based on Availability)
- 11.2.1 Transparent Labs
List of Figures
- Figure 1: Global Organic Protein Ingredients Revenue Breakdown (million, %) by Region 2024 & 2032
- Figure 2: Global Organic Protein Ingredients Volume Breakdown (K, %) by Region 2024 & 2032
- Figure 3: North America Organic Protein Ingredients Revenue (million), by Application 2024 & 2032
- Figure 4: North America Organic Protein Ingredients Volume (K), by Application 2024 & 2032
- Figure 5: North America Organic Protein Ingredients Revenue Share (%), by Application 2024 & 2032
- Figure 6: North America Organic Protein Ingredients Volume Share (%), by Application 2024 & 2032
- Figure 7: North America Organic Protein Ingredients Revenue (million), by Type 2024 & 2032
- Figure 8: North America Organic Protein Ingredients Volume (K), by Type 2024 & 2032
- Figure 9: North America Organic Protein Ingredients Revenue Share (%), by Type 2024 & 2032
- Figure 10: North America Organic Protein Ingredients Volume Share (%), by Type 2024 & 2032
- Figure 11: North America Organic Protein Ingredients Revenue (million), by Country 2024 & 2032
- Figure 12: North America Organic Protein Ingredients Volume (K), by Country 2024 & 2032
- Figure 13: North America Organic Protein Ingredients Revenue Share (%), by Country 2024 & 2032
- Figure 14: North America Organic Protein Ingredients Volume Share (%), by Country 2024 & 2032
- Figure 15: South America Organic Protein Ingredients Revenue (million), by Application 2024 & 2032
- Figure 16: South America Organic Protein Ingredients Volume (K), by Application 2024 & 2032
- Figure 17: South America Organic Protein Ingredients Revenue Share (%), by Application 2024 & 2032
- Figure 18: South America Organic Protein Ingredients Volume Share (%), by Application 2024 & 2032
- Figure 19: South America Organic Protein Ingredients Revenue (million), by Type 2024 & 2032
- Figure 20: South America Organic Protein Ingredients Volume (K), by Type 2024 & 2032
- Figure 21: South America Organic Protein Ingredients Revenue Share (%), by Type 2024 & 2032
- Figure 22: South America Organic Protein Ingredients Volume Share (%), by Type 2024 & 2032
- Figure 23: South America Organic Protein Ingredients Revenue (million), by Country 2024 & 2032
- Figure 24: South America Organic Protein Ingredients Volume (K), by Country 2024 & 2032
- Figure 25: South America Organic Protein Ingredients Revenue Share (%), by Country 2024 & 2032
- Figure 26: South America Organic Protein Ingredients Volume Share (%), by Country 2024 & 2032
- Figure 27: Europe Organic Protein Ingredients Revenue (million), by Application 2024 & 2032
- Figure 28: Europe Organic Protein Ingredients Volume (K), by Application 2024 & 2032
- Figure 29: Europe Organic Protein Ingredients Revenue Share (%), by Application 2024 & 2032
- Figure 30: Europe Organic Protein Ingredients Volume Share (%), by Application 2024 & 2032
- Figure 31: Europe Organic Protein Ingredients Revenue (million), by Type 2024 & 2032
- Figure 32: Europe Organic Protein Ingredients Volume (K), by Type 2024 & 2032
- Figure 33: Europe Organic Protein Ingredients Revenue Share (%), by Type 2024 & 2032
- Figure 34: Europe Organic Protein Ingredients Volume Share (%), by Type 2024 & 2032
- Figure 35: Europe Organic Protein Ingredients Revenue (million), by Country 2024 & 2032
- Figure 36: Europe Organic Protein Ingredients Volume (K), by Country 2024 & 2032
- Figure 37: Europe Organic Protein Ingredients Revenue Share (%), by Country 2024 & 2032
- Figure 38: Europe Organic Protein Ingredients Volume Share (%), by Country 2024 & 2032
- Figure 39: Middle East & Africa Organic Protein Ingredients Revenue (million), by Application 2024 & 2032
- Figure 40: Middle East & Africa Organic Protein Ingredients Volume (K), by Application 2024 & 2032
- Figure 41: Middle East & Africa Organic Protein Ingredients Revenue Share (%), by Application 2024 & 2032
- Figure 42: Middle East & Africa Organic Protein Ingredients Volume Share (%), by Application 2024 & 2032
- Figure 43: Middle East & Africa Organic Protein Ingredients Revenue (million), by Type 2024 & 2032
- Figure 44: Middle East & Africa Organic Protein Ingredients Volume (K), by Type 2024 & 2032
- Figure 45: Middle East & Africa Organic Protein Ingredients Revenue Share (%), by Type 2024 & 2032
- Figure 46: Middle East & Africa Organic Protein Ingredients Volume Share (%), by Type 2024 & 2032
- Figure 47: Middle East & Africa Organic Protein Ingredients Revenue (million), by Country 2024 & 2032
- Figure 48: Middle East & Africa Organic Protein Ingredients Volume (K), by Country 2024 & 2032
- Figure 49: Middle East & Africa Organic Protein Ingredients Revenue Share (%), by Country 2024 & 2032
- Figure 50: Middle East & Africa Organic Protein Ingredients Volume Share (%), by Country 2024 & 2032
- Figure 51: Asia Pacific Organic Protein Ingredients Revenue (million), by Application 2024 & 2032
- Figure 52: Asia Pacific Organic Protein Ingredients Volume (K), by Application 2024 & 2032
- Figure 53: Asia Pacific Organic Protein Ingredients Revenue Share (%), by Application 2024 & 2032
- Figure 54: Asia Pacific Organic Protein Ingredients Volume Share (%), by Application 2024 & 2032
- Figure 55: Asia Pacific Organic Protein Ingredients Revenue (million), by Type 2024 & 2032
- Figure 56: Asia Pacific Organic Protein Ingredients Volume (K), by Type 2024 & 2032
- Figure 57: Asia Pacific Organic Protein Ingredients Revenue Share (%), by Type 2024 & 2032
- Figure 58: Asia Pacific Organic Protein Ingredients Volume Share (%), by Type 2024 & 2032
- Figure 59: Asia Pacific Organic Protein Ingredients Revenue (million), by Country 2024 & 2032
- Figure 60: Asia Pacific Organic Protein Ingredients Volume (K), by Country 2024 & 2032
- Figure 61: Asia Pacific Organic Protein Ingredients Revenue Share (%), by Country 2024 & 2032
- Figure 62: Asia Pacific Organic Protein Ingredients Volume Share (%), by Country 2024 & 2032
List of Tables
- Table 1: Global Organic Protein Ingredients Revenue million Forecast, by Region 2019 & 2032
- Table 2: Global Organic Protein Ingredients Volume K Forecast, by Region 2019 & 2032
- Table 3: Global Organic Protein Ingredients Revenue million Forecast, by Application 2019 & 2032
- Table 4: Global Organic Protein Ingredients Volume K Forecast, by Application 2019 & 2032
- Table 5: Global Organic Protein Ingredients Revenue million Forecast, by Type 2019 & 2032
- Table 6: Global Organic Protein Ingredients Volume K Forecast, by Type 2019 & 2032
- Table 7: Global Organic Protein Ingredients Revenue million Forecast, by Region 2019 & 2032
- Table 8: Global Organic Protein Ingredients Volume K Forecast, by Region 2019 & 2032
- Table 9: Global Organic Protein Ingredients Revenue million Forecast, by Application 2019 & 2032
- Table 10: Global Organic Protein Ingredients Volume K Forecast, by Application 2019 & 2032
- Table 11: Global Organic Protein Ingredients Revenue million Forecast, by Type 2019 & 2032
- Table 12: Global Organic Protein Ingredients Volume K Forecast, by Type 2019 & 2032
- Table 13: Global Organic Protein Ingredients Revenue million Forecast, by Country 2019 & 2032
- Table 14: Global Organic Protein Ingredients Volume K Forecast, by Country 2019 & 2032
- Table 15: United States Organic Protein Ingredients Revenue (million) Forecast, by Application 2019 & 2032
- Table 16: United States Organic Protein Ingredients Volume (K) Forecast, by Application 2019 & 2032
- Table 17: Canada Organic Protein Ingredients Revenue (million) Forecast, by Application 2019 & 2032
- Table 18: Canada Organic Protein Ingredients Volume (K) Forecast, by Application 2019 & 2032
- Table 19: Mexico Organic Protein Ingredients Revenue (million) Forecast, by Application 2019 & 2032
- Table 20: Mexico Organic Protein Ingredients Volume (K) Forecast, by Application 2019 & 2032
- Table 21: Global Organic Protein Ingredients Revenue million Forecast, by Application 2019 & 2032
- Table 22: Global Organic Protein Ingredients Volume K Forecast, by Application 2019 & 2032
- Table 23: Global Organic Protein Ingredients Revenue million Forecast, by Type 2019 & 2032
- Table 24: Global Organic Protein Ingredients Volume K Forecast, by Type 2019 & 2032
- Table 25: Global Organic Protein Ingredients Revenue million Forecast, by Country 2019 & 2032
- Table 26: Global Organic Protein Ingredients Volume K Forecast, by Country 2019 & 2032
- Table 27: Brazil Organic Protein Ingredients Revenue (million) Forecast, by Application 2019 & 2032
- Table 28: Brazil Organic Protein Ingredients Volume (K) Forecast, by Application 2019 & 2032
- Table 29: Argentina Organic Protein Ingredients Revenue (million) Forecast, by Application 2019 & 2032
- Table 30: Argentina Organic Protein Ingredients Volume (K) Forecast, by Application 2019 & 2032
- Table 31: Rest of South America Organic Protein Ingredients Revenue (million) Forecast, by Application 2019 & 2032
- Table 32: Rest of South America Organic Protein Ingredients Volume (K) Forecast, by Application 2019 & 2032
- Table 33: Global Organic Protein Ingredients Revenue million Forecast, by Application 2019 & 2032
- Table 34: Global Organic Protein Ingredients Volume K Forecast, by Application 2019 & 2032
- Table 35: Global Organic Protein Ingredients Revenue million Forecast, by Type 2019 & 2032
- Table 36: Global Organic Protein Ingredients Volume K Forecast, by Type 2019 & 2032
- Table 37: Global Organic Protein Ingredients Revenue million Forecast, by Country 2019 & 2032
- Table 38: Global Organic Protein Ingredients Volume K Forecast, by Country 2019 & 2032
- Table 39: United Kingdom Organic Protein Ingredients Revenue (million) Forecast, by Application 2019 & 2032
- Table 40: United Kingdom Organic Protein Ingredients Volume (K) Forecast, by Application 2019 & 2032
- Table 41: Germany Organic Protein Ingredients Revenue (million) Forecast, by Application 2019 & 2032
- Table 42: Germany Organic Protein Ingredients Volume (K) Forecast, by Application 2019 & 2032
- Table 43: France Organic Protein Ingredients Revenue (million) Forecast, by Application 2019 & 2032
- Table 44: France Organic Protein Ingredients Volume (K) Forecast, by Application 2019 & 2032
- Table 45: Italy Organic Protein Ingredients Revenue (million) Forecast, by Application 2019 & 2032
- Table 46: Italy Organic Protein Ingredients Volume (K) Forecast, by Application 2019 & 2032
- Table 47: Spain Organic Protein Ingredients Revenue (million) Forecast, by Application 2019 & 2032
- Table 48: Spain Organic Protein Ingredients Volume (K) Forecast, by Application 2019 & 2032
- Table 49: Russia Organic Protein Ingredients Revenue (million) Forecast, by Application 2019 & 2032
- Table 50: Russia Organic Protein Ingredients Volume (K) Forecast, by Application 2019 & 2032
- Table 51: Benelux Organic Protein Ingredients Revenue (million) Forecast, by Application 2019 & 2032
- Table 52: Benelux Organic Protein Ingredients Volume (K) Forecast, by Application 2019 & 2032
- Table 53: Nordics Organic Protein Ingredients Revenue (million) Forecast, by Application 2019 & 2032
- Table 54: Nordics Organic Protein Ingredients Volume (K) Forecast, by Application 2019 & 2032
- Table 55: Rest of Europe Organic Protein Ingredients Revenue (million) Forecast, by Application 2019 & 2032
- Table 56: Rest of Europe Organic Protein Ingredients Volume (K) Forecast, by Application 2019 & 2032
- Table 57: Global Organic Protein Ingredients Revenue million Forecast, by Application 2019 & 2032
- Table 58: Global Organic Protein Ingredients Volume K Forecast, by Application 2019 & 2032
- Table 59: Global Organic Protein Ingredients Revenue million Forecast, by Type 2019 & 2032
- Table 60: Global Organic Protein Ingredients Volume K Forecast, by Type 2019 & 2032
- Table 61: Global Organic Protein Ingredients Revenue million Forecast, by Country 2019 & 2032
- Table 62: Global Organic Protein Ingredients Volume K Forecast, by Country 2019 & 2032
- Table 63: Turkey Organic Protein Ingredients Revenue (million) Forecast, by Application 2019 & 2032
- Table 64: Turkey Organic Protein Ingredients Volume (K) Forecast, by Application 2019 & 2032
- Table 65: Israel Organic Protein Ingredients Revenue (million) Forecast, by Application 2019 & 2032
- Table 66: Israel Organic Protein Ingredients Volume (K) Forecast, by Application 2019 & 2032
- Table 67: GCC Organic Protein Ingredients Revenue (million) Forecast, by Application 2019 & 2032
- Table 68: GCC Organic Protein Ingredients Volume (K) Forecast, by Application 2019 & 2032
- Table 69: North Africa Organic Protein Ingredients Revenue (million) Forecast, by Application 2019 & 2032
- Table 70: North Africa Organic Protein Ingredients Volume (K) Forecast, by Application 2019 & 2032
- Table 71: South Africa Organic Protein Ingredients Revenue (million) Forecast, by Application 2019 & 2032
- Table 72: South Africa Organic Protein Ingredients Volume (K) Forecast, by Application 2019 & 2032
- Table 73: Rest of Middle East & Africa Organic Protein Ingredients Revenue (million) Forecast, by Application 2019 & 2032
- Table 74: Rest of Middle East & Africa Organic Protein Ingredients Volume (K) Forecast, by Application 2019 & 2032
- Table 75: Global Organic Protein Ingredients Revenue million Forecast, by Application 2019 & 2032
- Table 76: Global Organic Protein Ingredients Volume K Forecast, by Application 2019 & 2032
- Table 77: Global Organic Protein Ingredients Revenue million Forecast, by Type 2019 & 2032
- Table 78: Global Organic Protein Ingredients Volume K Forecast, by Type 2019 & 2032
- Table 79: Global Organic Protein Ingredients Revenue million Forecast, by Country 2019 & 2032
- Table 80: Global Organic Protein Ingredients Volume K Forecast, by Country 2019 & 2032
- Table 81: China Organic Protein Ingredients Revenue (million) Forecast, by Application 2019 & 2032
- Table 82: China Organic Protein Ingredients Volume (K) Forecast, by Application 2019 & 2032
- Table 83: India Organic Protein Ingredients Revenue (million) Forecast, by Application 2019 & 2032
- Table 84: India Organic Protein Ingredients Volume (K) Forecast, by Application 2019 & 2032
- Table 85: Japan Organic Protein Ingredients Revenue (million) Forecast, by Application 2019 & 2032
- Table 86: Japan Organic Protein Ingredients Volume (K) Forecast, by Application 2019 & 2032
- Table 87: South Korea Organic Protein Ingredients Revenue (million) Forecast, by Application 2019 & 2032
- Table 88: South Korea Organic Protein Ingredients Volume (K) Forecast, by Application 2019 & 2032
- Table 89: ASEAN Organic Protein Ingredients Revenue (million) Forecast, by Application 2019 & 2032
- Table 90: ASEAN Organic Protein Ingredients Volume (K) Forecast, by Application 2019 & 2032
- Table 91: Oceania Organic Protein Ingredients Revenue (million) Forecast, by Application 2019 & 2032
- Table 92: Oceania Organic Protein Ingredients Volume (K) Forecast, by Application 2019 & 2032
- Table 93: Rest of Asia Pacific Organic Protein Ingredients Revenue (million) Forecast, by Application 2019 & 2032
- Table 94: Rest of Asia Pacific Organic Protein Ingredients Volume (K) Forecast, by Application 2019 & 2032
Frequently Asked Questions
1. What is the projected Compound Annual Growth Rate (CAGR) of the Organic Protein Ingredients?
The projected CAGR is approximately XXX%.
2. Which companies are prominent players in the Organic Protein Ingredients?
Key companies in the market include Transparent Labs, Orgain, Inc., Garden Of Life Inc, Naked Nutrition, Opportunities, NATURAL FORCE, Reserveage, LLC, Jarrow Formulas, Inc..
3. What are the main segments of the Organic Protein Ingredients?
The market segments include Application, Type.
4. Can you provide details about the market size?
The market size is estimated to be USD XXX million as of 2022.
5. What are some drivers contributing to market growth?
N/A
6. What are the notable trends driving market growth?
N/A
7. Are there any restraints impacting market growth?
N/A
8. Can you provide examples of recent developments in the market?
N/A
9. What pricing options are available for accessing the report?
Pricing options include single-user, multi-user, and enterprise licenses priced at USD 3950.00, USD 5925.00, and USD 7900.00 respectively.
10. Is the market size provided in terms of value or volume?
The market size is provided in terms of value, measured in million and volume, measured in K.
11. Are there any specific market keywords associated with the report?
Yes, the market keyword associated with the report is "Organic Protein Ingredients," which aids in identifying and referencing the specific market segment covered.
12. How do I determine which pricing option suits my needs best?
The pricing options vary based on user requirements and access needs. Individual users may opt for single-user licenses, while businesses requiring broader access may choose multi-user or enterprise licenses for cost-effective access to the report.
13. Are there any additional resources or data provided in the Organic Protein Ingredients report?
While the report offers comprehensive insights, it's advisable to review the specific contents or supplementary materials provided to ascertain if additional resources or data are available.
14. How can I stay updated on further developments or reports in the Organic Protein Ingredients?
To stay informed about further developments, trends, and reports in the Organic Protein Ingredients, consider subscribing to industry newsletters, following relevant companies and organizations, or regularly checking reputable industry news sources and publications.
Methodology
Step 1 - Identification of Relevant Samples Size from Population Database


Step 2 - Approaches for Defining Global Market Size (Value, Volume* & Price*)

Note*: In applicable scenarios
Step 3 - Data Sources
Primary Research
- Web Analytics
- Survey Reports
- Research Institute
- Latest Research Reports
- Opinion Leaders
Secondary Research
- Annual Reports
- White Paper
- Latest Press Release
- Industry Association
- Paid Database
- Investor Presentations

Step 4 - Data Triangulation
Involves using different sources of information in order to increase the validity of a study
These sources are likely to be stakeholders in a program - participants, other researchers, program staff, other community members, and so on.
Then we put all data in single framework & apply various statistical tools to find out the dynamic on the market.
During the analysis stage, feedback from the stakeholder groups would be compared to determine areas of agreement as well as areas of divergence
