

Key Insights
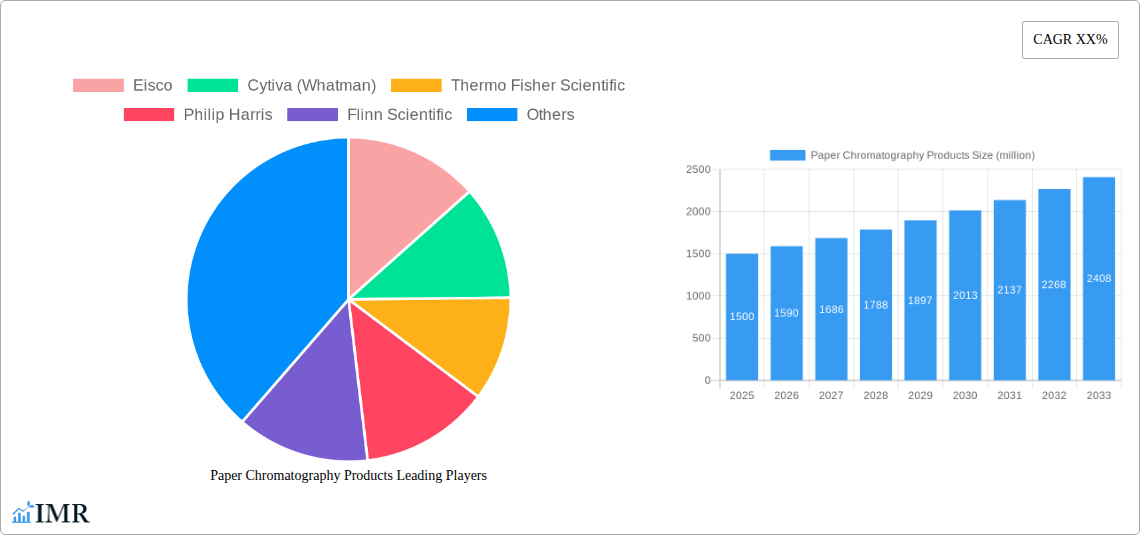
The global paper chromatography products market is experiencing steady growth, driven by increasing applications in educational institutions, research laboratories, and quality control departments across various industries. The market's expansion is fueled by the technique's simplicity, cost-effectiveness compared to more advanced chromatography methods (like HPLC), and its suitability for educational purposes. Key market players such as Eisco, Cytiva (Whatman), Thermo Fisher Scientific, and Agilent Technologies are contributing to this growth through continuous product innovation and expansion of their product portfolios. This includes developing higher-quality filter papers, improved detection reagents, and comprehensive kits tailored for specific applications. However, the market faces certain restraints, such as the emergence of advanced chromatographic techniques offering higher resolution and automation, and the potential for environmental concerns related to certain chemicals used in the process. Despite these challenges, the market is projected to maintain a positive growth trajectory, driven by the enduring need for a cost-effective and easily accessible analytical technique in various sectors.
The market segmentation reveals a strong demand across diverse geographic regions. North America and Europe currently dominate the market share, owing to a higher concentration of research institutions and established industries utilizing paper chromatography. However, developing economies in Asia-Pacific and other regions are exhibiting increasing adoption rates, presenting significant growth opportunities for market players. The continued investment in scientific research, particularly in areas like environmental monitoring, food safety, and pharmaceutical development, further fuels the demand for paper chromatography products. Moreover, the rising awareness regarding the importance of quality control and the need for affordable analytical tools in various sectors is expected to drive market expansion in the coming years. The competitive landscape is characterized by both established players and smaller niche players, creating a dynamic market with diverse product offerings.
Paper Chromatography Products Market Report: 2019-2033
This comprehensive report provides an in-depth analysis of the Paper Chromatography Products market, encompassing market dynamics, growth trends, regional analysis, competitive landscape, and future outlook. The study period spans from 2019 to 2033, with 2025 serving as the base and estimated year. The report leverages extensive primary and secondary research to offer actionable insights for industry professionals, investors, and strategic decision-makers. The market is valued at xx million units in 2025 and is projected to reach xx million units by 2033, exhibiting a CAGR of xx% during the forecast period (2025-2033). This report serves the parent market of analytical laboratory supplies and the child market of chromatography consumables.
Paper Chromatography Products Market Dynamics & Structure
The Paper Chromatography Products market is characterized by moderate concentration, with key players like Thermo Fisher Scientific, Cytiva (Whatman), and Agilent Technologies holding significant market share. Technological innovations, particularly in materials science and automation, are driving market growth. Stringent regulatory frameworks concerning quality control and safety standards influence product development and adoption. Competitive substitutes, such as Thin Layer Chromatography (TLC) and High-Performance Liquid Chromatography (HPLC), exert pressure, necessitating continuous product improvement. The end-user base spans diverse sectors including education, research, pharmaceuticals, and environmental testing. M&A activity in the sector has been relatively low in recent years (xx deals in the historical period), largely driven by consolidation within the broader analytical instruments market.
- Market Concentration: Moderately concentrated, with top 5 players holding approximately xx% market share in 2025.
- Technological Innovation: Focus on improving separation efficiency, sensitivity, and automation.
- Regulatory Landscape: Compliance with international quality and safety standards (e.g., ISO, GLP) is crucial.
- Competitive Substitutes: TLC, HPLC, and other advanced chromatography techniques.
- End-User Demographics: Diverse, encompassing research institutions, educational labs, pharmaceutical companies, and environmental agencies.
- M&A Trends: Low historical activity, primarily driven by strategic acquisitions within the broader analytical instruments market.
Paper Chromatography Products Growth Trends & Insights
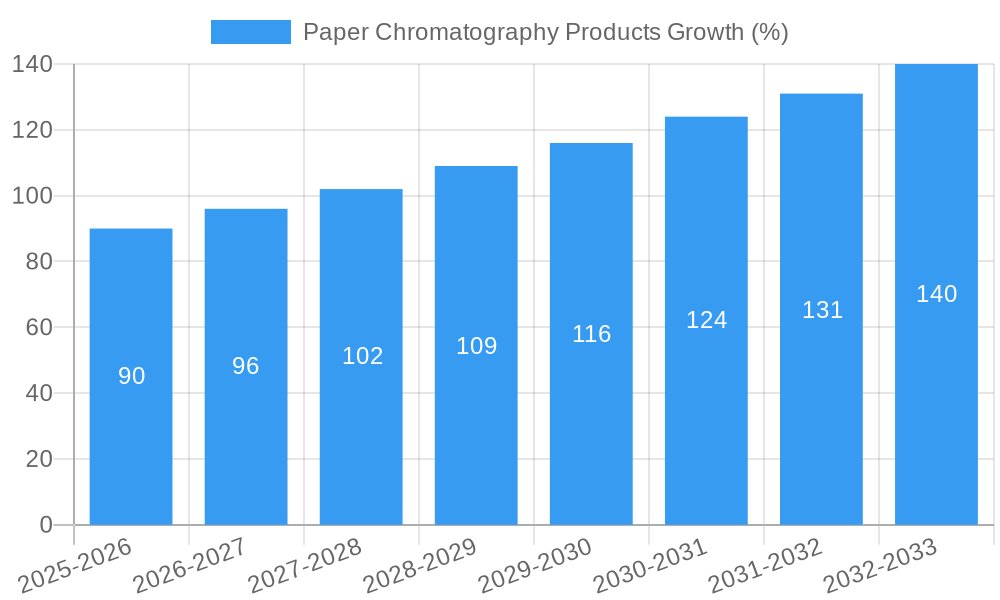
The Paper Chromatography Products market has experienced steady growth throughout the historical period (2019-2024), driven by increasing research activities, advancements in life sciences, and rising demand for cost-effective analytical techniques in emerging economies. Adoption rates have been relatively stable across various end-user segments, although growth has been more pronounced in developing regions due to rising investments in research infrastructure. Technological disruptions, such as the introduction of novel stationary phases and automated systems, are boosting market expansion. Shifting consumer behavior, favoring eco-friendly and user-friendly products, is also influencing market trends. The market size has grown from xx million units in 2019 to xx million units in 2024, representing a CAGR of xx%. Market penetration is estimated at xx% in 2025, with significant untapped potential in developing regions and niche applications.
Dominant Regions, Countries, or Segments in Paper Chromatography Products
North America currently holds the largest market share (xx%) in the Paper Chromatography Products market, driven by strong research funding, a well-established scientific infrastructure, and high adoption rates in academic institutions and pharmaceutical companies. Europe follows closely, contributing xx% of the global market. Asia-Pacific is expected to witness the fastest growth during the forecast period, owing to rapid economic development, expanding healthcare sector, and increasing investments in research and development.
- North America: High adoption rates in research and pharmaceuticals.
- Europe: Strong presence of established players and robust regulatory frameworks.
- Asia-Pacific: Fastest-growing region, driven by expanding research infrastructure and economic growth.
- Key Drivers: Increased government funding for research, growing life sciences sector, rising demand for cost-effective analytical techniques.
Paper Chromatography Products Product Landscape
The Paper Chromatography Products market offers a range of products, including filter paper, chromatography paper, and specialized papers with different functionalities. Innovations focus on enhancing separation efficiency, improving resolution, and reducing analysis time. Applications span diverse fields, including qualitative and quantitative analysis of organic and inorganic compounds, separation of pigments, and drug detection. Key performance indicators include separation efficiency (Rf values), resolution, and reproducibility. Unique selling propositions include enhanced sensitivity, improved spot visualization, and eco-friendly materials. Technological advancements include incorporating novel stationary phases and developing automated systems for high-throughput analysis.
Key Drivers, Barriers & Challenges in Paper Chromatography Products
Key Drivers:
- Rising research and development activities across various sectors.
- Increasing adoption of paper chromatography in educational settings.
- Development of advanced materials and automated systems.
Challenges & Restraints:
- Competition from more advanced chromatography techniques (HPLC, GC).
- Supply chain disruptions impacting raw material availability and pricing.
- Stringent regulatory requirements for quality control and safety. These factors could result in a xx% decrease in market growth by 2030 if not addressed effectively.
Emerging Opportunities in Paper Chromatography Products
- Expanding applications in environmental monitoring and forensic science.
- Development of specialized papers for specific applications (e.g., pharmaceuticals, food safety).
- Integration of paper chromatography with other analytical techniques.
Growth Accelerators in the Paper Chromatography Products Industry
Technological advancements, such as the development of novel stationary phases and high-throughput automation, are key growth catalysts. Strategic partnerships between manufacturers and distributors expand market reach. Expansion into emerging markets with untapped potential offers substantial growth opportunities.
Key Players Shaping the Paper Chromatography Products Market
- Eisco
- Cytiva (Whatman)
- Thermo Fisher Scientific
- Philip Harris
- Flinn Scientific
- Thomas Scientific
- Agilent Technologies
- United Scientific Supplies
- Ahlstrom-Munksjö
- Globe Scientific
- Alfa Aesar
- Hahnemühle FineArt GmbH
- AXIVA SICHEM BIOTECH
Notable Milestones in Paper Chromatography Products Sector
- 2020: Introduction of a new line of eco-friendly chromatography paper by Cytiva.
- 2022: Acquisition of a smaller chromatography paper manufacturer by Thermo Fisher Scientific.
- 2023: Launch of an automated paper chromatography system by Agilent Technologies.
In-Depth Paper Chromatography Products Market Outlook
The Paper Chromatography Products market is poised for continued growth driven by technological innovation, expanding applications, and penetration into emerging markets. Strategic partnerships, focusing on product development and market expansion, will be crucial for maintaining competitiveness. The market's future potential lies in developing specialized papers with enhanced functionalities and integrating paper chromatography with other analytical techniques for comprehensive analysis.
Paper Chromatography Products Segmentation
-
1. Application
- 1.1. Biotechnology Companies
- 1.2. Pharmaceutical Companies
- 1.3. Research Institutions
-
2. Types
- 2.1. Sheets
- 2.2. Rolls
Paper Chromatography Products Segmentation By Geography
-
1. North America
- 1.1. United States
- 1.2. Canada
- 1.3. Mexico
-
2. South America
- 2.1. Brazil
- 2.2. Argentina
- 2.3. Rest of South America
-
3. Europe
- 3.1. United Kingdom
- 3.2. Germany
- 3.3. France
- 3.4. Italy
- 3.5. Spain
- 3.6. Russia
- 3.7. Benelux
- 3.8. Nordics
- 3.9. Rest of Europe
-
4. Middle East & Africa
- 4.1. Turkey
- 4.2. Israel
- 4.3. GCC
- 4.4. North Africa
- 4.5. South Africa
- 4.6. Rest of Middle East & Africa
-
5. Asia Pacific
- 5.1. China
- 5.2. India
- 5.3. Japan
- 5.4. South Korea
- 5.5. ASEAN
- 5.6. Oceania
- 5.7. Rest of Asia Pacific

Paper Chromatography Products REPORT HIGHLIGHTS
| Aspects | Details |
|---|---|
| Study Period | 2019-2033 |
| Base Year | 2024 |
| Estimated Year | 2025 |
| Forecast Period | 2025-2033 |
| Historical Period | 2019-2024 |
| Growth Rate | CAGR of XX% from 2019-2033 |
| Segmentation |
|
Table of Contents
- 1. Introduction
- 1.1. Research Scope
- 1.2. Market Segmentation
- 1.3. Research Methodology
- 1.4. Definitions and Assumptions
- 2. Executive Summary
- 2.1. Introduction
- 3. Market Dynamics
- 3.1. Introduction
- 3.2. Market Drivers
- 3.3. Market Restrains
- 3.4. Market Trends
- 4. Market Factor Analysis
- 4.1. Porters Five Forces
- 4.2. Supply/Value Chain
- 4.3. PESTEL analysis
- 4.4. Market Entropy
- 4.5. Patent/Trademark Analysis
- 5. Global Paper Chromatography Products Analysis, Insights and Forecast, 2019-2031
- 5.1. Market Analysis, Insights and Forecast - by Application
- 5.1.1. Biotechnology Companies
- 5.1.2. Pharmaceutical Companies
- 5.1.3. Research Institutions
- 5.2. Market Analysis, Insights and Forecast - by Types
- 5.2.1. Sheets
- 5.2.2. Rolls
- 5.3. Market Analysis, Insights and Forecast - by Region
- 5.3.1. North America
- 5.3.2. South America
- 5.3.3. Europe
- 5.3.4. Middle East & Africa
- 5.3.5. Asia Pacific
- 5.1. Market Analysis, Insights and Forecast - by Application
- 6. North America Paper Chromatography Products Analysis, Insights and Forecast, 2019-2031
- 6.1. Market Analysis, Insights and Forecast - by Application
- 6.1.1. Biotechnology Companies
- 6.1.2. Pharmaceutical Companies
- 6.1.3. Research Institutions
- 6.2. Market Analysis, Insights and Forecast - by Types
- 6.2.1. Sheets
- 6.2.2. Rolls
- 6.1. Market Analysis, Insights and Forecast - by Application
- 7. South America Paper Chromatography Products Analysis, Insights and Forecast, 2019-2031
- 7.1. Market Analysis, Insights and Forecast - by Application
- 7.1.1. Biotechnology Companies
- 7.1.2. Pharmaceutical Companies
- 7.1.3. Research Institutions
- 7.2. Market Analysis, Insights and Forecast - by Types
- 7.2.1. Sheets
- 7.2.2. Rolls
- 7.1. Market Analysis, Insights and Forecast - by Application
- 8. Europe Paper Chromatography Products Analysis, Insights and Forecast, 2019-2031
- 8.1. Market Analysis, Insights and Forecast - by Application
- 8.1.1. Biotechnology Companies
- 8.1.2. Pharmaceutical Companies
- 8.1.3. Research Institutions
- 8.2. Market Analysis, Insights and Forecast - by Types
- 8.2.1. Sheets
- 8.2.2. Rolls
- 8.1. Market Analysis, Insights and Forecast - by Application
- 9. Middle East & Africa Paper Chromatography Products Analysis, Insights and Forecast, 2019-2031
- 9.1. Market Analysis, Insights and Forecast - by Application
- 9.1.1. Biotechnology Companies
- 9.1.2. Pharmaceutical Companies
- 9.1.3. Research Institutions
- 9.2. Market Analysis, Insights and Forecast - by Types
- 9.2.1. Sheets
- 9.2.2. Rolls
- 9.1. Market Analysis, Insights and Forecast - by Application
- 10. Asia Pacific Paper Chromatography Products Analysis, Insights and Forecast, 2019-2031
- 10.1. Market Analysis, Insights and Forecast - by Application
- 10.1.1. Biotechnology Companies
- 10.1.2. Pharmaceutical Companies
- 10.1.3. Research Institutions
- 10.2. Market Analysis, Insights and Forecast - by Types
- 10.2.1. Sheets
- 10.2.2. Rolls
- 10.1. Market Analysis, Insights and Forecast - by Application
- 11. Competitive Analysis
- 11.1. Global Market Share Analysis 2024
- 11.2. Company Profiles
- 11.2.1 Eisco
- 11.2.1.1. Overview
- 11.2.1.2. Products
- 11.2.1.3. SWOT Analysis
- 11.2.1.4. Recent Developments
- 11.2.1.5. Financials (Based on Availability)
- 11.2.2 Cytiva (Whatman)
- 11.2.2.1. Overview
- 11.2.2.2. Products
- 11.2.2.3. SWOT Analysis
- 11.2.2.4. Recent Developments
- 11.2.2.5. Financials (Based on Availability)
- 11.2.3 Thermo Fisher Scientific
- 11.2.3.1. Overview
- 11.2.3.2. Products
- 11.2.3.3. SWOT Analysis
- 11.2.3.4. Recent Developments
- 11.2.3.5. Financials (Based on Availability)
- 11.2.4 Philip Harris
- 11.2.4.1. Overview
- 11.2.4.2. Products
- 11.2.4.3. SWOT Analysis
- 11.2.4.4. Recent Developments
- 11.2.4.5. Financials (Based on Availability)
- 11.2.5 Flinn Scientific
- 11.2.5.1. Overview
- 11.2.5.2. Products
- 11.2.5.3. SWOT Analysis
- 11.2.5.4. Recent Developments
- 11.2.5.5. Financials (Based on Availability)
- 11.2.6 Thomas Scientific
- 11.2.6.1. Overview
- 11.2.6.2. Products
- 11.2.6.3. SWOT Analysis
- 11.2.6.4. Recent Developments
- 11.2.6.5. Financials (Based on Availability)
- 11.2.7 Agilent Technologies
- 11.2.7.1. Overview
- 11.2.7.2. Products
- 11.2.7.3. SWOT Analysis
- 11.2.7.4. Recent Developments
- 11.2.7.5. Financials (Based on Availability)
- 11.2.8 United Scientific Supplies
- 11.2.8.1. Overview
- 11.2.8.2. Products
- 11.2.8.3. SWOT Analysis
- 11.2.8.4. Recent Developments
- 11.2.8.5. Financials (Based on Availability)
- 11.2.9 Ahlstrom-Munksjö
- 11.2.9.1. Overview
- 11.2.9.2. Products
- 11.2.9.3. SWOT Analysis
- 11.2.9.4. Recent Developments
- 11.2.9.5. Financials (Based on Availability)
- 11.2.10 Globe Scientific
- 11.2.10.1. Overview
- 11.2.10.2. Products
- 11.2.10.3. SWOT Analysis
- 11.2.10.4. Recent Developments
- 11.2.10.5. Financials (Based on Availability)
- 11.2.11 Alfa Aesar
- 11.2.11.1. Overview
- 11.2.11.2. Products
- 11.2.11.3. SWOT Analysis
- 11.2.11.4. Recent Developments
- 11.2.11.5. Financials (Based on Availability)
- 11.2.12 Hahnemühle FineArt GmbH
- 11.2.12.1. Overview
- 11.2.12.2. Products
- 11.2.12.3. SWOT Analysis
- 11.2.12.4. Recent Developments
- 11.2.12.5. Financials (Based on Availability)
- 11.2.13 AXIVA SICHEM BIOTECH
- 11.2.13.1. Overview
- 11.2.13.2. Products
- 11.2.13.3. SWOT Analysis
- 11.2.13.4. Recent Developments
- 11.2.13.5. Financials (Based on Availability)
- 11.2.1 Eisco
List of Figures
- Figure 1: Global Paper Chromatography Products Revenue Breakdown (million, %) by Region 2024 & 2032
- Figure 2: Global Paper Chromatography Products Volume Breakdown (K, %) by Region 2024 & 2032
- Figure 3: North America Paper Chromatography Products Revenue (million), by Application 2024 & 2032
- Figure 4: North America Paper Chromatography Products Volume (K), by Application 2024 & 2032
- Figure 5: North America Paper Chromatography Products Revenue Share (%), by Application 2024 & 2032
- Figure 6: North America Paper Chromatography Products Volume Share (%), by Application 2024 & 2032
- Figure 7: North America Paper Chromatography Products Revenue (million), by Types 2024 & 2032
- Figure 8: North America Paper Chromatography Products Volume (K), by Types 2024 & 2032
- Figure 9: North America Paper Chromatography Products Revenue Share (%), by Types 2024 & 2032
- Figure 10: North America Paper Chromatography Products Volume Share (%), by Types 2024 & 2032
- Figure 11: North America Paper Chromatography Products Revenue (million), by Country 2024 & 2032
- Figure 12: North America Paper Chromatography Products Volume (K), by Country 2024 & 2032
- Figure 13: North America Paper Chromatography Products Revenue Share (%), by Country 2024 & 2032
- Figure 14: North America Paper Chromatography Products Volume Share (%), by Country 2024 & 2032
- Figure 15: South America Paper Chromatography Products Revenue (million), by Application 2024 & 2032
- Figure 16: South America Paper Chromatography Products Volume (K), by Application 2024 & 2032
- Figure 17: South America Paper Chromatography Products Revenue Share (%), by Application 2024 & 2032
- Figure 18: South America Paper Chromatography Products Volume Share (%), by Application 2024 & 2032
- Figure 19: South America Paper Chromatography Products Revenue (million), by Types 2024 & 2032
- Figure 20: South America Paper Chromatography Products Volume (K), by Types 2024 & 2032
- Figure 21: South America Paper Chromatography Products Revenue Share (%), by Types 2024 & 2032
- Figure 22: South America Paper Chromatography Products Volume Share (%), by Types 2024 & 2032
- Figure 23: South America Paper Chromatography Products Revenue (million), by Country 2024 & 2032
- Figure 24: South America Paper Chromatography Products Volume (K), by Country 2024 & 2032
- Figure 25: South America Paper Chromatography Products Revenue Share (%), by Country 2024 & 2032
- Figure 26: South America Paper Chromatography Products Volume Share (%), by Country 2024 & 2032
- Figure 27: Europe Paper Chromatography Products Revenue (million), by Application 2024 & 2032
- Figure 28: Europe Paper Chromatography Products Volume (K), by Application 2024 & 2032
- Figure 29: Europe Paper Chromatography Products Revenue Share (%), by Application 2024 & 2032
- Figure 30: Europe Paper Chromatography Products Volume Share (%), by Application 2024 & 2032
- Figure 31: Europe Paper Chromatography Products Revenue (million), by Types 2024 & 2032
- Figure 32: Europe Paper Chromatography Products Volume (K), by Types 2024 & 2032
- Figure 33: Europe Paper Chromatography Products Revenue Share (%), by Types 2024 & 2032
- Figure 34: Europe Paper Chromatography Products Volume Share (%), by Types 2024 & 2032
- Figure 35: Europe Paper Chromatography Products Revenue (million), by Country 2024 & 2032
- Figure 36: Europe Paper Chromatography Products Volume (K), by Country 2024 & 2032
- Figure 37: Europe Paper Chromatography Products Revenue Share (%), by Country 2024 & 2032
- Figure 38: Europe Paper Chromatography Products Volume Share (%), by Country 2024 & 2032
- Figure 39: Middle East & Africa Paper Chromatography Products Revenue (million), by Application 2024 & 2032
- Figure 40: Middle East & Africa Paper Chromatography Products Volume (K), by Application 2024 & 2032
- Figure 41: Middle East & Africa Paper Chromatography Products Revenue Share (%), by Application 2024 & 2032
- Figure 42: Middle East & Africa Paper Chromatography Products Volume Share (%), by Application 2024 & 2032
- Figure 43: Middle East & Africa Paper Chromatography Products Revenue (million), by Types 2024 & 2032
- Figure 44: Middle East & Africa Paper Chromatography Products Volume (K), by Types 2024 & 2032
- Figure 45: Middle East & Africa Paper Chromatography Products Revenue Share (%), by Types 2024 & 2032
- Figure 46: Middle East & Africa Paper Chromatography Products Volume Share (%), by Types 2024 & 2032
- Figure 47: Middle East & Africa Paper Chromatography Products Revenue (million), by Country 2024 & 2032
- Figure 48: Middle East & Africa Paper Chromatography Products Volume (K), by Country 2024 & 2032
- Figure 49: Middle East & Africa Paper Chromatography Products Revenue Share (%), by Country 2024 & 2032
- Figure 50: Middle East & Africa Paper Chromatography Products Volume Share (%), by Country 2024 & 2032
- Figure 51: Asia Pacific Paper Chromatography Products Revenue (million), by Application 2024 & 2032
- Figure 52: Asia Pacific Paper Chromatography Products Volume (K), by Application 2024 & 2032
- Figure 53: Asia Pacific Paper Chromatography Products Revenue Share (%), by Application 2024 & 2032
- Figure 54: Asia Pacific Paper Chromatography Products Volume Share (%), by Application 2024 & 2032
- Figure 55: Asia Pacific Paper Chromatography Products Revenue (million), by Types 2024 & 2032
- Figure 56: Asia Pacific Paper Chromatography Products Volume (K), by Types 2024 & 2032
- Figure 57: Asia Pacific Paper Chromatography Products Revenue Share (%), by Types 2024 & 2032
- Figure 58: Asia Pacific Paper Chromatography Products Volume Share (%), by Types 2024 & 2032
- Figure 59: Asia Pacific Paper Chromatography Products Revenue (million), by Country 2024 & 2032
- Figure 60: Asia Pacific Paper Chromatography Products Volume (K), by Country 2024 & 2032
- Figure 61: Asia Pacific Paper Chromatography Products Revenue Share (%), by Country 2024 & 2032
- Figure 62: Asia Pacific Paper Chromatography Products Volume Share (%), by Country 2024 & 2032
List of Tables
- Table 1: Global Paper Chromatography Products Revenue million Forecast, by Region 2019 & 2032
- Table 2: Global Paper Chromatography Products Volume K Forecast, by Region 2019 & 2032
- Table 3: Global Paper Chromatography Products Revenue million Forecast, by Application 2019 & 2032
- Table 4: Global Paper Chromatography Products Volume K Forecast, by Application 2019 & 2032
- Table 5: Global Paper Chromatography Products Revenue million Forecast, by Types 2019 & 2032
- Table 6: Global Paper Chromatography Products Volume K Forecast, by Types 2019 & 2032
- Table 7: Global Paper Chromatography Products Revenue million Forecast, by Region 2019 & 2032
- Table 8: Global Paper Chromatography Products Volume K Forecast, by Region 2019 & 2032
- Table 9: Global Paper Chromatography Products Revenue million Forecast, by Application 2019 & 2032
- Table 10: Global Paper Chromatography Products Volume K Forecast, by Application 2019 & 2032
- Table 11: Global Paper Chromatography Products Revenue million Forecast, by Types 2019 & 2032
- Table 12: Global Paper Chromatography Products Volume K Forecast, by Types 2019 & 2032
- Table 13: Global Paper Chromatography Products Revenue million Forecast, by Country 2019 & 2032
- Table 14: Global Paper Chromatography Products Volume K Forecast, by Country 2019 & 2032
- Table 15: United States Paper Chromatography Products Revenue (million) Forecast, by Application 2019 & 2032
- Table 16: United States Paper Chromatography Products Volume (K) Forecast, by Application 2019 & 2032
- Table 17: Canada Paper Chromatography Products Revenue (million) Forecast, by Application 2019 & 2032
- Table 18: Canada Paper Chromatography Products Volume (K) Forecast, by Application 2019 & 2032
- Table 19: Mexico Paper Chromatography Products Revenue (million) Forecast, by Application 2019 & 2032
- Table 20: Mexico Paper Chromatography Products Volume (K) Forecast, by Application 2019 & 2032
- Table 21: Global Paper Chromatography Products Revenue million Forecast, by Application 2019 & 2032
- Table 22: Global Paper Chromatography Products Volume K Forecast, by Application 2019 & 2032
- Table 23: Global Paper Chromatography Products Revenue million Forecast, by Types 2019 & 2032
- Table 24: Global Paper Chromatography Products Volume K Forecast, by Types 2019 & 2032
- Table 25: Global Paper Chromatography Products Revenue million Forecast, by Country 2019 & 2032
- Table 26: Global Paper Chromatography Products Volume K Forecast, by Country 2019 & 2032
- Table 27: Brazil Paper Chromatography Products Revenue (million) Forecast, by Application 2019 & 2032
- Table 28: Brazil Paper Chromatography Products Volume (K) Forecast, by Application 2019 & 2032
- Table 29: Argentina Paper Chromatography Products Revenue (million) Forecast, by Application 2019 & 2032
- Table 30: Argentina Paper Chromatography Products Volume (K) Forecast, by Application 2019 & 2032
- Table 31: Rest of South America Paper Chromatography Products Revenue (million) Forecast, by Application 2019 & 2032
- Table 32: Rest of South America Paper Chromatography Products Volume (K) Forecast, by Application 2019 & 2032
- Table 33: Global Paper Chromatography Products Revenue million Forecast, by Application 2019 & 2032
- Table 34: Global Paper Chromatography Products Volume K Forecast, by Application 2019 & 2032
- Table 35: Global Paper Chromatography Products Revenue million Forecast, by Types 2019 & 2032
- Table 36: Global Paper Chromatography Products Volume K Forecast, by Types 2019 & 2032
- Table 37: Global Paper Chromatography Products Revenue million Forecast, by Country 2019 & 2032
- Table 38: Global Paper Chromatography Products Volume K Forecast, by Country 2019 & 2032
- Table 39: United Kingdom Paper Chromatography Products Revenue (million) Forecast, by Application 2019 & 2032
- Table 40: United Kingdom Paper Chromatography Products Volume (K) Forecast, by Application 2019 & 2032
- Table 41: Germany Paper Chromatography Products Revenue (million) Forecast, by Application 2019 & 2032
- Table 42: Germany Paper Chromatography Products Volume (K) Forecast, by Application 2019 & 2032
- Table 43: France Paper Chromatography Products Revenue (million) Forecast, by Application 2019 & 2032
- Table 44: France Paper Chromatography Products Volume (K) Forecast, by Application 2019 & 2032
- Table 45: Italy Paper Chromatography Products Revenue (million) Forecast, by Application 2019 & 2032
- Table 46: Italy Paper Chromatography Products Volume (K) Forecast, by Application 2019 & 2032
- Table 47: Spain Paper Chromatography Products Revenue (million) Forecast, by Application 2019 & 2032
- Table 48: Spain Paper Chromatography Products Volume (K) Forecast, by Application 2019 & 2032
- Table 49: Russia Paper Chromatography Products Revenue (million) Forecast, by Application 2019 & 2032
- Table 50: Russia Paper Chromatography Products Volume (K) Forecast, by Application 2019 & 2032
- Table 51: Benelux Paper Chromatography Products Revenue (million) Forecast, by Application 2019 & 2032
- Table 52: Benelux Paper Chromatography Products Volume (K) Forecast, by Application 2019 & 2032
- Table 53: Nordics Paper Chromatography Products Revenue (million) Forecast, by Application 2019 & 2032
- Table 54: Nordics Paper Chromatography Products Volume (K) Forecast, by Application 2019 & 2032
- Table 55: Rest of Europe Paper Chromatography Products Revenue (million) Forecast, by Application 2019 & 2032
- Table 56: Rest of Europe Paper Chromatography Products Volume (K) Forecast, by Application 2019 & 2032
- Table 57: Global Paper Chromatography Products Revenue million Forecast, by Application 2019 & 2032
- Table 58: Global Paper Chromatography Products Volume K Forecast, by Application 2019 & 2032
- Table 59: Global Paper Chromatography Products Revenue million Forecast, by Types 2019 & 2032
- Table 60: Global Paper Chromatography Products Volume K Forecast, by Types 2019 & 2032
- Table 61: Global Paper Chromatography Products Revenue million Forecast, by Country 2019 & 2032
- Table 62: Global Paper Chromatography Products Volume K Forecast, by Country 2019 & 2032
- Table 63: Turkey Paper Chromatography Products Revenue (million) Forecast, by Application 2019 & 2032
- Table 64: Turkey Paper Chromatography Products Volume (K) Forecast, by Application 2019 & 2032
- Table 65: Israel Paper Chromatography Products Revenue (million) Forecast, by Application 2019 & 2032
- Table 66: Israel Paper Chromatography Products Volume (K) Forecast, by Application 2019 & 2032
- Table 67: GCC Paper Chromatography Products Revenue (million) Forecast, by Application 2019 & 2032
- Table 68: GCC Paper Chromatography Products Volume (K) Forecast, by Application 2019 & 2032
- Table 69: North Africa Paper Chromatography Products Revenue (million) Forecast, by Application 2019 & 2032
- Table 70: North Africa Paper Chromatography Products Volume (K) Forecast, by Application 2019 & 2032
- Table 71: South Africa Paper Chromatography Products Revenue (million) Forecast, by Application 2019 & 2032
- Table 72: South Africa Paper Chromatography Products Volume (K) Forecast, by Application 2019 & 2032
- Table 73: Rest of Middle East & Africa Paper Chromatography Products Revenue (million) Forecast, by Application 2019 & 2032
- Table 74: Rest of Middle East & Africa Paper Chromatography Products Volume (K) Forecast, by Application 2019 & 2032
- Table 75: Global Paper Chromatography Products Revenue million Forecast, by Application 2019 & 2032
- Table 76: Global Paper Chromatography Products Volume K Forecast, by Application 2019 & 2032
- Table 77: Global Paper Chromatography Products Revenue million Forecast, by Types 2019 & 2032
- Table 78: Global Paper Chromatography Products Volume K Forecast, by Types 2019 & 2032
- Table 79: Global Paper Chromatography Products Revenue million Forecast, by Country 2019 & 2032
- Table 80: Global Paper Chromatography Products Volume K Forecast, by Country 2019 & 2032
- Table 81: China Paper Chromatography Products Revenue (million) Forecast, by Application 2019 & 2032
- Table 82: China Paper Chromatography Products Volume (K) Forecast, by Application 2019 & 2032
- Table 83: India Paper Chromatography Products Revenue (million) Forecast, by Application 2019 & 2032
- Table 84: India Paper Chromatography Products Volume (K) Forecast, by Application 2019 & 2032
- Table 85: Japan Paper Chromatography Products Revenue (million) Forecast, by Application 2019 & 2032
- Table 86: Japan Paper Chromatography Products Volume (K) Forecast, by Application 2019 & 2032
- Table 87: South Korea Paper Chromatography Products Revenue (million) Forecast, by Application 2019 & 2032
- Table 88: South Korea Paper Chromatography Products Volume (K) Forecast, by Application 2019 & 2032
- Table 89: ASEAN Paper Chromatography Products Revenue (million) Forecast, by Application 2019 & 2032
- Table 90: ASEAN Paper Chromatography Products Volume (K) Forecast, by Application 2019 & 2032
- Table 91: Oceania Paper Chromatography Products Revenue (million) Forecast, by Application 2019 & 2032
- Table 92: Oceania Paper Chromatography Products Volume (K) Forecast, by Application 2019 & 2032
- Table 93: Rest of Asia Pacific Paper Chromatography Products Revenue (million) Forecast, by Application 2019 & 2032
- Table 94: Rest of Asia Pacific Paper Chromatography Products Volume (K) Forecast, by Application 2019 & 2032
Frequently Asked Questions
1. What is the projected Compound Annual Growth Rate (CAGR) of the Paper Chromatography Products?
The projected CAGR is approximately XX%.
2. Which companies are prominent players in the Paper Chromatography Products?
Key companies in the market include Eisco, Cytiva (Whatman), Thermo Fisher Scientific, Philip Harris, Flinn Scientific, Thomas Scientific, Agilent Technologies, United Scientific Supplies, Ahlstrom-Munksjö, Globe Scientific, Alfa Aesar, Hahnemühle FineArt GmbH, AXIVA SICHEM BIOTECH.
3. What are the main segments of the Paper Chromatography Products?
The market segments include Application, Types.
4. Can you provide details about the market size?
The market size is estimated to be USD XXX million as of 2022.
5. What are some drivers contributing to market growth?
N/A
6. What are the notable trends driving market growth?
N/A
7. Are there any restraints impacting market growth?
N/A
8. Can you provide examples of recent developments in the market?
N/A
9. What pricing options are available for accessing the report?
Pricing options include single-user, multi-user, and enterprise licenses priced at USD 4350.00, USD 6525.00, and USD 8700.00 respectively.
10. Is the market size provided in terms of value or volume?
The market size is provided in terms of value, measured in million and volume, measured in K.
11. Are there any specific market keywords associated with the report?
Yes, the market keyword associated with the report is "Paper Chromatography Products," which aids in identifying and referencing the specific market segment covered.
12. How do I determine which pricing option suits my needs best?
The pricing options vary based on user requirements and access needs. Individual users may opt for single-user licenses, while businesses requiring broader access may choose multi-user or enterprise licenses for cost-effective access to the report.
13. Are there any additional resources or data provided in the Paper Chromatography Products report?
While the report offers comprehensive insights, it's advisable to review the specific contents or supplementary materials provided to ascertain if additional resources or data are available.
14. How can I stay updated on further developments or reports in the Paper Chromatography Products?
To stay informed about further developments, trends, and reports in the Paper Chromatography Products, consider subscribing to industry newsletters, following relevant companies and organizations, or regularly checking reputable industry news sources and publications.
Methodology
Step 1 - Identification of Relevant Samples Size from Population Database


Step 2 - Approaches for Defining Global Market Size (Value, Volume* & Price*)

Note*: In applicable scenarios
Step 3 - Data Sources
Primary Research
- Web Analytics
- Survey Reports
- Research Institute
- Latest Research Reports
- Opinion Leaders
Secondary Research
- Annual Reports
- White Paper
- Latest Press Release
- Industry Association
- Paid Database
- Investor Presentations

Step 4 - Data Triangulation
Involves using different sources of information in order to increase the validity of a study
These sources are likely to be stakeholders in a program - participants, other researchers, program staff, other community members, and so on.
Then we put all data in single framework & apply various statistical tools to find out the dynamic on the market.
During the analysis stage, feedback from the stakeholder groups would be compared to determine areas of agreement as well as areas of divergence
