

Key Insights
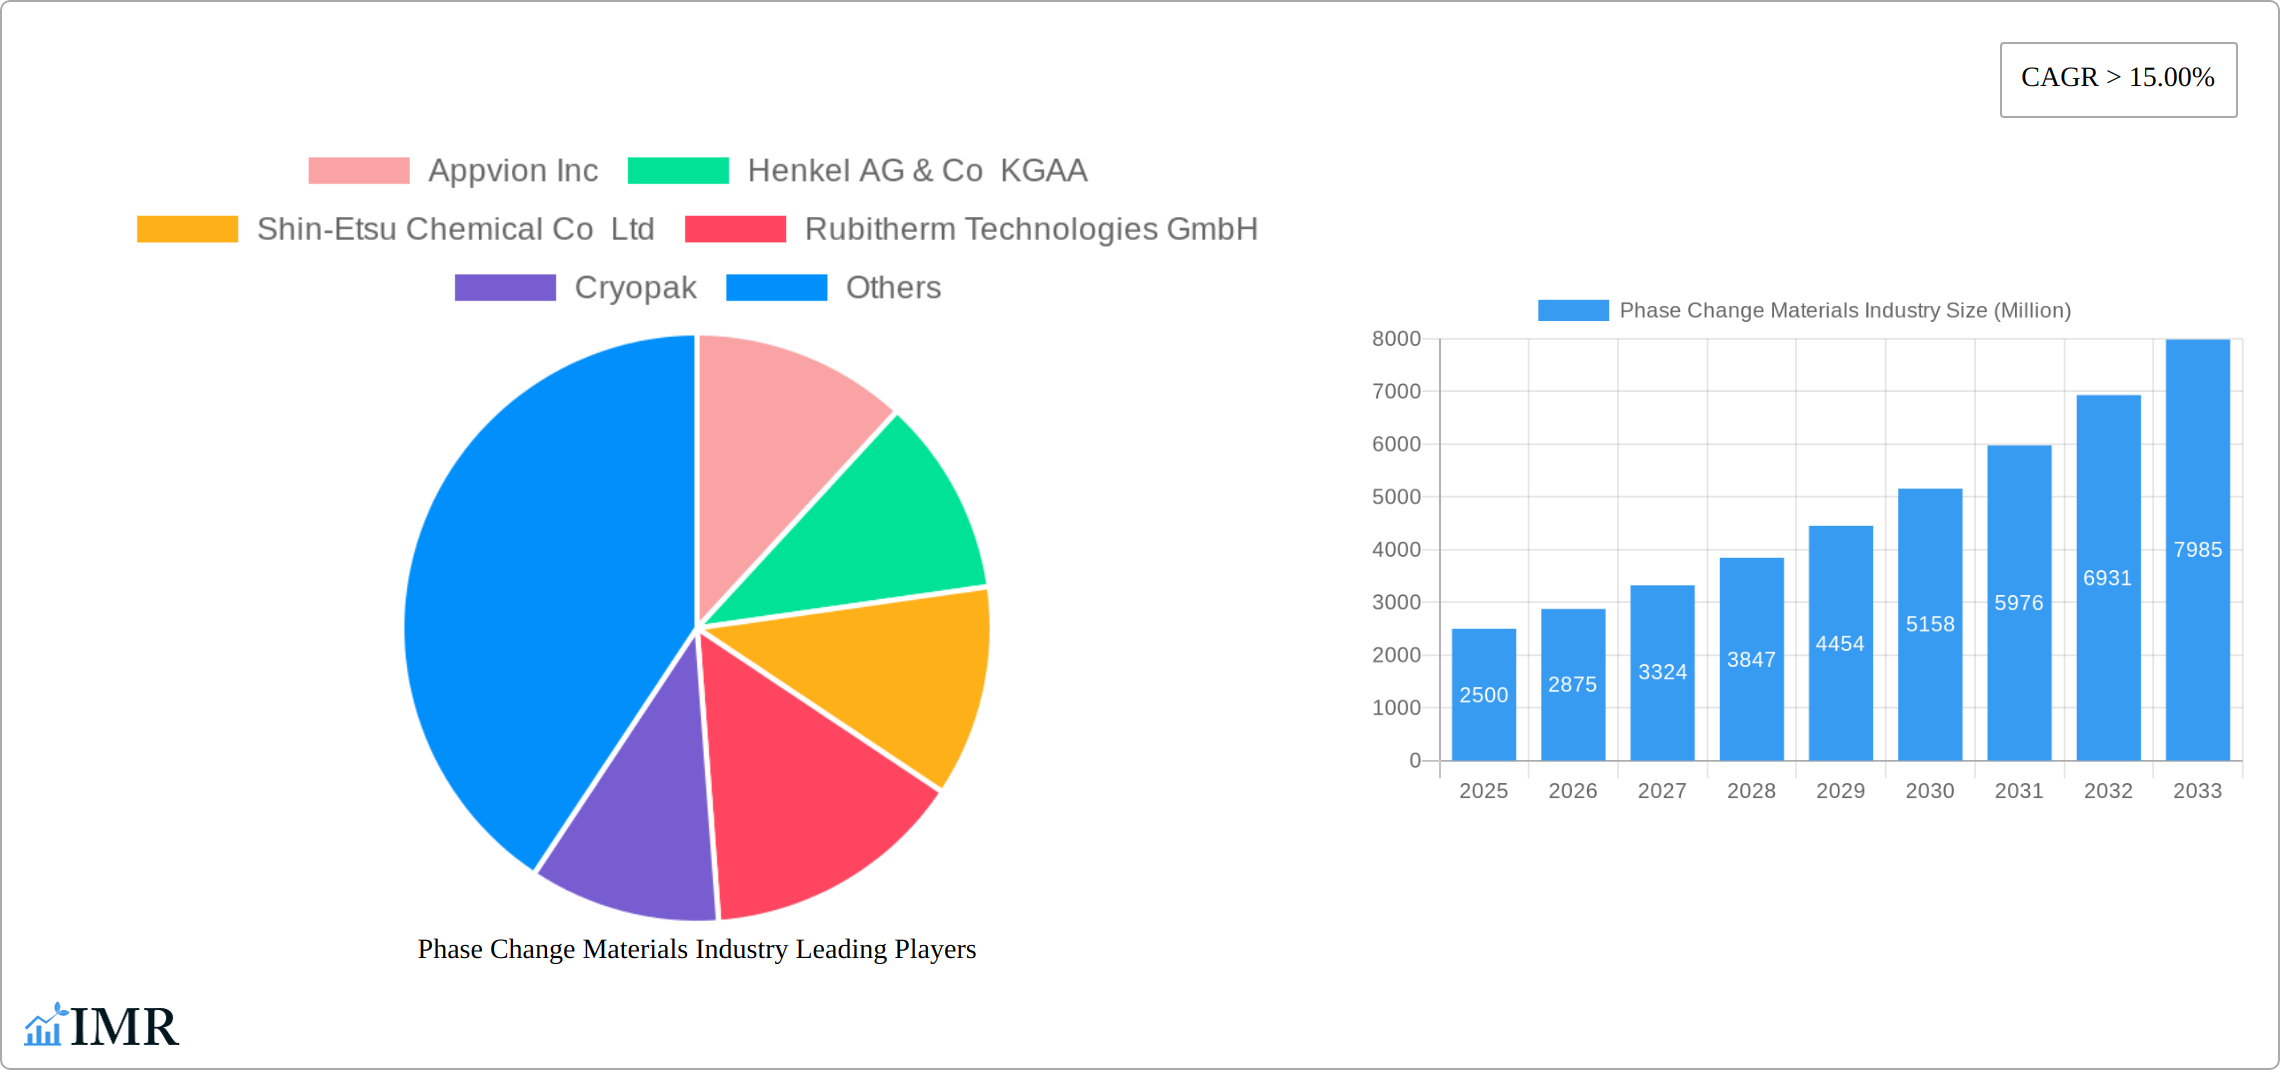
The Phase Change Materials (PCM) market is experiencing robust growth, driven by increasing demand across diverse sectors. The market, valued at approximately $XX million in 2025, is projected to exhibit a Compound Annual Growth Rate (CAGR) exceeding 15% from 2025 to 2033. This expansion is fueled by several key factors. Firstly, the escalating need for efficient thermal management solutions in electronics, particularly in data centers and portable devices, is a major driver. Secondly, the construction industry's adoption of PCMs for improved building insulation and energy efficiency contributes significantly to market growth. The rising focus on sustainable and energy-saving technologies further bolsters this trend. Finally, the development of innovative PCM formulations, encompassing organic, inorganic, and bio-based materials with advanced encapsulation technologies (macro, micro, and molecular), caters to a wider range of applications and enhances market penetration. Segmentation by product type, encapsulation technology, and end-user industry highlights the market's multifaceted nature, with building and construction, packaging, and electronics emerging as leading sectors.
While the market presents promising opportunities, certain challenges exist. The relatively high initial investment costs associated with PCM integration can act as a restraint, particularly for smaller businesses. Furthermore, the long-term stability and durability of some PCMs under varying conditions remain an area of ongoing research and development. However, ongoing technological advancements and increasing awareness of the environmental and economic benefits associated with PCMs are expected to mitigate these challenges and propel the market towards sustained growth. Key players like Appvion Inc., Henkel AG & Co KGaA, and Shin-Etsu Chemical Co. Ltd. are actively contributing to this growth through innovation and expansion into new markets. The geographical distribution of the market reveals strong growth potential in regions such as Asia Pacific, driven by rapid industrialization and urbanization, and North America, spurred by stringent energy efficiency regulations.
Phase Change Materials (PCM) Industry Market Report: 2019-2033
This comprehensive report provides an in-depth analysis of the Phase Change Materials (PCM) industry, encompassing market dynamics, growth trends, regional dominance, product landscape, key players, and future outlook. The study period covers 2019-2033, with 2025 as the base and estimated year. The report is designed for industry professionals, investors, and researchers seeking a detailed understanding of this evolving market. The total market value in 2025 is estimated at xx Million.
Phase Change Materials Industry Market Dynamics & Structure
The PCM market is characterized by moderate concentration, with several key players dominating specific segments. Technological innovation, particularly in encapsulation techniques and novel PCM materials, is a significant driver. Regulatory frameworks focusing on energy efficiency and sustainability are increasingly impacting market growth. Competitive substitutes, such as traditional insulation materials, pose a challenge, while the increasing demand for energy-efficient solutions across diverse end-user industries presents significant opportunities. M&A activity has been moderate, with a focus on expanding product portfolios and geographical reach. The historical period (2019-2024) saw an estimated xx Million increase in market value, projecting a significant growth trajectory for the forecast period (2025-2033).
- Market Concentration: Moderately concentrated, with top 5 players holding approximately xx% market share in 2025.
- Technological Innovation: Focus on improving thermal properties, durability, and cost-effectiveness of PCMs.
- Regulatory Landscape: Government incentives for energy efficiency and sustainable building practices are boosting demand.
- Competitive Substitutes: Traditional insulation materials and other thermal management solutions.
- M&A Activity: xx deals recorded between 2019-2024, primarily focused on horizontal and vertical integration.
- End-User Demographics: Growing demand from building & construction, electronics, and transportation sectors.
Phase Change Materials Industry Growth Trends & Insights
The PCM market is experiencing robust growth, driven by the escalating global demand for energy-efficient and sustainable solutions across diverse sectors. Market projections indicate a significant expansion, reaching [Insert Updated Market Size in Millions] by 2033, demonstrating a robust Compound Annual Growth Rate (CAGR) of [Insert Updated CAGR Percentage] during the forecast period. This growth is fueled by several key factors. Adoption is particularly strong in developed nations with stringent energy regulations, but developing economies are also showing increased interest due to rising energy costs and a growing awareness of environmental sustainability. Technological advancements are playing a crucial role, with innovations such as bio-based PCMs and enhanced encapsulation methods significantly improving performance and expanding application possibilities. The rising consumer preference for eco-friendly and energy-efficient products further accelerates market expansion. Key sectors driving this growth include building and construction, electronics, and packaging, with emerging opportunities in areas like transportation and textiles.
Dominant Regions, Countries, or Segments in Phase Change Materials Industry
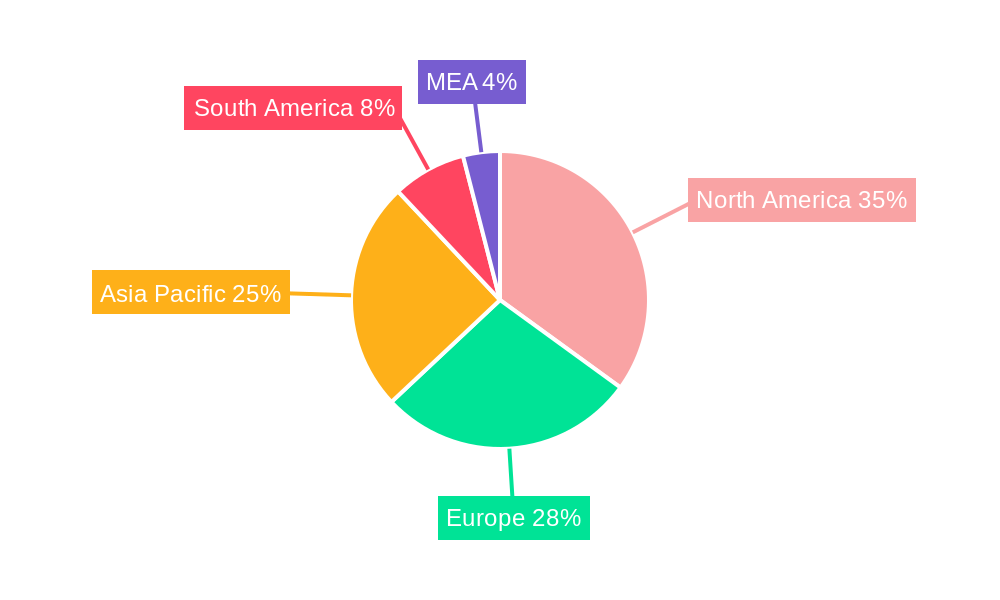
North America and Europe currently dominate the PCM market, driven by robust regulatory frameworks and high adoption rates in energy-efficient building and transportation sectors. However, Asia-Pacific is projected to witness the fastest growth, fueled by rapid industrialization and urbanization. Within product types, organic PCMs hold the largest market share, followed by inorganic PCMs. Micro-encapsulation is the dominant encapsulation technology due to its versatility and performance advantages. The building and construction sector represents the largest end-user segment, followed by the packaging and electronics industries.
- Leading Region: North America (xx% market share in 2025)
- Fastest Growing Region: Asia-Pacific (xx% CAGR during 2025-2033)
- Dominant Product Type: Organic PCMs (xx% market share in 2025)
- Dominant Encapsulation Technology: Micro-encapsulation (xx% market share in 2025)
- Largest End-User Segment: Building & Construction (xx% market share in 2025)
Phase Change Materials Industry Product Landscape
The PCM market offers a diverse range of products, including organic, inorganic, and bio-based materials with varying encapsulation technologies (macro, micro, molecular). Product innovations focus on enhancing thermal performance, durability, and cost-effectiveness. Unique selling propositions include improved energy efficiency, temperature regulation, and sustainability benefits. Advancements in nano-encapsulation and the development of novel PCM materials are shaping the product landscape.
Key Drivers, Barriers & Challenges in Phase Change Materials Industry
Key Drivers:
- The burgeoning global demand for energy-efficient buildings and transportation systems, pushing for sustainable construction and vehicle design.
- Stringent environmental regulations worldwide incentivize the adoption of sustainable technologies, making PCMs a compelling solution.
- Continuous advancements in PCM technology resulting in improved performance, increased cost-effectiveness, and expanded application versatility.
- Heightened consumer awareness regarding energy efficiency and environmental sustainability, driving demand for eco-friendly products.
- Government incentives and subsidies promoting the adoption of energy-efficient technologies.
Challenges & Restraints:
- High upfront capital expenditure associated with the integration of PCMs into existing systems or new designs.
- Potential long-term durability concerns with certain PCM types, requiring further research into material stability and longevity.
- Limited awareness and understanding of PCM technology among potential users necessitate targeted educational campaigns and industry outreach.
- Supply chain vulnerabilities and disruptions impacting the availability and price of raw materials. For instance, the industry experienced a [Insert Updated Percentage]% price increase for specific PCM types in 2024 due to [Specify reason for price increase, e.g., raw material shortages, geopolitical factors].
- Competition from alternative thermal management solutions.
Emerging Opportunities in Phase Change Materials Industry
- Significant expansion potential in emerging markets (e.g., Africa, Southeast Asia, and Latin America) due to rapid urbanization and infrastructure development.
- Development of high-performance PCMs tailored for specialized applications in sectors like aerospace, healthcare, and electronics demanding extreme thermal stability and precision.
- Seamless integration of PCMs with smart building technologies and the Internet of Things (IoT) to optimize energy efficiency and create intelligent thermal management systems.
- Growing demand for bio-based and sustainable PCMs aligns with the broader trend towards environmentally responsible manufacturing and consumption.
- Exploration of new PCM applications in areas such as thermal energy storage for renewable energy integration.
Growth Accelerators in the Phase Change Materials Industry
Technological breakthroughs in material science and encapsulation techniques, coupled with strategic partnerships between PCM manufacturers and end-user industries, are poised to drive long-term growth. Market expansion strategies targeting emerging economies and untapped applications will further accelerate market expansion. Government support for energy-efficient technologies is crucial for sustaining this growth.
Key Players Shaping the Phase Change Materials Industry Market
- Appvion Inc
- Henkel AG & Co KGaA
- Shin-Etsu Chemical Co Ltd
- Rubitherm Technologies GmbH
- Cryopak
- Microtek Laboratories Inc
- Croda International Plc
- Outlast Technologies LLC
- Entropy Solution
- Shenzhen Aochuan Technology Co Ltd
- Laird Technologies
- National Gypsum Services Company
- Parker Hannifin Corp
- [Add other key players if available]
Notable Milestones in Phase Change Materials Industry Sector
- September 2022: Sinomax USA launched Bio Frost, the first bio-based phase change material in foam bedding, highlighting the growing emphasis on sustainability and affordability in the PCM market.
- October 2022: Researchers at Shanghai Polytechnic University unveiled a novel, highly efficient phase change microcapsule designed for solar energy storage, demonstrating significant advancements in heat transfer and storage capabilities.
- [Add other recent milestones and achievements. Include details like company name, product launched, or research breakthroughs.]
In-Depth Phase Change Materials Industry Market Outlook
The PCM market is poised for significant growth, driven by technological innovation, increasing demand for energy-efficient solutions, and supportive government policies. Strategic partnerships and market expansion into emerging economies will be key factors in realizing the market’s full potential. The focus on sustainability and the development of bio-based PCMs will further contribute to long-term market expansion.
Phase Change Materials Industry Segmentation
-
1. Product Type
- 1.1. Organic
- 1.2. Inorganic
- 1.3. Bio-based
-
2. Encapsulation Technology
- 2.1. Macro
- 2.2. Micro
- 2.3. Molecular
-
3. End-user Industry
- 3.1. Building and Construction
- 3.2. Packaging
- 3.3. Textiles
- 3.4. Electronics
- 3.5. Transportation
- 3.6. Other End-user Industries
Phase Change Materials Industry Segmentation By Geography
-
1. Asia Pacific
- 1.1. China
- 1.2. India
- 1.3. Japan
- 1.4. South Korea
- 1.5. Rest of Asia Pacific
-
2. North America
- 2.1. United States
- 2.2. Canada
- 2.3. Mexico
-
3. Europe
- 3.1. Germany
- 3.2. United Kingdom
- 3.3. Italy
- 3.4. France
- 3.5. Rest of Europe
-
4. Rest of the World
- 4.1. Brazil
- 4.2. Saudi Arabia
- 4.3. South Africa
- 4.4. Other Countries
Phase Change Materials Industry REPORT HIGHLIGHTS
| Aspects | Details |
|---|---|
| Study Period | 2019-2033 |
| Base Year | 2024 |
| Estimated Year | 2025 |
| Forecast Period | 2025-2033 |
| Historical Period | 2019-2024 |
| Growth Rate | CAGR of > 15.00% from 2019-2033 |
| Segmentation |
|
Table of Contents
- 1. Introduction
- 1.1. Research Scope
- 1.2. Market Segmentation
- 1.3. Research Methodology
- 1.4. Definitions and Assumptions
- 2. Executive Summary
- 2.1. Introduction
- 3. Market Dynamics
- 3.1. Introduction
- 3.2. Market Drivers
- 3.2.1. Expanding Global Trend Towards Energy Conservation and Sustainable Development; Other Drivers
- 3.3. Market Restrains
- 3.3.1. Hazardous Nature of Phase Change Materials; Other Restraints
- 3.4. Market Trends
- 3.4.1. Building and Construction Industry to Dominate the Market
- 4. Market Factor Analysis
- 4.1. Porters Five Forces
- 4.2. Supply/Value Chain
- 4.3. PESTEL analysis
- 4.4. Market Entropy
- 4.5. Patent/Trademark Analysis
- 5. Global Phase Change Materials Industry Analysis, Insights and Forecast, 2019-2031
- 5.1. Market Analysis, Insights and Forecast - by Product Type
- 5.1.1. Organic
- 5.1.2. Inorganic
- 5.1.3. Bio-based
- 5.2. Market Analysis, Insights and Forecast - by Encapsulation Technology
- 5.2.1. Macro
- 5.2.2. Micro
- 5.2.3. Molecular
- 5.3. Market Analysis, Insights and Forecast - by End-user Industry
- 5.3.1. Building and Construction
- 5.3.2. Packaging
- 5.3.3. Textiles
- 5.3.4. Electronics
- 5.3.5. Transportation
- 5.3.6. Other End-user Industries
- 5.4. Market Analysis, Insights and Forecast - by Region
- 5.4.1. Asia Pacific
- 5.4.2. North America
- 5.4.3. Europe
- 5.4.4. Rest of the World
- 5.1. Market Analysis, Insights and Forecast - by Product Type
- 6. Asia Pacific Phase Change Materials Industry Analysis, Insights and Forecast, 2019-2031
- 6.1. Market Analysis, Insights and Forecast - by Product Type
- 6.1.1. Organic
- 6.1.2. Inorganic
- 6.1.3. Bio-based
- 6.2. Market Analysis, Insights and Forecast - by Encapsulation Technology
- 6.2.1. Macro
- 6.2.2. Micro
- 6.2.3. Molecular
- 6.3. Market Analysis, Insights and Forecast - by End-user Industry
- 6.3.1. Building and Construction
- 6.3.2. Packaging
- 6.3.3. Textiles
- 6.3.4. Electronics
- 6.3.5. Transportation
- 6.3.6. Other End-user Industries
- 6.1. Market Analysis, Insights and Forecast - by Product Type
- 7. North America Phase Change Materials Industry Analysis, Insights and Forecast, 2019-2031
- 7.1. Market Analysis, Insights and Forecast - by Product Type
- 7.1.1. Organic
- 7.1.2. Inorganic
- 7.1.3. Bio-based
- 7.2. Market Analysis, Insights and Forecast - by Encapsulation Technology
- 7.2.1. Macro
- 7.2.2. Micro
- 7.2.3. Molecular
- 7.3. Market Analysis, Insights and Forecast - by End-user Industry
- 7.3.1. Building and Construction
- 7.3.2. Packaging
- 7.3.3. Textiles
- 7.3.4. Electronics
- 7.3.5. Transportation
- 7.3.6. Other End-user Industries
- 7.1. Market Analysis, Insights and Forecast - by Product Type
- 8. Europe Phase Change Materials Industry Analysis, Insights and Forecast, 2019-2031
- 8.1. Market Analysis, Insights and Forecast - by Product Type
- 8.1.1. Organic
- 8.1.2. Inorganic
- 8.1.3. Bio-based
- 8.2. Market Analysis, Insights and Forecast - by Encapsulation Technology
- 8.2.1. Macro
- 8.2.2. Micro
- 8.2.3. Molecular
- 8.3. Market Analysis, Insights and Forecast - by End-user Industry
- 8.3.1. Building and Construction
- 8.3.2. Packaging
- 8.3.3. Textiles
- 8.3.4. Electronics
- 8.3.5. Transportation
- 8.3.6. Other End-user Industries
- 8.1. Market Analysis, Insights and Forecast - by Product Type
- 9. Rest of the World Phase Change Materials Industry Analysis, Insights and Forecast, 2019-2031
- 9.1. Market Analysis, Insights and Forecast - by Product Type
- 9.1.1. Organic
- 9.1.2. Inorganic
- 9.1.3. Bio-based
- 9.2. Market Analysis, Insights and Forecast - by Encapsulation Technology
- 9.2.1. Macro
- 9.2.2. Micro
- 9.2.3. Molecular
- 9.3. Market Analysis, Insights and Forecast - by End-user Industry
- 9.3.1. Building and Construction
- 9.3.2. Packaging
- 9.3.3. Textiles
- 9.3.4. Electronics
- 9.3.5. Transportation
- 9.3.6. Other End-user Industries
- 9.1. Market Analysis, Insights and Forecast - by Product Type
- 10. North America Phase Change Materials Industry Analysis, Insights and Forecast, 2019-2031
- 10.1. Market Analysis, Insights and Forecast - By Country/Sub-region
- 10.1.1 United States
- 10.1.2 Canada
- 10.1.3 Mexico
- 11. Europe Phase Change Materials Industry Analysis, Insights and Forecast, 2019-2031
- 11.1. Market Analysis, Insights and Forecast - By Country/Sub-region
- 11.1.1 Germany
- 11.1.2 France
- 11.1.3 Italy
- 11.1.4 United Kingdom
- 11.1.5 Netherlands
- 11.1.6 Rest of Europe
- 12. Asia Pacific Phase Change Materials Industry Analysis, Insights and Forecast, 2019-2031
- 12.1. Market Analysis, Insights and Forecast - By Country/Sub-region
- 12.1.1 China
- 12.1.2 Japan
- 12.1.3 India
- 12.1.4 South Korea
- 12.1.5 Taiwan
- 12.1.6 Australia
- 12.1.7 Rest of Asia-Pacific
- 13. South America Phase Change Materials Industry Analysis, Insights and Forecast, 2019-2031
- 13.1. Market Analysis, Insights and Forecast - By Country/Sub-region
- 13.1.1 Brazil
- 13.1.2 Argentina
- 13.1.3 Rest of South America
- 14. MEA Phase Change Materials Industry Analysis, Insights and Forecast, 2019-2031
- 14.1. Market Analysis, Insights and Forecast - By Country/Sub-region
- 14.1.1 Middle East
- 14.1.2 Africa
- 15. Phase Change Materials Industry Analysis, Insights and Forecast, 2019-2031
- 15.1. Market Analysis, Insights and Forecast - By Country/Sub-region
- 15.1.1. undefined
- 16. Competitive Analysis
- 16.1. Global Market Share Analysis 2024
- 16.2. Company Profiles
- 16.2.1 Appvion Inc
- 16.2.1.1. Overview
- 16.2.1.2. Products
- 16.2.1.3. SWOT Analysis
- 16.2.1.4. Recent Developments
- 16.2.1.5. Financials (Based on Availability)
- 16.2.2 Henkel AG & Co KGAA
- 16.2.2.1. Overview
- 16.2.2.2. Products
- 16.2.2.3. SWOT Analysis
- 16.2.2.4. Recent Developments
- 16.2.2.5. Financials (Based on Availability)
- 16.2.3 Shin-Etsu Chemical Co Ltd
- 16.2.3.1. Overview
- 16.2.3.2. Products
- 16.2.3.3. SWOT Analysis
- 16.2.3.4. Recent Developments
- 16.2.3.5. Financials (Based on Availability)
- 16.2.4 Rubitherm Technologies GmbH
- 16.2.4.1. Overview
- 16.2.4.2. Products
- 16.2.4.3. SWOT Analysis
- 16.2.4.4. Recent Developments
- 16.2.4.5. Financials (Based on Availability)
- 16.2.5 Cryopak
- 16.2.5.1. Overview
- 16.2.5.2. Products
- 16.2.5.3. SWOT Analysis
- 16.2.5.4. Recent Developments
- 16.2.5.5. Financials (Based on Availability)
- 16.2.6 Microtek Laboratories Inc
- 16.2.6.1. Overview
- 16.2.6.2. Products
- 16.2.6.3. SWOT Analysis
- 16.2.6.4. Recent Developments
- 16.2.6.5. Financials (Based on Availability)
- 16.2.7 Croda International Plc
- 16.2.7.1. Overview
- 16.2.7.2. Products
- 16.2.7.3. SWOT Analysis
- 16.2.7.4. Recent Developments
- 16.2.7.5. Financials (Based on Availability)
- 16.2.8 Outlast Technologies LLC
- 16.2.8.1. Overview
- 16.2.8.2. Products
- 16.2.8.3. SWOT Analysis
- 16.2.8.4. Recent Developments
- 16.2.8.5. Financials (Based on Availability)
- 16.2.9 Entropy Solution
- 16.2.9.1. Overview
- 16.2.9.2. Products
- 16.2.9.3. SWOT Analysis
- 16.2.9.4. Recent Developments
- 16.2.9.5. Financials (Based on Availability)
- 16.2.10 Shenzhen Aochuan Technology Co Ltd
- 16.2.10.1. Overview
- 16.2.10.2. Products
- 16.2.10.3. SWOT Analysis
- 16.2.10.4. Recent Developments
- 16.2.10.5. Financials (Based on Availability)
- 16.2.11 Laird Technologies
- 16.2.11.1. Overview
- 16.2.11.2. Products
- 16.2.11.3. SWOT Analysis
- 16.2.11.4. Recent Developments
- 16.2.11.5. Financials (Based on Availability)
- 16.2.12 National Gypsum Services Company
- 16.2.12.1. Overview
- 16.2.12.2. Products
- 16.2.12.3. SWOT Analysis
- 16.2.12.4. Recent Developments
- 16.2.12.5. Financials (Based on Availability)
- 16.2.13 Parker Hannifin Corp
- 16.2.13.1. Overview
- 16.2.13.2. Products
- 16.2.13.3. SWOT Analysis
- 16.2.13.4. Recent Developments
- 16.2.13.5. Financials (Based on Availability)
- 16.2.1 Appvion Inc
List of Figures
- Figure 1: Global Phase Change Materials Industry Revenue Breakdown (Million, %) by Region 2024 & 2032
- Figure 2: Global Phase Change Materials Industry Volume Breakdown (K Tons, %) by Region 2024 & 2032
- Figure 3: North America Phase Change Materials Industry Revenue (Million), by Country 2024 & 2032
- Figure 4: North America Phase Change Materials Industry Volume (K Tons), by Country 2024 & 2032
- Figure 5: North America Phase Change Materials Industry Revenue Share (%), by Country 2024 & 2032
- Figure 6: North America Phase Change Materials Industry Volume Share (%), by Country 2024 & 2032
- Figure 7: Europe Phase Change Materials Industry Revenue (Million), by Country 2024 & 2032
- Figure 8: Europe Phase Change Materials Industry Volume (K Tons), by Country 2024 & 2032
- Figure 9: Europe Phase Change Materials Industry Revenue Share (%), by Country 2024 & 2032
- Figure 10: Europe Phase Change Materials Industry Volume Share (%), by Country 2024 & 2032
- Figure 11: Asia Pacific Phase Change Materials Industry Revenue (Million), by Country 2024 & 2032
- Figure 12: Asia Pacific Phase Change Materials Industry Volume (K Tons), by Country 2024 & 2032
- Figure 13: Asia Pacific Phase Change Materials Industry Revenue Share (%), by Country 2024 & 2032
- Figure 14: Asia Pacific Phase Change Materials Industry Volume Share (%), by Country 2024 & 2032
- Figure 15: South America Phase Change Materials Industry Revenue (Million), by Country 2024 & 2032
- Figure 16: South America Phase Change Materials Industry Volume (K Tons), by Country 2024 & 2032
- Figure 17: South America Phase Change Materials Industry Revenue Share (%), by Country 2024 & 2032
- Figure 18: South America Phase Change Materials Industry Volume Share (%), by Country 2024 & 2032
- Figure 19: MEA Phase Change Materials Industry Revenue (Million), by Country 2024 & 2032
- Figure 20: MEA Phase Change Materials Industry Volume (K Tons), by Country 2024 & 2032
- Figure 21: MEA Phase Change Materials Industry Revenue Share (%), by Country 2024 & 2032
- Figure 22: MEA Phase Change Materials Industry Volume Share (%), by Country 2024 & 2032
- Figure 23: Phase Change Materials Industry Revenue (Million), by Country 2024 & 2032
- Figure 24: Phase Change Materials Industry Volume (K Tons), by Country 2024 & 2032
- Figure 25: Phase Change Materials Industry Revenue Share (%), by Country 2024 & 2032
- Figure 26: Phase Change Materials Industry Volume Share (%), by Country 2024 & 2032
- Figure 27: Asia Pacific Phase Change Materials Industry Revenue (Million), by Product Type 2024 & 2032
- Figure 28: Asia Pacific Phase Change Materials Industry Volume (K Tons), by Product Type 2024 & 2032
- Figure 29: Asia Pacific Phase Change Materials Industry Revenue Share (%), by Product Type 2024 & 2032
- Figure 30: Asia Pacific Phase Change Materials Industry Volume Share (%), by Product Type 2024 & 2032
- Figure 31: Asia Pacific Phase Change Materials Industry Revenue (Million), by Encapsulation Technology 2024 & 2032
- Figure 32: Asia Pacific Phase Change Materials Industry Volume (K Tons), by Encapsulation Technology 2024 & 2032
- Figure 33: Asia Pacific Phase Change Materials Industry Revenue Share (%), by Encapsulation Technology 2024 & 2032
- Figure 34: Asia Pacific Phase Change Materials Industry Volume Share (%), by Encapsulation Technology 2024 & 2032
- Figure 35: Asia Pacific Phase Change Materials Industry Revenue (Million), by End-user Industry 2024 & 2032
- Figure 36: Asia Pacific Phase Change Materials Industry Volume (K Tons), by End-user Industry 2024 & 2032
- Figure 37: Asia Pacific Phase Change Materials Industry Revenue Share (%), by End-user Industry 2024 & 2032
- Figure 38: Asia Pacific Phase Change Materials Industry Volume Share (%), by End-user Industry 2024 & 2032
- Figure 39: Asia Pacific Phase Change Materials Industry Revenue (Million), by Country 2024 & 2032
- Figure 40: Asia Pacific Phase Change Materials Industry Volume (K Tons), by Country 2024 & 2032
- Figure 41: Asia Pacific Phase Change Materials Industry Revenue Share (%), by Country 2024 & 2032
- Figure 42: Asia Pacific Phase Change Materials Industry Volume Share (%), by Country 2024 & 2032
- Figure 43: North America Phase Change Materials Industry Revenue (Million), by Product Type 2024 & 2032
- Figure 44: North America Phase Change Materials Industry Volume (K Tons), by Product Type 2024 & 2032
- Figure 45: North America Phase Change Materials Industry Revenue Share (%), by Product Type 2024 & 2032
- Figure 46: North America Phase Change Materials Industry Volume Share (%), by Product Type 2024 & 2032
- Figure 47: North America Phase Change Materials Industry Revenue (Million), by Encapsulation Technology 2024 & 2032
- Figure 48: North America Phase Change Materials Industry Volume (K Tons), by Encapsulation Technology 2024 & 2032
- Figure 49: North America Phase Change Materials Industry Revenue Share (%), by Encapsulation Technology 2024 & 2032
- Figure 50: North America Phase Change Materials Industry Volume Share (%), by Encapsulation Technology 2024 & 2032
- Figure 51: North America Phase Change Materials Industry Revenue (Million), by End-user Industry 2024 & 2032
- Figure 52: North America Phase Change Materials Industry Volume (K Tons), by End-user Industry 2024 & 2032
- Figure 53: North America Phase Change Materials Industry Revenue Share (%), by End-user Industry 2024 & 2032
- Figure 54: North America Phase Change Materials Industry Volume Share (%), by End-user Industry 2024 & 2032
- Figure 55: North America Phase Change Materials Industry Revenue (Million), by Country 2024 & 2032
- Figure 56: North America Phase Change Materials Industry Volume (K Tons), by Country 2024 & 2032
- Figure 57: North America Phase Change Materials Industry Revenue Share (%), by Country 2024 & 2032
- Figure 58: North America Phase Change Materials Industry Volume Share (%), by Country 2024 & 2032
- Figure 59: Europe Phase Change Materials Industry Revenue (Million), by Product Type 2024 & 2032
- Figure 60: Europe Phase Change Materials Industry Volume (K Tons), by Product Type 2024 & 2032
- Figure 61: Europe Phase Change Materials Industry Revenue Share (%), by Product Type 2024 & 2032
- Figure 62: Europe Phase Change Materials Industry Volume Share (%), by Product Type 2024 & 2032
- Figure 63: Europe Phase Change Materials Industry Revenue (Million), by Encapsulation Technology 2024 & 2032
- Figure 64: Europe Phase Change Materials Industry Volume (K Tons), by Encapsulation Technology 2024 & 2032
- Figure 65: Europe Phase Change Materials Industry Revenue Share (%), by Encapsulation Technology 2024 & 2032
- Figure 66: Europe Phase Change Materials Industry Volume Share (%), by Encapsulation Technology 2024 & 2032
- Figure 67: Europe Phase Change Materials Industry Revenue (Million), by End-user Industry 2024 & 2032
- Figure 68: Europe Phase Change Materials Industry Volume (K Tons), by End-user Industry 2024 & 2032
- Figure 69: Europe Phase Change Materials Industry Revenue Share (%), by End-user Industry 2024 & 2032
- Figure 70: Europe Phase Change Materials Industry Volume Share (%), by End-user Industry 2024 & 2032
- Figure 71: Europe Phase Change Materials Industry Revenue (Million), by Country 2024 & 2032
- Figure 72: Europe Phase Change Materials Industry Volume (K Tons), by Country 2024 & 2032
- Figure 73: Europe Phase Change Materials Industry Revenue Share (%), by Country 2024 & 2032
- Figure 74: Europe Phase Change Materials Industry Volume Share (%), by Country 2024 & 2032
- Figure 75: Rest of the World Phase Change Materials Industry Revenue (Million), by Product Type 2024 & 2032
- Figure 76: Rest of the World Phase Change Materials Industry Volume (K Tons), by Product Type 2024 & 2032
- Figure 77: Rest of the World Phase Change Materials Industry Revenue Share (%), by Product Type 2024 & 2032
- Figure 78: Rest of the World Phase Change Materials Industry Volume Share (%), by Product Type 2024 & 2032
- Figure 79: Rest of the World Phase Change Materials Industry Revenue (Million), by Encapsulation Technology 2024 & 2032
- Figure 80: Rest of the World Phase Change Materials Industry Volume (K Tons), by Encapsulation Technology 2024 & 2032
- Figure 81: Rest of the World Phase Change Materials Industry Revenue Share (%), by Encapsulation Technology 2024 & 2032
- Figure 82: Rest of the World Phase Change Materials Industry Volume Share (%), by Encapsulation Technology 2024 & 2032
- Figure 83: Rest of the World Phase Change Materials Industry Revenue (Million), by End-user Industry 2024 & 2032
- Figure 84: Rest of the World Phase Change Materials Industry Volume (K Tons), by End-user Industry 2024 & 2032
- Figure 85: Rest of the World Phase Change Materials Industry Revenue Share (%), by End-user Industry 2024 & 2032
- Figure 86: Rest of the World Phase Change Materials Industry Volume Share (%), by End-user Industry 2024 & 2032
- Figure 87: Rest of the World Phase Change Materials Industry Revenue (Million), by Country 2024 & 2032
- Figure 88: Rest of the World Phase Change Materials Industry Volume (K Tons), by Country 2024 & 2032
- Figure 89: Rest of the World Phase Change Materials Industry Revenue Share (%), by Country 2024 & 2032
- Figure 90: Rest of the World Phase Change Materials Industry Volume Share (%), by Country 2024 & 2032
List of Tables
- Table 1: Global Phase Change Materials Industry Revenue Million Forecast, by Region 2019 & 2032
- Table 2: Global Phase Change Materials Industry Volume K Tons Forecast, by Region 2019 & 2032
- Table 3: Global Phase Change Materials Industry Revenue Million Forecast, by Product Type 2019 & 2032
- Table 4: Global Phase Change Materials Industry Volume K Tons Forecast, by Product Type 2019 & 2032
- Table 5: Global Phase Change Materials Industry Revenue Million Forecast, by Encapsulation Technology 2019 & 2032
- Table 6: Global Phase Change Materials Industry Volume K Tons Forecast, by Encapsulation Technology 2019 & 2032
- Table 7: Global Phase Change Materials Industry Revenue Million Forecast, by End-user Industry 2019 & 2032
- Table 8: Global Phase Change Materials Industry Volume K Tons Forecast, by End-user Industry 2019 & 2032
- Table 9: Global Phase Change Materials Industry Revenue Million Forecast, by Region 2019 & 2032
- Table 10: Global Phase Change Materials Industry Volume K Tons Forecast, by Region 2019 & 2032
- Table 11: Global Phase Change Materials Industry Revenue Million Forecast, by Country 2019 & 2032
- Table 12: Global Phase Change Materials Industry Volume K Tons Forecast, by Country 2019 & 2032
- Table 13: United States Phase Change Materials Industry Revenue (Million) Forecast, by Application 2019 & 2032
- Table 14: United States Phase Change Materials Industry Volume (K Tons) Forecast, by Application 2019 & 2032
- Table 15: Canada Phase Change Materials Industry Revenue (Million) Forecast, by Application 2019 & 2032
- Table 16: Canada Phase Change Materials Industry Volume (K Tons) Forecast, by Application 2019 & 2032
- Table 17: Mexico Phase Change Materials Industry Revenue (Million) Forecast, by Application 2019 & 2032
- Table 18: Mexico Phase Change Materials Industry Volume (K Tons) Forecast, by Application 2019 & 2032
- Table 19: Global Phase Change Materials Industry Revenue Million Forecast, by Country 2019 & 2032
- Table 20: Global Phase Change Materials Industry Volume K Tons Forecast, by Country 2019 & 2032
- Table 21: Germany Phase Change Materials Industry Revenue (Million) Forecast, by Application 2019 & 2032
- Table 22: Germany Phase Change Materials Industry Volume (K Tons) Forecast, by Application 2019 & 2032
- Table 23: France Phase Change Materials Industry Revenue (Million) Forecast, by Application 2019 & 2032
- Table 24: France Phase Change Materials Industry Volume (K Tons) Forecast, by Application 2019 & 2032
- Table 25: Italy Phase Change Materials Industry Revenue (Million) Forecast, by Application 2019 & 2032
- Table 26: Italy Phase Change Materials Industry Volume (K Tons) Forecast, by Application 2019 & 2032
- Table 27: United Kingdom Phase Change Materials Industry Revenue (Million) Forecast, by Application 2019 & 2032
- Table 28: United Kingdom Phase Change Materials Industry Volume (K Tons) Forecast, by Application 2019 & 2032
- Table 29: Netherlands Phase Change Materials Industry Revenue (Million) Forecast, by Application 2019 & 2032
- Table 30: Netherlands Phase Change Materials Industry Volume (K Tons) Forecast, by Application 2019 & 2032
- Table 31: Rest of Europe Phase Change Materials Industry Revenue (Million) Forecast, by Application 2019 & 2032
- Table 32: Rest of Europe Phase Change Materials Industry Volume (K Tons) Forecast, by Application 2019 & 2032
- Table 33: Global Phase Change Materials Industry Revenue Million Forecast, by Country 2019 & 2032
- Table 34: Global Phase Change Materials Industry Volume K Tons Forecast, by Country 2019 & 2032
- Table 35: China Phase Change Materials Industry Revenue (Million) Forecast, by Application 2019 & 2032
- Table 36: China Phase Change Materials Industry Volume (K Tons) Forecast, by Application 2019 & 2032
- Table 37: Japan Phase Change Materials Industry Revenue (Million) Forecast, by Application 2019 & 2032
- Table 38: Japan Phase Change Materials Industry Volume (K Tons) Forecast, by Application 2019 & 2032
- Table 39: India Phase Change Materials Industry Revenue (Million) Forecast, by Application 2019 & 2032
- Table 40: India Phase Change Materials Industry Volume (K Tons) Forecast, by Application 2019 & 2032
- Table 41: South Korea Phase Change Materials Industry Revenue (Million) Forecast, by Application 2019 & 2032
- Table 42: South Korea Phase Change Materials Industry Volume (K Tons) Forecast, by Application 2019 & 2032
- Table 43: Taiwan Phase Change Materials Industry Revenue (Million) Forecast, by Application 2019 & 2032
- Table 44: Taiwan Phase Change Materials Industry Volume (K Tons) Forecast, by Application 2019 & 2032
- Table 45: Australia Phase Change Materials Industry Revenue (Million) Forecast, by Application 2019 & 2032
- Table 46: Australia Phase Change Materials Industry Volume (K Tons) Forecast, by Application 2019 & 2032
- Table 47: Rest of Asia-Pacific Phase Change Materials Industry Revenue (Million) Forecast, by Application 2019 & 2032
- Table 48: Rest of Asia-Pacific Phase Change Materials Industry Volume (K Tons) Forecast, by Application 2019 & 2032
- Table 49: Global Phase Change Materials Industry Revenue Million Forecast, by Country 2019 & 2032
- Table 50: Global Phase Change Materials Industry Volume K Tons Forecast, by Country 2019 & 2032
- Table 51: Brazil Phase Change Materials Industry Revenue (Million) Forecast, by Application 2019 & 2032
- Table 52: Brazil Phase Change Materials Industry Volume (K Tons) Forecast, by Application 2019 & 2032
- Table 53: Argentina Phase Change Materials Industry Revenue (Million) Forecast, by Application 2019 & 2032
- Table 54: Argentina Phase Change Materials Industry Volume (K Tons) Forecast, by Application 2019 & 2032
- Table 55: Rest of South America Phase Change Materials Industry Revenue (Million) Forecast, by Application 2019 & 2032
- Table 56: Rest of South America Phase Change Materials Industry Volume (K Tons) Forecast, by Application 2019 & 2032
- Table 57: Global Phase Change Materials Industry Revenue Million Forecast, by Country 2019 & 2032
- Table 58: Global Phase Change Materials Industry Volume K Tons Forecast, by Country 2019 & 2032
- Table 59: Middle East Phase Change Materials Industry Revenue (Million) Forecast, by Application 2019 & 2032
- Table 60: Middle East Phase Change Materials Industry Volume (K Tons) Forecast, by Application 2019 & 2032
- Table 61: Africa Phase Change Materials Industry Revenue (Million) Forecast, by Application 2019 & 2032
- Table 62: Africa Phase Change Materials Industry Volume (K Tons) Forecast, by Application 2019 & 2032
- Table 63: Global Phase Change Materials Industry Revenue Million Forecast, by Country 2019 & 2032
- Table 64: Global Phase Change Materials Industry Volume K Tons Forecast, by Country 2019 & 2032
- Table 65: Global Phase Change Materials Industry Revenue Million Forecast, by Product Type 2019 & 2032
- Table 66: Global Phase Change Materials Industry Volume K Tons Forecast, by Product Type 2019 & 2032
- Table 67: Global Phase Change Materials Industry Revenue Million Forecast, by Encapsulation Technology 2019 & 2032
- Table 68: Global Phase Change Materials Industry Volume K Tons Forecast, by Encapsulation Technology 2019 & 2032
- Table 69: Global Phase Change Materials Industry Revenue Million Forecast, by End-user Industry 2019 & 2032
- Table 70: Global Phase Change Materials Industry Volume K Tons Forecast, by End-user Industry 2019 & 2032
- Table 71: Global Phase Change Materials Industry Revenue Million Forecast, by Country 2019 & 2032
- Table 72: Global Phase Change Materials Industry Volume K Tons Forecast, by Country 2019 & 2032
- Table 73: China Phase Change Materials Industry Revenue (Million) Forecast, by Application 2019 & 2032
- Table 74: China Phase Change Materials Industry Volume (K Tons) Forecast, by Application 2019 & 2032
- Table 75: India Phase Change Materials Industry Revenue (Million) Forecast, by Application 2019 & 2032
- Table 76: India Phase Change Materials Industry Volume (K Tons) Forecast, by Application 2019 & 2032
- Table 77: Japan Phase Change Materials Industry Revenue (Million) Forecast, by Application 2019 & 2032
- Table 78: Japan Phase Change Materials Industry Volume (K Tons) Forecast, by Application 2019 & 2032
- Table 79: South Korea Phase Change Materials Industry Revenue (Million) Forecast, by Application 2019 & 2032
- Table 80: South Korea Phase Change Materials Industry Volume (K Tons) Forecast, by Application 2019 & 2032
- Table 81: Rest of Asia Pacific Phase Change Materials Industry Revenue (Million) Forecast, by Application 2019 & 2032
- Table 82: Rest of Asia Pacific Phase Change Materials Industry Volume (K Tons) Forecast, by Application 2019 & 2032
- Table 83: Global Phase Change Materials Industry Revenue Million Forecast, by Product Type 2019 & 2032
- Table 84: Global Phase Change Materials Industry Volume K Tons Forecast, by Product Type 2019 & 2032
- Table 85: Global Phase Change Materials Industry Revenue Million Forecast, by Encapsulation Technology 2019 & 2032
- Table 86: Global Phase Change Materials Industry Volume K Tons Forecast, by Encapsulation Technology 2019 & 2032
- Table 87: Global Phase Change Materials Industry Revenue Million Forecast, by End-user Industry 2019 & 2032
- Table 88: Global Phase Change Materials Industry Volume K Tons Forecast, by End-user Industry 2019 & 2032
- Table 89: Global Phase Change Materials Industry Revenue Million Forecast, by Country 2019 & 2032
- Table 90: Global Phase Change Materials Industry Volume K Tons Forecast, by Country 2019 & 2032
- Table 91: United States Phase Change Materials Industry Revenue (Million) Forecast, by Application 2019 & 2032
- Table 92: United States Phase Change Materials Industry Volume (K Tons) Forecast, by Application 2019 & 2032
- Table 93: Canada Phase Change Materials Industry Revenue (Million) Forecast, by Application 2019 & 2032
- Table 94: Canada Phase Change Materials Industry Volume (K Tons) Forecast, by Application 2019 & 2032
- Table 95: Mexico Phase Change Materials Industry Revenue (Million) Forecast, by Application 2019 & 2032
- Table 96: Mexico Phase Change Materials Industry Volume (K Tons) Forecast, by Application 2019 & 2032
- Table 97: Global Phase Change Materials Industry Revenue Million Forecast, by Product Type 2019 & 2032
- Table 98: Global Phase Change Materials Industry Volume K Tons Forecast, by Product Type 2019 & 2032
- Table 99: Global Phase Change Materials Industry Revenue Million Forecast, by Encapsulation Technology 2019 & 2032
- Table 100: Global Phase Change Materials Industry Volume K Tons Forecast, by Encapsulation Technology 2019 & 2032
- Table 101: Global Phase Change Materials Industry Revenue Million Forecast, by End-user Industry 2019 & 2032
- Table 102: Global Phase Change Materials Industry Volume K Tons Forecast, by End-user Industry 2019 & 2032
- Table 103: Global Phase Change Materials Industry Revenue Million Forecast, by Country 2019 & 2032
- Table 104: Global Phase Change Materials Industry Volume K Tons Forecast, by Country 2019 & 2032
- Table 105: Germany Phase Change Materials Industry Revenue (Million) Forecast, by Application 2019 & 2032
- Table 106: Germany Phase Change Materials Industry Volume (K Tons) Forecast, by Application 2019 & 2032
- Table 107: United Kingdom Phase Change Materials Industry Revenue (Million) Forecast, by Application 2019 & 2032
- Table 108: United Kingdom Phase Change Materials Industry Volume (K Tons) Forecast, by Application 2019 & 2032
- Table 109: Italy Phase Change Materials Industry Revenue (Million) Forecast, by Application 2019 & 2032
- Table 110: Italy Phase Change Materials Industry Volume (K Tons) Forecast, by Application 2019 & 2032
- Table 111: France Phase Change Materials Industry Revenue (Million) Forecast, by Application 2019 & 2032
- Table 112: France Phase Change Materials Industry Volume (K Tons) Forecast, by Application 2019 & 2032
- Table 113: Rest of Europe Phase Change Materials Industry Revenue (Million) Forecast, by Application 2019 & 2032
- Table 114: Rest of Europe Phase Change Materials Industry Volume (K Tons) Forecast, by Application 2019 & 2032
- Table 115: Global Phase Change Materials Industry Revenue Million Forecast, by Product Type 2019 & 2032
- Table 116: Global Phase Change Materials Industry Volume K Tons Forecast, by Product Type 2019 & 2032
- Table 117: Global Phase Change Materials Industry Revenue Million Forecast, by Encapsulation Technology 2019 & 2032
- Table 118: Global Phase Change Materials Industry Volume K Tons Forecast, by Encapsulation Technology 2019 & 2032
- Table 119: Global Phase Change Materials Industry Revenue Million Forecast, by End-user Industry 2019 & 2032
- Table 120: Global Phase Change Materials Industry Volume K Tons Forecast, by End-user Industry 2019 & 2032
- Table 121: Global Phase Change Materials Industry Revenue Million Forecast, by Country 2019 & 2032
- Table 122: Global Phase Change Materials Industry Volume K Tons Forecast, by Country 2019 & 2032
- Table 123: Brazil Phase Change Materials Industry Revenue (Million) Forecast, by Application 2019 & 2032
- Table 124: Brazil Phase Change Materials Industry Volume (K Tons) Forecast, by Application 2019 & 2032
- Table 125: Saudi Arabia Phase Change Materials Industry Revenue (Million) Forecast, by Application 2019 & 2032
- Table 126: Saudi Arabia Phase Change Materials Industry Volume (K Tons) Forecast, by Application 2019 & 2032
- Table 127: South Africa Phase Change Materials Industry Revenue (Million) Forecast, by Application 2019 & 2032
- Table 128: South Africa Phase Change Materials Industry Volume (K Tons) Forecast, by Application 2019 & 2032
- Table 129: Other Countries Phase Change Materials Industry Revenue (Million) Forecast, by Application 2019 & 2032
- Table 130: Other Countries Phase Change Materials Industry Volume (K Tons) Forecast, by Application 2019 & 2032
Frequently Asked Questions
1. What is the projected Compound Annual Growth Rate (CAGR) of the Phase Change Materials Industry?
The projected CAGR is approximately > 15.00%.
2. Which companies are prominent players in the Phase Change Materials Industry?
Key companies in the market include Appvion Inc, Henkel AG & Co KGAA, Shin-Etsu Chemical Co Ltd, Rubitherm Technologies GmbH, Cryopak, Microtek Laboratories Inc, Croda International Plc, Outlast Technologies LLC, Entropy Solution, Shenzhen Aochuan Technology Co Ltd, Laird Technologies, National Gypsum Services Company, Parker Hannifin Corp.
3. What are the main segments of the Phase Change Materials Industry?
The market segments include Product Type, Encapsulation Technology, End-user Industry.
4. Can you provide details about the market size?
The market size is estimated to be USD XX Million as of 2022.
5. What are some drivers contributing to market growth?
Expanding Global Trend Towards Energy Conservation and Sustainable Development; Other Drivers.
6. What are the notable trends driving market growth?
Building and Construction Industry to Dominate the Market.
7. Are there any restraints impacting market growth?
Hazardous Nature of Phase Change Materials; Other Restraints.
8. Can you provide examples of recent developments in the market?
October 2022: Shanghai Polytechnic University researchers announced the development of a new efficient phase change microcapsules for storing solar energy. The newly designed microcapsule demonstrated enhanced heat transfer, storage properties, and high-performance photothermal conversion.
9. What pricing options are available for accessing the report?
Pricing options include single-user, multi-user, and enterprise licenses priced at USD 4750, USD 5250, and USD 8750 respectively.
10. Is the market size provided in terms of value or volume?
The market size is provided in terms of value, measured in Million and volume, measured in K Tons.
11. Are there any specific market keywords associated with the report?
Yes, the market keyword associated with the report is "Phase Change Materials Industry," which aids in identifying and referencing the specific market segment covered.
12. How do I determine which pricing option suits my needs best?
The pricing options vary based on user requirements and access needs. Individual users may opt for single-user licenses, while businesses requiring broader access may choose multi-user or enterprise licenses for cost-effective access to the report.
13. Are there any additional resources or data provided in the Phase Change Materials Industry report?
While the report offers comprehensive insights, it's advisable to review the specific contents or supplementary materials provided to ascertain if additional resources or data are available.
14. How can I stay updated on further developments or reports in the Phase Change Materials Industry?
To stay informed about further developments, trends, and reports in the Phase Change Materials Industry, consider subscribing to industry newsletters, following relevant companies and organizations, or regularly checking reputable industry news sources and publications.
Methodology
Step 1 - Identification of Relevant Samples Size from Population Database


Step 2 - Approaches for Defining Global Market Size (Value, Volume* & Price*)

Note*: In applicable scenarios
Step 3 - Data Sources
Primary Research
- Web Analytics
- Survey Reports
- Research Institute
- Latest Research Reports
- Opinion Leaders
Secondary Research
- Annual Reports
- White Paper
- Latest Press Release
- Industry Association
- Paid Database
- Investor Presentations

Step 4 - Data Triangulation
Involves using different sources of information in order to increase the validity of a study
These sources are likely to be stakeholders in a program - participants, other researchers, program staff, other community members, and so on.
Then we put all data in single framework & apply various statistical tools to find out the dynamic on the market.
During the analysis stage, feedback from the stakeholder groups would be compared to determine areas of agreement as well as areas of divergence
