

Key Insights
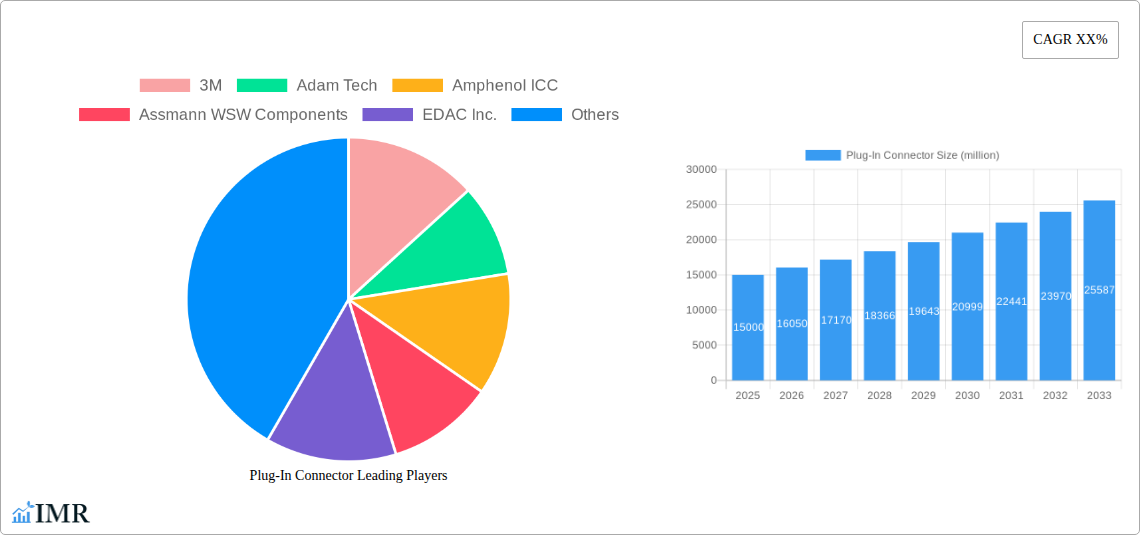
The global Plug-In Connector market is experiencing robust growth, driven by the increasing demand for high-speed data transmission and miniaturization in electronics. The market, estimated at $15 billion in 2025, is projected to grow at a Compound Annual Growth Rate (CAGR) of 7% from 2025 to 2033, reaching approximately $25 billion by 2033. This expansion is fueled by several key factors, including the proliferation of consumer electronics, the rise of electric vehicles (EVs) necessitating advanced power connectors, and the growth of data centers requiring high-bandwidth interconnections. Furthermore, technological advancements in connector design, such as the development of smaller, more robust, and environmentally friendly connectors, are contributing to market growth. Key players like 3M, TE Connectivity, and Molex are driving innovation and competition within the sector, constantly pushing the boundaries of performance and reliability.
However, certain challenges constrain market growth. The high initial investment required for advanced connector manufacturing and the stringent regulatory standards imposed on connector safety and performance can act as barriers to entry for new players. Moreover, fluctuations in raw material prices and potential supply chain disruptions can impact the overall market performance. Nevertheless, the ongoing demand for high-performance and reliable connectors across various industries ensures that the Plug-In Connector market will continue its upward trajectory, presenting substantial opportunities for established players and emerging companies alike. Segmentation within the market includes various connector types (e.g., USB, HDMI, power connectors), applications (e.g., consumer electronics, automotive, industrial), and materials (e.g., plastic, metal). This nuanced segmentation allows for a more precise understanding of market dynamics and facilitates tailored growth strategies.
This comprehensive report provides an in-depth analysis of the Plug-In Connector market, encompassing historical data (2019-2024), current estimations (2025), and future forecasts (2025-2033). Targeting industry professionals and investors, this report leverages robust data and expert insights to unlock growth opportunities within the parent market of Electronic Connectors and the child market of Industrial Automation Connectors. The report covers market dynamics, growth trends, regional analysis, product landscape, challenges, opportunities, key players (including 3M, Amphenol ICC, TE Connectivity AMP Connectors, and more), and significant milestones. The projected market size for 2025 is estimated at xx million units.
Plug-In Connector Market Dynamics & Structure
This section analyzes the competitive landscape of the Plug-In Connector market, encompassing market concentration, technological innovation, regulatory frameworks, and market dynamics. We examine the impact of mergers and acquisitions (M&A) activity and identify key factors influencing market growth. The report further explores end-user demographics and assesses the influence of substitute products.
- Market Concentration: The Plug-In Connector market exhibits a moderately consolidated structure, with a few major players holding significant market share. The top 5 players collectively account for approximately xx% of the market in 2025.
- Technological Innovation: Continuous advancements in miniaturization, high-speed data transmission, and power handling capabilities are driving innovation. The adoption of new materials and improved connector designs is also a key driver.
- Regulatory Frameworks: Compliance with industry standards (e.g., IEC, UL) and regional regulations significantly impacts product design and market access.
- Competitive Product Substitutes: Wireless technologies and alternative interconnection methods pose a level of competitive pressure; however, the reliability and established infrastructure of plug-in connectors remain significant advantages.
- M&A Trends: The number of M&A deals within the Plug-In Connector market from 2019 to 2024 totaled xx, primarily driven by strategic acquisitions aimed at expanding product portfolios and market reach. The average deal value was approximately xx million USD.
- End-User Demographics: Key end-user segments include automotive, industrial automation, consumer electronics, and telecommunications, each exhibiting unique demands.
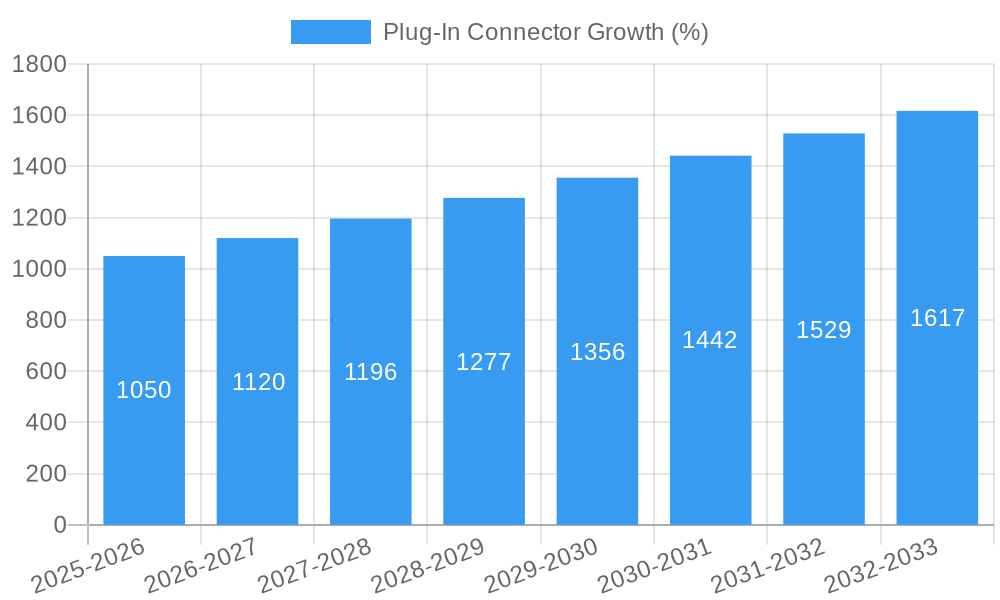
Plug-In Connector Growth Trends & Insights
This section delves into the historical and projected growth trajectory of the Plug-In Connector market. We analyze market size evolution, adoption rates, technological disruptions, and shifting consumer behaviors to provide a comprehensive understanding of market dynamics and growth drivers.
The Plug-In Connector market experienced a CAGR of xx% from 2019 to 2024, reaching xx million units in 2024. Driven by factors such as the increasing adoption of automation in various industries and the growth of the consumer electronics sector, the market is projected to maintain a robust growth trajectory, reaching xx million units by 2033, with a projected CAGR of xx% during the forecast period (2025-2033). Market penetration in key end-user segments is increasing steadily, reflecting the growing demand for reliable and efficient interconnection solutions. Technological advancements, such as the introduction of high-speed connectors and miniaturized designs, are driving further market growth and shaping future demand. This market analysis encompasses specific metrics illustrating the evolution and projected growth.
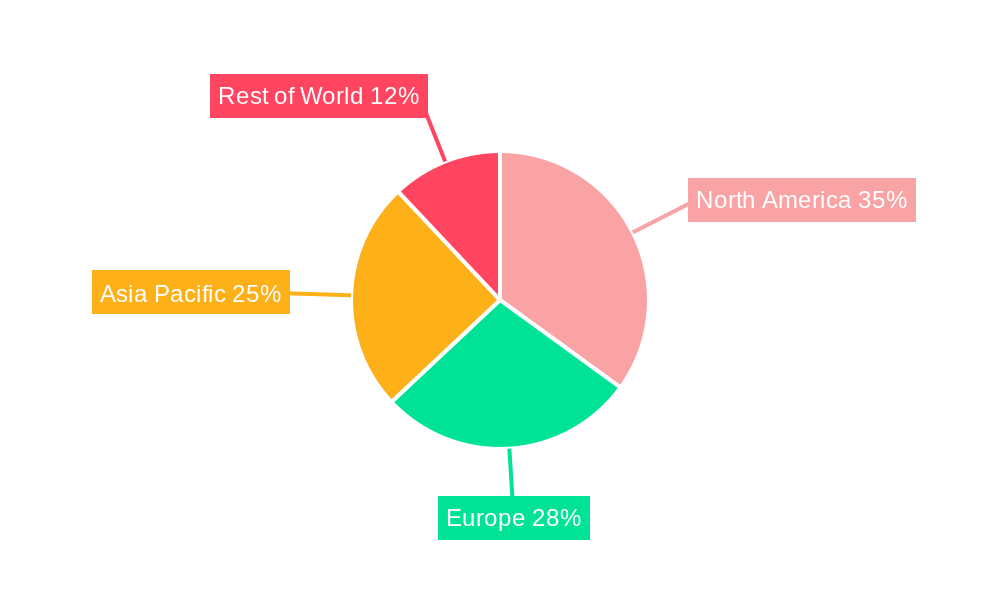
Dominant Regions, Countries, or Segments in Plug-In Connector
This section pinpoints the leading geographical regions and segments driving Plug-In Connector market expansion. We provide in-depth analysis of market share, growth potential, and underlying drivers within each region/segment.
- Dominant Region: North America currently holds the largest market share, driven by robust industrial automation, automotive, and consumer electronics sectors. Asia-Pacific is projected to exhibit the highest growth rate over the forecast period, fueled by rapid industrialization and expanding consumer electronics markets.
- Key Drivers: Economic growth, favorable government policies promoting industrial automation, increasing infrastructure development, and strong demand from key end-user segments are major contributing factors to regional market growth.
- Market Share & Growth Potential: North America holds an estimated xx% market share in 2025, while Asia-Pacific is expected to expand its share to xx% by 2033. Europe and other regions also contribute significantly to the overall market.
Plug-In Connector Product Landscape
This section provides an overview of the various types of plug-in connectors available in the market, highlighting their applications, performance metrics, unique selling propositions, and technological advancements driving innovation in this area. Recent product innovations focus on improved durability, miniaturization, higher bandwidth capabilities, and enhanced power handling. These advancements cater to the increasing demands of high-speed data transmission and miniaturized electronic devices.
Key Drivers, Barriers & Challenges in Plug-In Connector
Key Drivers: The increasing demand for high-speed data transmission, miniaturization of electronic devices, and the growing adoption of automation across diverse industries are key drivers. Government initiatives supporting technological advancement and infrastructure development in several regions contribute significantly to market expansion.
Key Challenges: Supply chain disruptions and component shortages pose significant challenges to manufacturing and delivery. Stringent regulatory compliance and the rising costs of raw materials add pressure to profitability. Intense competition from existing players and emerging technologies also impact market dynamics.
Emerging Opportunities in Plug-In Connector
Emerging opportunities include the growing demand for connectors in renewable energy applications, the expansion of the electric vehicle market, and the increasing adoption of IoT devices. Untapped markets in developing economies and the development of specialized connectors for niche applications offer significant growth potential.
Growth Accelerators in the Plug-In Connector Industry
Strategic partnerships, technological collaborations, and the development of innovative connector designs are accelerating market growth. Investments in research and development are fueling technological advancements, and expansion into new geographical markets creates significant opportunities for growth.
Key Players Shaping the Plug-In Connector Market
- 3M
- Adam Tech
- Amphenol ICC
- Assmann WSW Components
- EDAC Inc.
- Finisar Corporation
- HARTING
- Hirose Electric Co Ltd
- JAE Electronics
- KYOCERA AVX
- Molex
- NI
- Pulse Electronics
- Samtec Inc.
- Stewart Connector
- TE Connectivity AMP Connectors
Notable Milestones in Plug-In Connector Sector
- 2020: Introduction of a new high-speed connector by Samtec Inc. significantly improved data transmission capabilities.
- 2021: Amphenol ICC acquired a smaller connector manufacturer, expanding its product portfolio.
- 2022: New industry standards for power handling capacity in connectors were established.
- 2023: TE Connectivity launched a miniaturized connector optimized for consumer electronics applications.
- 2024: 3M introduced a new environmentally friendly connector material.
In-Depth Plug-In Connector Market Outlook
The Plug-In Connector market is poised for sustained growth, driven by ongoing technological advancements, increasing demand from key industries, and the expansion of new applications. Strategic partnerships and focused R&D efforts will play a crucial role in shaping the future of this market. The opportunities are vast, particularly in emerging economies and specialized industrial segments. This favorable outlook presents significant potential for businesses to capitalize on the rising demand for advanced connector technologies.
Plug-In Connector Segmentation
-
1. Application
- 1.1. Electronic
- 1.2. Communication
- 1.3. Industry
- 1.4. Other
-
2. Types
- 2.1. Surface Mount
- 2.2. Through Hole Mounting
- 2.3. Free Hanging
Plug-In Connector Segmentation By Geography
-
1. North America
- 1.1. United States
- 1.2. Canada
- 1.3. Mexico
-
2. South America
- 2.1. Brazil
- 2.2. Argentina
- 2.3. Rest of South America
-
3. Europe
- 3.1. United Kingdom
- 3.2. Germany
- 3.3. France
- 3.4. Italy
- 3.5. Spain
- 3.6. Russia
- 3.7. Benelux
- 3.8. Nordics
- 3.9. Rest of Europe
-
4. Middle East & Africa
- 4.1. Turkey
- 4.2. Israel
- 4.3. GCC
- 4.4. North Africa
- 4.5. South Africa
- 4.6. Rest of Middle East & Africa
-
5. Asia Pacific
- 5.1. China
- 5.2. India
- 5.3. Japan
- 5.4. South Korea
- 5.5. ASEAN
- 5.6. Oceania
- 5.7. Rest of Asia Pacific
Plug-In Connector REPORT HIGHLIGHTS
| Aspects | Details |
|---|---|
| Study Period | 2019-2033 |
| Base Year | 2024 |
| Estimated Year | 2025 |
| Forecast Period | 2025-2033 |
| Historical Period | 2019-2024 |
| Growth Rate | CAGR of XX% from 2019-2033 |
| Segmentation |
|
Table of Contents
- 1. Introduction
- 1.1. Research Scope
- 1.2. Market Segmentation
- 1.3. Research Methodology
- 1.4. Definitions and Assumptions
- 2. Executive Summary
- 2.1. Introduction
- 3. Market Dynamics
- 3.1. Introduction
- 3.2. Market Drivers
- 3.3. Market Restrains
- 3.4. Market Trends
- 4. Market Factor Analysis
- 4.1. Porters Five Forces
- 4.2. Supply/Value Chain
- 4.3. PESTEL analysis
- 4.4. Market Entropy
- 4.5. Patent/Trademark Analysis
- 5. Global Plug-In Connector Analysis, Insights and Forecast, 2019-2031
- 5.1. Market Analysis, Insights and Forecast - by Application
- 5.1.1. Electronic
- 5.1.2. Communication
- 5.1.3. Industry
- 5.1.4. Other
- 5.2. Market Analysis, Insights and Forecast - by Types
- 5.2.1. Surface Mount
- 5.2.2. Through Hole Mounting
- 5.2.3. Free Hanging
- 5.3. Market Analysis, Insights and Forecast - by Region
- 5.3.1. North America
- 5.3.2. South America
- 5.3.3. Europe
- 5.3.4. Middle East & Africa
- 5.3.5. Asia Pacific
- 5.1. Market Analysis, Insights and Forecast - by Application
- 6. North America Plug-In Connector Analysis, Insights and Forecast, 2019-2031
- 6.1. Market Analysis, Insights and Forecast - by Application
- 6.1.1. Electronic
- 6.1.2. Communication
- 6.1.3. Industry
- 6.1.4. Other
- 6.2. Market Analysis, Insights and Forecast - by Types
- 6.2.1. Surface Mount
- 6.2.2. Through Hole Mounting
- 6.2.3. Free Hanging
- 6.1. Market Analysis, Insights and Forecast - by Application
- 7. South America Plug-In Connector Analysis, Insights and Forecast, 2019-2031
- 7.1. Market Analysis, Insights and Forecast - by Application
- 7.1.1. Electronic
- 7.1.2. Communication
- 7.1.3. Industry
- 7.1.4. Other
- 7.2. Market Analysis, Insights and Forecast - by Types
- 7.2.1. Surface Mount
- 7.2.2. Through Hole Mounting
- 7.2.3. Free Hanging
- 7.1. Market Analysis, Insights and Forecast - by Application
- 8. Europe Plug-In Connector Analysis, Insights and Forecast, 2019-2031
- 8.1. Market Analysis, Insights and Forecast - by Application
- 8.1.1. Electronic
- 8.1.2. Communication
- 8.1.3. Industry
- 8.1.4. Other
- 8.2. Market Analysis, Insights and Forecast - by Types
- 8.2.1. Surface Mount
- 8.2.2. Through Hole Mounting
- 8.2.3. Free Hanging
- 8.1. Market Analysis, Insights and Forecast - by Application
- 9. Middle East & Africa Plug-In Connector Analysis, Insights and Forecast, 2019-2031
- 9.1. Market Analysis, Insights and Forecast - by Application
- 9.1.1. Electronic
- 9.1.2. Communication
- 9.1.3. Industry
- 9.1.4. Other
- 9.2. Market Analysis, Insights and Forecast - by Types
- 9.2.1. Surface Mount
- 9.2.2. Through Hole Mounting
- 9.2.3. Free Hanging
- 9.1. Market Analysis, Insights and Forecast - by Application
- 10. Asia Pacific Plug-In Connector Analysis, Insights and Forecast, 2019-2031
- 10.1. Market Analysis, Insights and Forecast - by Application
- 10.1.1. Electronic
- 10.1.2. Communication
- 10.1.3. Industry
- 10.1.4. Other
- 10.2. Market Analysis, Insights and Forecast - by Types
- 10.2.1. Surface Mount
- 10.2.2. Through Hole Mounting
- 10.2.3. Free Hanging
- 10.1. Market Analysis, Insights and Forecast - by Application
- 11. Competitive Analysis
- 11.1. Global Market Share Analysis 2024
- 11.2. Company Profiles
- 11.2.1 3M
- 11.2.1.1. Overview
- 11.2.1.2. Products
- 11.2.1.3. SWOT Analysis
- 11.2.1.4. Recent Developments
- 11.2.1.5. Financials (Based on Availability)
- 11.2.2 Adam Tech
- 11.2.2.1. Overview
- 11.2.2.2. Products
- 11.2.2.3. SWOT Analysis
- 11.2.2.4. Recent Developments
- 11.2.2.5. Financials (Based on Availability)
- 11.2.3 Amphenol ICC
- 11.2.3.1. Overview
- 11.2.3.2. Products
- 11.2.3.3. SWOT Analysis
- 11.2.3.4. Recent Developments
- 11.2.3.5. Financials (Based on Availability)
- 11.2.4 Assmann WSW Components
- 11.2.4.1. Overview
- 11.2.4.2. Products
- 11.2.4.3. SWOT Analysis
- 11.2.4.4. Recent Developments
- 11.2.4.5. Financials (Based on Availability)
- 11.2.5 EDAC Inc.
- 11.2.5.1. Overview
- 11.2.5.2. Products
- 11.2.5.3. SWOT Analysis
- 11.2.5.4. Recent Developments
- 11.2.5.5. Financials (Based on Availability)
- 11.2.6 Finisar Corporation
- 11.2.6.1. Overview
- 11.2.6.2. Products
- 11.2.6.3. SWOT Analysis
- 11.2.6.4. Recent Developments
- 11.2.6.5. Financials (Based on Availability)
- 11.2.7 HARTING
- 11.2.7.1. Overview
- 11.2.7.2. Products
- 11.2.7.3. SWOT Analysis
- 11.2.7.4. Recent Developments
- 11.2.7.5. Financials (Based on Availability)
- 11.2.8 Hirose Electric Co Ltd
- 11.2.8.1. Overview
- 11.2.8.2. Products
- 11.2.8.3. SWOT Analysis
- 11.2.8.4. Recent Developments
- 11.2.8.5. Financials (Based on Availability)
- 11.2.9 JAE Electronics
- 11.2.9.1. Overview
- 11.2.9.2. Products
- 11.2.9.3. SWOT Analysis
- 11.2.9.4. Recent Developments
- 11.2.9.5. Financials (Based on Availability)
- 11.2.10 KYOCERA AVX
- 11.2.10.1. Overview
- 11.2.10.2. Products
- 11.2.10.3. SWOT Analysis
- 11.2.10.4. Recent Developments
- 11.2.10.5. Financials (Based on Availability)
- 11.2.11 Molex
- 11.2.11.1. Overview
- 11.2.11.2. Products
- 11.2.11.3. SWOT Analysis
- 11.2.11.4. Recent Developments
- 11.2.11.5. Financials (Based on Availability)
- 11.2.12 NI
- 11.2.12.1. Overview
- 11.2.12.2. Products
- 11.2.12.3. SWOT Analysis
- 11.2.12.4. Recent Developments
- 11.2.12.5. Financials (Based on Availability)
- 11.2.13 Pulse Electronics
- 11.2.13.1. Overview
- 11.2.13.2. Products
- 11.2.13.3. SWOT Analysis
- 11.2.13.4. Recent Developments
- 11.2.13.5. Financials (Based on Availability)
- 11.2.14 Samtec Inc.
- 11.2.14.1. Overview
- 11.2.14.2. Products
- 11.2.14.3. SWOT Analysis
- 11.2.14.4. Recent Developments
- 11.2.14.5. Financials (Based on Availability)
- 11.2.15 Stewart Connector
- 11.2.15.1. Overview
- 11.2.15.2. Products
- 11.2.15.3. SWOT Analysis
- 11.2.15.4. Recent Developments
- 11.2.15.5. Financials (Based on Availability)
- 11.2.16 TE Connectivity AMP Connectors
- 11.2.16.1. Overview
- 11.2.16.2. Products
- 11.2.16.3. SWOT Analysis
- 11.2.16.4. Recent Developments
- 11.2.16.5. Financials (Based on Availability)
- 11.2.1 3M
List of Figures
- Figure 1: Global Plug-In Connector Revenue Breakdown (million, %) by Region 2024 & 2032
- Figure 2: Global Plug-In Connector Volume Breakdown (K, %) by Region 2024 & 2032
- Figure 3: North America Plug-In Connector Revenue (million), by Application 2024 & 2032
- Figure 4: North America Plug-In Connector Volume (K), by Application 2024 & 2032
- Figure 5: North America Plug-In Connector Revenue Share (%), by Application 2024 & 2032
- Figure 6: North America Plug-In Connector Volume Share (%), by Application 2024 & 2032
- Figure 7: North America Plug-In Connector Revenue (million), by Types 2024 & 2032
- Figure 8: North America Plug-In Connector Volume (K), by Types 2024 & 2032
- Figure 9: North America Plug-In Connector Revenue Share (%), by Types 2024 & 2032
- Figure 10: North America Plug-In Connector Volume Share (%), by Types 2024 & 2032
- Figure 11: North America Plug-In Connector Revenue (million), by Country 2024 & 2032
- Figure 12: North America Plug-In Connector Volume (K), by Country 2024 & 2032
- Figure 13: North America Plug-In Connector Revenue Share (%), by Country 2024 & 2032
- Figure 14: North America Plug-In Connector Volume Share (%), by Country 2024 & 2032
- Figure 15: South America Plug-In Connector Revenue (million), by Application 2024 & 2032
- Figure 16: South America Plug-In Connector Volume (K), by Application 2024 & 2032
- Figure 17: South America Plug-In Connector Revenue Share (%), by Application 2024 & 2032
- Figure 18: South America Plug-In Connector Volume Share (%), by Application 2024 & 2032
- Figure 19: South America Plug-In Connector Revenue (million), by Types 2024 & 2032
- Figure 20: South America Plug-In Connector Volume (K), by Types 2024 & 2032
- Figure 21: South America Plug-In Connector Revenue Share (%), by Types 2024 & 2032
- Figure 22: South America Plug-In Connector Volume Share (%), by Types 2024 & 2032
- Figure 23: South America Plug-In Connector Revenue (million), by Country 2024 & 2032
- Figure 24: South America Plug-In Connector Volume (K), by Country 2024 & 2032
- Figure 25: South America Plug-In Connector Revenue Share (%), by Country 2024 & 2032
- Figure 26: South America Plug-In Connector Volume Share (%), by Country 2024 & 2032
- Figure 27: Europe Plug-In Connector Revenue (million), by Application 2024 & 2032
- Figure 28: Europe Plug-In Connector Volume (K), by Application 2024 & 2032
- Figure 29: Europe Plug-In Connector Revenue Share (%), by Application 2024 & 2032
- Figure 30: Europe Plug-In Connector Volume Share (%), by Application 2024 & 2032
- Figure 31: Europe Plug-In Connector Revenue (million), by Types 2024 & 2032
- Figure 32: Europe Plug-In Connector Volume (K), by Types 2024 & 2032
- Figure 33: Europe Plug-In Connector Revenue Share (%), by Types 2024 & 2032
- Figure 34: Europe Plug-In Connector Volume Share (%), by Types 2024 & 2032
- Figure 35: Europe Plug-In Connector Revenue (million), by Country 2024 & 2032
- Figure 36: Europe Plug-In Connector Volume (K), by Country 2024 & 2032
- Figure 37: Europe Plug-In Connector Revenue Share (%), by Country 2024 & 2032
- Figure 38: Europe Plug-In Connector Volume Share (%), by Country 2024 & 2032
- Figure 39: Middle East & Africa Plug-In Connector Revenue (million), by Application 2024 & 2032
- Figure 40: Middle East & Africa Plug-In Connector Volume (K), by Application 2024 & 2032
- Figure 41: Middle East & Africa Plug-In Connector Revenue Share (%), by Application 2024 & 2032
- Figure 42: Middle East & Africa Plug-In Connector Volume Share (%), by Application 2024 & 2032
- Figure 43: Middle East & Africa Plug-In Connector Revenue (million), by Types 2024 & 2032
- Figure 44: Middle East & Africa Plug-In Connector Volume (K), by Types 2024 & 2032
- Figure 45: Middle East & Africa Plug-In Connector Revenue Share (%), by Types 2024 & 2032
- Figure 46: Middle East & Africa Plug-In Connector Volume Share (%), by Types 2024 & 2032
- Figure 47: Middle East & Africa Plug-In Connector Revenue (million), by Country 2024 & 2032
- Figure 48: Middle East & Africa Plug-In Connector Volume (K), by Country 2024 & 2032
- Figure 49: Middle East & Africa Plug-In Connector Revenue Share (%), by Country 2024 & 2032
- Figure 50: Middle East & Africa Plug-In Connector Volume Share (%), by Country 2024 & 2032
- Figure 51: Asia Pacific Plug-In Connector Revenue (million), by Application 2024 & 2032
- Figure 52: Asia Pacific Plug-In Connector Volume (K), by Application 2024 & 2032
- Figure 53: Asia Pacific Plug-In Connector Revenue Share (%), by Application 2024 & 2032
- Figure 54: Asia Pacific Plug-In Connector Volume Share (%), by Application 2024 & 2032
- Figure 55: Asia Pacific Plug-In Connector Revenue (million), by Types 2024 & 2032
- Figure 56: Asia Pacific Plug-In Connector Volume (K), by Types 2024 & 2032
- Figure 57: Asia Pacific Plug-In Connector Revenue Share (%), by Types 2024 & 2032
- Figure 58: Asia Pacific Plug-In Connector Volume Share (%), by Types 2024 & 2032
- Figure 59: Asia Pacific Plug-In Connector Revenue (million), by Country 2024 & 2032
- Figure 60: Asia Pacific Plug-In Connector Volume (K), by Country 2024 & 2032
- Figure 61: Asia Pacific Plug-In Connector Revenue Share (%), by Country 2024 & 2032
- Figure 62: Asia Pacific Plug-In Connector Volume Share (%), by Country 2024 & 2032
List of Tables
- Table 1: Global Plug-In Connector Revenue million Forecast, by Region 2019 & 2032
- Table 2: Global Plug-In Connector Volume K Forecast, by Region 2019 & 2032
- Table 3: Global Plug-In Connector Revenue million Forecast, by Application 2019 & 2032
- Table 4: Global Plug-In Connector Volume K Forecast, by Application 2019 & 2032
- Table 5: Global Plug-In Connector Revenue million Forecast, by Types 2019 & 2032
- Table 6: Global Plug-In Connector Volume K Forecast, by Types 2019 & 2032
- Table 7: Global Plug-In Connector Revenue million Forecast, by Region 2019 & 2032
- Table 8: Global Plug-In Connector Volume K Forecast, by Region 2019 & 2032
- Table 9: Global Plug-In Connector Revenue million Forecast, by Application 2019 & 2032
- Table 10: Global Plug-In Connector Volume K Forecast, by Application 2019 & 2032
- Table 11: Global Plug-In Connector Revenue million Forecast, by Types 2019 & 2032
- Table 12: Global Plug-In Connector Volume K Forecast, by Types 2019 & 2032
- Table 13: Global Plug-In Connector Revenue million Forecast, by Country 2019 & 2032
- Table 14: Global Plug-In Connector Volume K Forecast, by Country 2019 & 2032
- Table 15: United States Plug-In Connector Revenue (million) Forecast, by Application 2019 & 2032
- Table 16: United States Plug-In Connector Volume (K) Forecast, by Application 2019 & 2032
- Table 17: Canada Plug-In Connector Revenue (million) Forecast, by Application 2019 & 2032
- Table 18: Canada Plug-In Connector Volume (K) Forecast, by Application 2019 & 2032
- Table 19: Mexico Plug-In Connector Revenue (million) Forecast, by Application 2019 & 2032
- Table 20: Mexico Plug-In Connector Volume (K) Forecast, by Application 2019 & 2032
- Table 21: Global Plug-In Connector Revenue million Forecast, by Application 2019 & 2032
- Table 22: Global Plug-In Connector Volume K Forecast, by Application 2019 & 2032
- Table 23: Global Plug-In Connector Revenue million Forecast, by Types 2019 & 2032
- Table 24: Global Plug-In Connector Volume K Forecast, by Types 2019 & 2032
- Table 25: Global Plug-In Connector Revenue million Forecast, by Country 2019 & 2032
- Table 26: Global Plug-In Connector Volume K Forecast, by Country 2019 & 2032
- Table 27: Brazil Plug-In Connector Revenue (million) Forecast, by Application 2019 & 2032
- Table 28: Brazil Plug-In Connector Volume (K) Forecast, by Application 2019 & 2032
- Table 29: Argentina Plug-In Connector Revenue (million) Forecast, by Application 2019 & 2032
- Table 30: Argentina Plug-In Connector Volume (K) Forecast, by Application 2019 & 2032
- Table 31: Rest of South America Plug-In Connector Revenue (million) Forecast, by Application 2019 & 2032
- Table 32: Rest of South America Plug-In Connector Volume (K) Forecast, by Application 2019 & 2032
- Table 33: Global Plug-In Connector Revenue million Forecast, by Application 2019 & 2032
- Table 34: Global Plug-In Connector Volume K Forecast, by Application 2019 & 2032
- Table 35: Global Plug-In Connector Revenue million Forecast, by Types 2019 & 2032
- Table 36: Global Plug-In Connector Volume K Forecast, by Types 2019 & 2032
- Table 37: Global Plug-In Connector Revenue million Forecast, by Country 2019 & 2032
- Table 38: Global Plug-In Connector Volume K Forecast, by Country 2019 & 2032
- Table 39: United Kingdom Plug-In Connector Revenue (million) Forecast, by Application 2019 & 2032
- Table 40: United Kingdom Plug-In Connector Volume (K) Forecast, by Application 2019 & 2032
- Table 41: Germany Plug-In Connector Revenue (million) Forecast, by Application 2019 & 2032
- Table 42: Germany Plug-In Connector Volume (K) Forecast, by Application 2019 & 2032
- Table 43: France Plug-In Connector Revenue (million) Forecast, by Application 2019 & 2032
- Table 44: France Plug-In Connector Volume (K) Forecast, by Application 2019 & 2032
- Table 45: Italy Plug-In Connector Revenue (million) Forecast, by Application 2019 & 2032
- Table 46: Italy Plug-In Connector Volume (K) Forecast, by Application 2019 & 2032
- Table 47: Spain Plug-In Connector Revenue (million) Forecast, by Application 2019 & 2032
- Table 48: Spain Plug-In Connector Volume (K) Forecast, by Application 2019 & 2032
- Table 49: Russia Plug-In Connector Revenue (million) Forecast, by Application 2019 & 2032
- Table 50: Russia Plug-In Connector Volume (K) Forecast, by Application 2019 & 2032
- Table 51: Benelux Plug-In Connector Revenue (million) Forecast, by Application 2019 & 2032
- Table 52: Benelux Plug-In Connector Volume (K) Forecast, by Application 2019 & 2032
- Table 53: Nordics Plug-In Connector Revenue (million) Forecast, by Application 2019 & 2032
- Table 54: Nordics Plug-In Connector Volume (K) Forecast, by Application 2019 & 2032
- Table 55: Rest of Europe Plug-In Connector Revenue (million) Forecast, by Application 2019 & 2032
- Table 56: Rest of Europe Plug-In Connector Volume (K) Forecast, by Application 2019 & 2032
- Table 57: Global Plug-In Connector Revenue million Forecast, by Application 2019 & 2032
- Table 58: Global Plug-In Connector Volume K Forecast, by Application 2019 & 2032
- Table 59: Global Plug-In Connector Revenue million Forecast, by Types 2019 & 2032
- Table 60: Global Plug-In Connector Volume K Forecast, by Types 2019 & 2032
- Table 61: Global Plug-In Connector Revenue million Forecast, by Country 2019 & 2032
- Table 62: Global Plug-In Connector Volume K Forecast, by Country 2019 & 2032
- Table 63: Turkey Plug-In Connector Revenue (million) Forecast, by Application 2019 & 2032
- Table 64: Turkey Plug-In Connector Volume (K) Forecast, by Application 2019 & 2032
- Table 65: Israel Plug-In Connector Revenue (million) Forecast, by Application 2019 & 2032
- Table 66: Israel Plug-In Connector Volume (K) Forecast, by Application 2019 & 2032
- Table 67: GCC Plug-In Connector Revenue (million) Forecast, by Application 2019 & 2032
- Table 68: GCC Plug-In Connector Volume (K) Forecast, by Application 2019 & 2032
- Table 69: North Africa Plug-In Connector Revenue (million) Forecast, by Application 2019 & 2032
- Table 70: North Africa Plug-In Connector Volume (K) Forecast, by Application 2019 & 2032
- Table 71: South Africa Plug-In Connector Revenue (million) Forecast, by Application 2019 & 2032
- Table 72: South Africa Plug-In Connector Volume (K) Forecast, by Application 2019 & 2032
- Table 73: Rest of Middle East & Africa Plug-In Connector Revenue (million) Forecast, by Application 2019 & 2032
- Table 74: Rest of Middle East & Africa Plug-In Connector Volume (K) Forecast, by Application 2019 & 2032
- Table 75: Global Plug-In Connector Revenue million Forecast, by Application 2019 & 2032
- Table 76: Global Plug-In Connector Volume K Forecast, by Application 2019 & 2032
- Table 77: Global Plug-In Connector Revenue million Forecast, by Types 2019 & 2032
- Table 78: Global Plug-In Connector Volume K Forecast, by Types 2019 & 2032
- Table 79: Global Plug-In Connector Revenue million Forecast, by Country 2019 & 2032
- Table 80: Global Plug-In Connector Volume K Forecast, by Country 2019 & 2032
- Table 81: China Plug-In Connector Revenue (million) Forecast, by Application 2019 & 2032
- Table 82: China Plug-In Connector Volume (K) Forecast, by Application 2019 & 2032
- Table 83: India Plug-In Connector Revenue (million) Forecast, by Application 2019 & 2032
- Table 84: India Plug-In Connector Volume (K) Forecast, by Application 2019 & 2032
- Table 85: Japan Plug-In Connector Revenue (million) Forecast, by Application 2019 & 2032
- Table 86: Japan Plug-In Connector Volume (K) Forecast, by Application 2019 & 2032
- Table 87: South Korea Plug-In Connector Revenue (million) Forecast, by Application 2019 & 2032
- Table 88: South Korea Plug-In Connector Volume (K) Forecast, by Application 2019 & 2032
- Table 89: ASEAN Plug-In Connector Revenue (million) Forecast, by Application 2019 & 2032
- Table 90: ASEAN Plug-In Connector Volume (K) Forecast, by Application 2019 & 2032
- Table 91: Oceania Plug-In Connector Revenue (million) Forecast, by Application 2019 & 2032
- Table 92: Oceania Plug-In Connector Volume (K) Forecast, by Application 2019 & 2032
- Table 93: Rest of Asia Pacific Plug-In Connector Revenue (million) Forecast, by Application 2019 & 2032
- Table 94: Rest of Asia Pacific Plug-In Connector Volume (K) Forecast, by Application 2019 & 2032
Frequently Asked Questions
1. What is the projected Compound Annual Growth Rate (CAGR) of the Plug-In Connector?
The projected CAGR is approximately XX%.
2. Which companies are prominent players in the Plug-In Connector?
Key companies in the market include 3M, Adam Tech, Amphenol ICC, Assmann WSW Components, EDAC Inc., Finisar Corporation, HARTING, Hirose Electric Co Ltd, JAE Electronics, KYOCERA AVX, Molex, NI, Pulse Electronics, Samtec Inc., Stewart Connector, TE Connectivity AMP Connectors.
3. What are the main segments of the Plug-In Connector?
The market segments include Application, Types.
4. Can you provide details about the market size?
The market size is estimated to be USD XXX million as of 2022.
5. What are some drivers contributing to market growth?
N/A
6. What are the notable trends driving market growth?
N/A
7. Are there any restraints impacting market growth?
N/A
8. Can you provide examples of recent developments in the market?
N/A
9. What pricing options are available for accessing the report?
Pricing options include single-user, multi-user, and enterprise licenses priced at USD 3350.00, USD 5025.00, and USD 6700.00 respectively.
10. Is the market size provided in terms of value or volume?
The market size is provided in terms of value, measured in million and volume, measured in K.
11. Are there any specific market keywords associated with the report?
Yes, the market keyword associated with the report is "Plug-In Connector," which aids in identifying and referencing the specific market segment covered.
12. How do I determine which pricing option suits my needs best?
The pricing options vary based on user requirements and access needs. Individual users may opt for single-user licenses, while businesses requiring broader access may choose multi-user or enterprise licenses for cost-effective access to the report.
13. Are there any additional resources or data provided in the Plug-In Connector report?
While the report offers comprehensive insights, it's advisable to review the specific contents or supplementary materials provided to ascertain if additional resources or data are available.
14. How can I stay updated on further developments or reports in the Plug-In Connector?
To stay informed about further developments, trends, and reports in the Plug-In Connector, consider subscribing to industry newsletters, following relevant companies and organizations, or regularly checking reputable industry news sources and publications.
Methodology
Step 1 - Identification of Relevant Samples Size from Population Database


Step 2 - Approaches for Defining Global Market Size (Value, Volume* & Price*)

Note*: In applicable scenarios
Step 3 - Data Sources
Primary Research
- Web Analytics
- Survey Reports
- Research Institute
- Latest Research Reports
- Opinion Leaders
Secondary Research
- Annual Reports
- White Paper
- Latest Press Release
- Industry Association
- Paid Database
- Investor Presentations

Step 4 - Data Triangulation
Involves using different sources of information in order to increase the validity of a study
These sources are likely to be stakeholders in a program - participants, other researchers, program staff, other community members, and so on.
Then we put all data in single framework & apply various statistical tools to find out the dynamic on the market.
During the analysis stage, feedback from the stakeholder groups would be compared to determine areas of agreement as well as areas of divergence
