

Key Insights
The portable X-ray machine market is experiencing robust growth, driven by increasing demand for point-of-care diagnostics, advancements in digital imaging technology, and a rising prevalence of chronic diseases requiring frequent monitoring. The market's expansion is further fueled by the growing adoption of portable X-ray systems in emergency medical services, ambulances, and remote healthcare settings. Technological innovations like wireless connectivity, improved image quality, and smaller, lighter designs are making these devices more accessible and user-friendly, leading to wider adoption across diverse healthcare facilities. While the initial investment cost can be a barrier for some smaller clinics, the long-term cost-effectiveness and efficiency gains often outweigh the initial expense, contributing to market expansion. Competition among established players like Siemens, GE Healthcare, and Philips, alongside emerging players, fosters innovation and drives down prices, making portable X-ray machines increasingly affordable and accessible globally.
The market is segmented by various factors, including device type (digital vs. analog), application (diagnosis, therapy monitoring), and end-user (hospitals, clinics, ambulances). The digital portable X-ray segment is expected to witness significant growth due to its superior image quality, ease of storage, and integration with hospital information systems. The rising geriatric population, the increasing incidence of trauma cases, and the expansion of healthcare infrastructure in developing economies are all key factors contributing to the market's considerable growth potential over the forecast period. However, regulatory hurdles and the need for skilled technicians can pose challenges to market penetration in certain regions. Despite these restraints, the overall market trajectory points towards a sustained and significant expansion driven by technological advancements and evolving healthcare needs.
Portable X-Ray Machines Market Report: 2019-2033
This comprehensive report provides an in-depth analysis of the global portable X-ray machines market, encompassing historical data (2019-2024), current estimations (2025), and future forecasts (2025-2033). The report meticulously examines market dynamics, growth trends, regional dominance, product innovation, and competitive landscape, providing valuable insights for industry professionals, investors, and strategic decision-makers. The parent market is the medical imaging equipment market, while the child market is the portable diagnostic imaging equipment segment. The market size is projected to reach xx million units by 2033.
Portable X-Ray Machines Market Dynamics & Structure
This section analyzes the competitive intensity, technological advancements, regulatory landscape, and market evolution within the portable X-ray machines sector. We delve into the impact of mergers and acquisitions (M&A) activity and provide a granular view of market concentration.
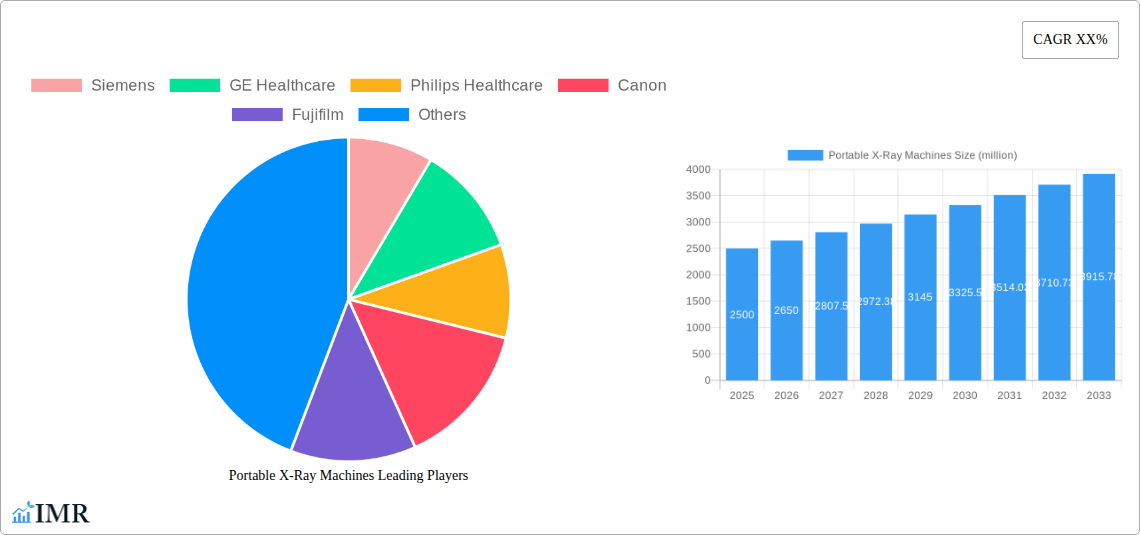
- Market Concentration: The market exhibits a moderately concentrated structure, with key players like Siemens, GE Healthcare, and Philips Healthcare holding significant market share. However, the presence of several smaller, specialized companies fosters competition and innovation. The combined market share of the top 5 players is estimated at 60% in 2025.
- Technological Innovation: Ongoing advancements in digital imaging technology, detector array miniaturization, and wireless connectivity are key drivers of market growth. The adoption of AI-powered image analysis tools is also gaining traction. However, high R&D costs and regulatory approvals pose significant barriers to innovation.
- Regulatory Frameworks: Stringent regulatory approvals from bodies like the FDA and other global health agencies impact product launch timelines and market entry strategies. Compliance with radiation safety standards is crucial and influences product design and manufacturing processes.
- Competitive Product Substitutes: Ultrasound and MRI machines represent alternative diagnostic imaging technologies, presenting competitive pressure. However, the portability and affordability of portable X-ray machines ensure their continued relevance in various healthcare settings.
- End-User Demographics: The primary end-users include hospitals, clinics, emergency medical services (EMS), and veterinary clinics. The increasing prevalence of chronic diseases and aging populations are driving market demand across all segments.
- M&A Trends: The last 5 years witnessed xx M&A deals in the portable X-ray machine segment, primarily driven by companies aiming to expand their product portfolios and geographical reach. These transactions often involved smaller companies with specialized technologies being acquired by established players.
Portable X-Ray Machines Growth Trends & Insights
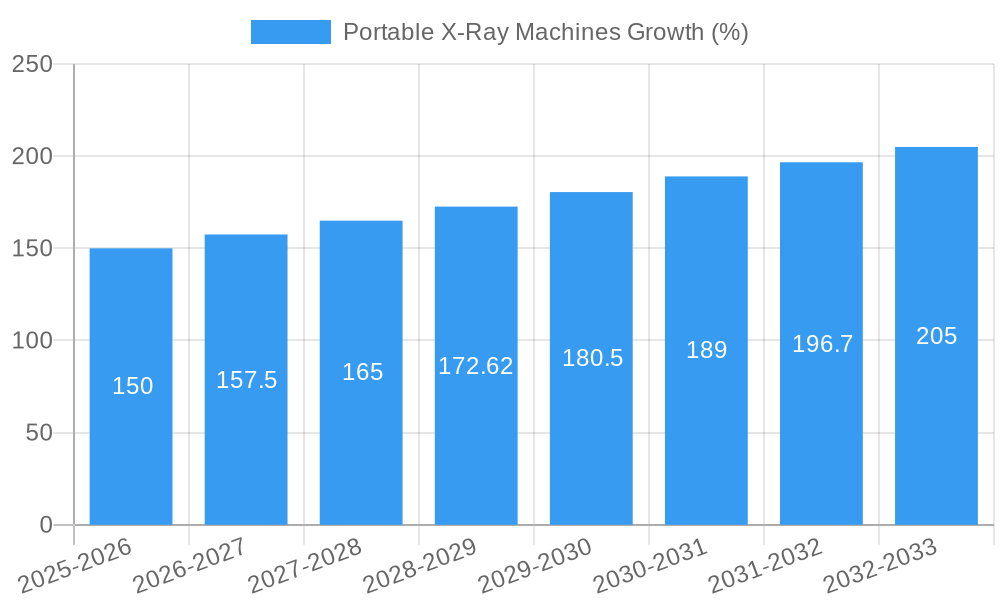
This section details the historical and projected growth trajectory of the portable X-ray machine market, analyzing factors influencing adoption rates and technological disruptions. The market experienced a CAGR of xx% during 2019-2024.
The market is projected to grow at a CAGR of xx% during 2025-2033. This growth is attributed to several key factors including rising demand for point-of-care diagnostics, an increasing number of emergency medical services, technological advancements leading to improved image quality and reduced radiation exposure, and the growing adoption of portable X-ray machines in developing countries. Consumer behavior shifts towards preference for portable and wireless systems that facilitate ease of use and reduce operational costs are also fueling market expansion. Market penetration in developing economies remains low, presenting a significant opportunity for growth.
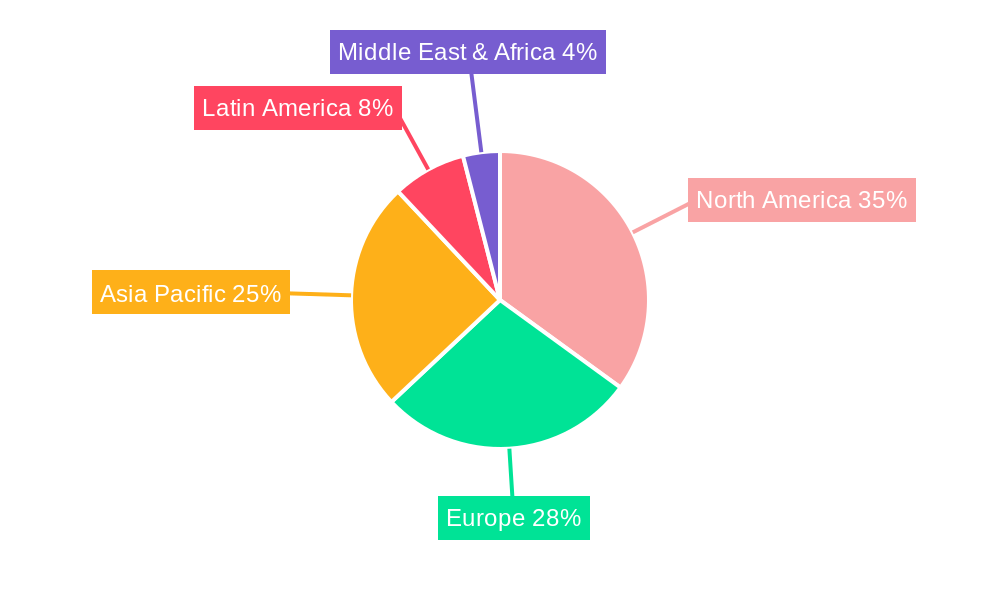
Dominant Regions, Countries, or Segments in Portable X-Ray Machines
North America currently dominates the portable X-ray machines market, driven by high healthcare expenditure and technological advancements. However, the Asia-Pacific region exhibits the highest growth potential due to its expanding healthcare infrastructure and rising incidence of chronic diseases.
- North America: High adoption rates in hospitals and clinics, coupled with a robust regulatory framework, contribute to market dominance. Advanced healthcare infrastructure and substantial investments in medical technology are key driving forces.
- Europe: A well-established healthcare system and government initiatives supporting advanced medical technologies contribute to steady market growth. Stringent regulations, however, can influence the pace of adoption.
- Asia-Pacific: Rapid economic growth, increasing healthcare expenditure, and expanding healthcare infrastructure in developing countries drive substantial growth potential. A rising prevalence of chronic diseases also fuels demand for improved diagnostic tools.
Portable X-Ray Machines Product Landscape
Portable X-ray machines have evolved significantly, featuring enhanced image quality, reduced radiation exposure, and improved portability. Digital detectors, wireless connectivity, and integrated image processing capabilities are defining features of modern systems. Unique selling propositions often center on ease of use, portability, and superior image quality. Manufacturers are increasingly focusing on developing compact, lightweight systems with advanced features to cater to diverse healthcare settings and applications.
Key Drivers, Barriers & Challenges in Portable X-Ray Machines
Key Drivers:
- Growing demand for point-of-care diagnostics.
- Increasing prevalence of chronic diseases.
- Technological advancements leading to improved image quality and reduced radiation exposure.
- Growing adoption of portable X-ray machines in developing countries.
- Rise in the number of emergency medical services (EMS).
Challenges & Restraints:
- High initial investment costs can hinder adoption, particularly in resource-constrained settings.
- Stringent regulatory approvals and compliance requirements can create barriers to market entry for new players.
- Intense competition from established players and the emergence of alternative diagnostic imaging modalities presents challenges for growth. This competitive pressure might affect pricing strategies and profit margins. Supply chain disruptions can impact the availability of components and lead to production delays and increased costs.
Emerging Opportunities in Portable X-Ray Machines
Emerging opportunities include:
- Expanding into untapped markets in developing countries.
- Development of AI-powered image analysis tools for improved diagnostic accuracy.
- Integration of telemedicine platforms for remote diagnosis and consultation.
- Development of specialized portable X-ray systems for specific applications (e.g., veterinary medicine).
Growth Accelerators in the Portable X-Ray Machines Industry
Strategic partnerships between manufacturers and healthcare providers, coupled with ongoing technological innovations, are key catalysts for long-term market growth. Expanding into new geographical regions and developing customized solutions for diverse healthcare settings will further propel market expansion. Government initiatives promoting the adoption of advanced medical technologies in healthcare will also significantly accelerate market growth.
Key Players Shaping the Portable X-Ray Machines Market
- Siemens
- GE Healthcare
- Philips Healthcare
- Canon
- Fujifilm
- Konica Minolta Healthcare
- Hitachi
- MinXray,Inc
- Shimadzu
- Samsung Healthcare
- Wandong Medical Equipment
- Wandong Dingli Medical Equipment
Notable Milestones in Portable X-Ray Machines Sector
- 2020: Introduction of a new generation of wireless portable X-ray systems with enhanced image quality and reduced radiation exposure by several key players.
- 2022: Strategic partnership between a major manufacturer and a leading healthcare provider to expand the deployment of portable X-ray machines in rural areas.
- 2023: FDA approval of a novel portable X-ray system with AI-powered image analysis capabilities.
In-Depth Portable X-Ray Machines Market Outlook
The future of the portable X-ray machines market is promising, driven by technological advancements, increasing demand for point-of-care diagnostics, and expansion into new markets. Strategic investments in R&D, focusing on enhanced portability, improved image quality, and AI-powered functionalities, will be crucial for sustained growth. Manufacturers need to adapt to the evolving regulatory landscape and capitalize on the expanding opportunities in developing countries to unlock significant future market potential.
Portable X-Ray Machines Segmentation
-
1. Application
- 1.1. Dental
- 1.2. Orthopedics
- 1.3. General Surgery
- 1.4. Others
-
2. Types
- 2.1. Motorized Mobile X-ray Machines
- 2.2. Manual Driven Mobile X-ray Machines
Portable X-Ray Machines Segmentation By Geography
-
1. North America
- 1.1. United States
- 1.2. Canada
- 1.3. Mexico
-
2. South America
- 2.1. Brazil
- 2.2. Argentina
- 2.3. Rest of South America
-
3. Europe
- 3.1. United Kingdom
- 3.2. Germany
- 3.3. France
- 3.4. Italy
- 3.5. Spain
- 3.6. Russia
- 3.7. Benelux
- 3.8. Nordics
- 3.9. Rest of Europe
-
4. Middle East & Africa
- 4.1. Turkey
- 4.2. Israel
- 4.3. GCC
- 4.4. North Africa
- 4.5. South Africa
- 4.6. Rest of Middle East & Africa
-
5. Asia Pacific
- 5.1. China
- 5.2. India
- 5.3. Japan
- 5.4. South Korea
- 5.5. ASEAN
- 5.6. Oceania
- 5.7. Rest of Asia Pacific
Portable X-Ray Machines REPORT HIGHLIGHTS
| Aspects | Details |
|---|---|
| Study Period | 2019-2033 |
| Base Year | 2024 |
| Estimated Year | 2025 |
| Forecast Period | 2025-2033 |
| Historical Period | 2019-2024 |
| Growth Rate | CAGR of XX% from 2019-2033 |
| Segmentation |
|
Table of Contents
- 1. Introduction
- 1.1. Research Scope
- 1.2. Market Segmentation
- 1.3. Research Methodology
- 1.4. Definitions and Assumptions
- 2. Executive Summary
- 2.1. Introduction
- 3. Market Dynamics
- 3.1. Introduction
- 3.2. Market Drivers
- 3.3. Market Restrains
- 3.4. Market Trends
- 4. Market Factor Analysis
- 4.1. Porters Five Forces
- 4.2. Supply/Value Chain
- 4.3. PESTEL analysis
- 4.4. Market Entropy
- 4.5. Patent/Trademark Analysis
- 5. Global Portable X-Ray Machines Analysis, Insights and Forecast, 2019-2031
- 5.1. Market Analysis, Insights and Forecast - by Application
- 5.1.1. Dental
- 5.1.2. Orthopedics
- 5.1.3. General Surgery
- 5.1.4. Others
- 5.2. Market Analysis, Insights and Forecast - by Types
- 5.2.1. Motorized Mobile X-ray Machines
- 5.2.2. Manual Driven Mobile X-ray Machines
- 5.3. Market Analysis, Insights and Forecast - by Region
- 5.3.1. North America
- 5.3.2. South America
- 5.3.3. Europe
- 5.3.4. Middle East & Africa
- 5.3.5. Asia Pacific
- 5.1. Market Analysis, Insights and Forecast - by Application
- 6. North America Portable X-Ray Machines Analysis, Insights and Forecast, 2019-2031
- 6.1. Market Analysis, Insights and Forecast - by Application
- 6.1.1. Dental
- 6.1.2. Orthopedics
- 6.1.3. General Surgery
- 6.1.4. Others
- 6.2. Market Analysis, Insights and Forecast - by Types
- 6.2.1. Motorized Mobile X-ray Machines
- 6.2.2. Manual Driven Mobile X-ray Machines
- 6.1. Market Analysis, Insights and Forecast - by Application
- 7. South America Portable X-Ray Machines Analysis, Insights and Forecast, 2019-2031
- 7.1. Market Analysis, Insights and Forecast - by Application
- 7.1.1. Dental
- 7.1.2. Orthopedics
- 7.1.3. General Surgery
- 7.1.4. Others
- 7.2. Market Analysis, Insights and Forecast - by Types
- 7.2.1. Motorized Mobile X-ray Machines
- 7.2.2. Manual Driven Mobile X-ray Machines
- 7.1. Market Analysis, Insights and Forecast - by Application
- 8. Europe Portable X-Ray Machines Analysis, Insights and Forecast, 2019-2031
- 8.1. Market Analysis, Insights and Forecast - by Application
- 8.1.1. Dental
- 8.1.2. Orthopedics
- 8.1.3. General Surgery
- 8.1.4. Others
- 8.2. Market Analysis, Insights and Forecast - by Types
- 8.2.1. Motorized Mobile X-ray Machines
- 8.2.2. Manual Driven Mobile X-ray Machines
- 8.1. Market Analysis, Insights and Forecast - by Application
- 9. Middle East & Africa Portable X-Ray Machines Analysis, Insights and Forecast, 2019-2031
- 9.1. Market Analysis, Insights and Forecast - by Application
- 9.1.1. Dental
- 9.1.2. Orthopedics
- 9.1.3. General Surgery
- 9.1.4. Others
- 9.2. Market Analysis, Insights and Forecast - by Types
- 9.2.1. Motorized Mobile X-ray Machines
- 9.2.2. Manual Driven Mobile X-ray Machines
- 9.1. Market Analysis, Insights and Forecast - by Application
- 10. Asia Pacific Portable X-Ray Machines Analysis, Insights and Forecast, 2019-2031
- 10.1. Market Analysis, Insights and Forecast - by Application
- 10.1.1. Dental
- 10.1.2. Orthopedics
- 10.1.3. General Surgery
- 10.1.4. Others
- 10.2. Market Analysis, Insights and Forecast - by Types
- 10.2.1. Motorized Mobile X-ray Machines
- 10.2.2. Manual Driven Mobile X-ray Machines
- 10.1. Market Analysis, Insights and Forecast - by Application
- 11. Competitive Analysis
- 11.1. Global Market Share Analysis 2024
- 11.2. Company Profiles
- 11.2.1 Siemens
- 11.2.1.1. Overview
- 11.2.1.2. Products
- 11.2.1.3. SWOT Analysis
- 11.2.1.4. Recent Developments
- 11.2.1.5. Financials (Based on Availability)
- 11.2.2 GE Healthcare
- 11.2.2.1. Overview
- 11.2.2.2. Products
- 11.2.2.3. SWOT Analysis
- 11.2.2.4. Recent Developments
- 11.2.2.5. Financials (Based on Availability)
- 11.2.3 Philips Healthcare
- 11.2.3.1. Overview
- 11.2.3.2. Products
- 11.2.3.3. SWOT Analysis
- 11.2.3.4. Recent Developments
- 11.2.3.5. Financials (Based on Availability)
- 11.2.4 Canon
- 11.2.4.1. Overview
- 11.2.4.2. Products
- 11.2.4.3. SWOT Analysis
- 11.2.4.4. Recent Developments
- 11.2.4.5. Financials (Based on Availability)
- 11.2.5 Fujifilm
- 11.2.5.1. Overview
- 11.2.5.2. Products
- 11.2.5.3. SWOT Analysis
- 11.2.5.4. Recent Developments
- 11.2.5.5. Financials (Based on Availability)
- 11.2.6 Konica Minolta Healthcare
- 11.2.6.1. Overview
- 11.2.6.2. Products
- 11.2.6.3. SWOT Analysis
- 11.2.6.4. Recent Developments
- 11.2.6.5. Financials (Based on Availability)
- 11.2.7 Hitachi
- 11.2.7.1. Overview
- 11.2.7.2. Products
- 11.2.7.3. SWOT Analysis
- 11.2.7.4. Recent Developments
- 11.2.7.5. Financials (Based on Availability)
- 11.2.8 MinXray
- 11.2.8.1. Overview
- 11.2.8.2. Products
- 11.2.8.3. SWOT Analysis
- 11.2.8.4. Recent Developments
- 11.2.8.5. Financials (Based on Availability)
- 11.2.9 Inc
- 11.2.9.1. Overview
- 11.2.9.2. Products
- 11.2.9.3. SWOT Analysis
- 11.2.9.4. Recent Developments
- 11.2.9.5. Financials (Based on Availability)
- 11.2.10 Shimadzu
- 11.2.10.1. Overview
- 11.2.10.2. Products
- 11.2.10.3. SWOT Analysis
- 11.2.10.4. Recent Developments
- 11.2.10.5. Financials (Based on Availability)
- 11.2.11 Samsung Healthcare
- 11.2.11.1. Overview
- 11.2.11.2. Products
- 11.2.11.3. SWOT Analysis
- 11.2.11.4. Recent Developments
- 11.2.11.5. Financials (Based on Availability)
- 11.2.12 Wandong Medical Equipment
- 11.2.12.1. Overview
- 11.2.12.2. Products
- 11.2.12.3. SWOT Analysis
- 11.2.12.4. Recent Developments
- 11.2.12.5. Financials (Based on Availability)
- 11.2.13 Wandong Dingli Medical Equipment
- 11.2.13.1. Overview
- 11.2.13.2. Products
- 11.2.13.3. SWOT Analysis
- 11.2.13.4. Recent Developments
- 11.2.13.5. Financials (Based on Availability)
- 11.2.1 Siemens
List of Figures
- Figure 1: Global Portable X-Ray Machines Revenue Breakdown (million, %) by Region 2024 & 2032
- Figure 2: Global Portable X-Ray Machines Volume Breakdown (K, %) by Region 2024 & 2032
- Figure 3: North America Portable X-Ray Machines Revenue (million), by Application 2024 & 2032
- Figure 4: North America Portable X-Ray Machines Volume (K), by Application 2024 & 2032
- Figure 5: North America Portable X-Ray Machines Revenue Share (%), by Application 2024 & 2032
- Figure 6: North America Portable X-Ray Machines Volume Share (%), by Application 2024 & 2032
- Figure 7: North America Portable X-Ray Machines Revenue (million), by Types 2024 & 2032
- Figure 8: North America Portable X-Ray Machines Volume (K), by Types 2024 & 2032
- Figure 9: North America Portable X-Ray Machines Revenue Share (%), by Types 2024 & 2032
- Figure 10: North America Portable X-Ray Machines Volume Share (%), by Types 2024 & 2032
- Figure 11: North America Portable X-Ray Machines Revenue (million), by Country 2024 & 2032
- Figure 12: North America Portable X-Ray Machines Volume (K), by Country 2024 & 2032
- Figure 13: North America Portable X-Ray Machines Revenue Share (%), by Country 2024 & 2032
- Figure 14: North America Portable X-Ray Machines Volume Share (%), by Country 2024 & 2032
- Figure 15: South America Portable X-Ray Machines Revenue (million), by Application 2024 & 2032
- Figure 16: South America Portable X-Ray Machines Volume (K), by Application 2024 & 2032
- Figure 17: South America Portable X-Ray Machines Revenue Share (%), by Application 2024 & 2032
- Figure 18: South America Portable X-Ray Machines Volume Share (%), by Application 2024 & 2032
- Figure 19: South America Portable X-Ray Machines Revenue (million), by Types 2024 & 2032
- Figure 20: South America Portable X-Ray Machines Volume (K), by Types 2024 & 2032
- Figure 21: South America Portable X-Ray Machines Revenue Share (%), by Types 2024 & 2032
- Figure 22: South America Portable X-Ray Machines Volume Share (%), by Types 2024 & 2032
- Figure 23: South America Portable X-Ray Machines Revenue (million), by Country 2024 & 2032
- Figure 24: South America Portable X-Ray Machines Volume (K), by Country 2024 & 2032
- Figure 25: South America Portable X-Ray Machines Revenue Share (%), by Country 2024 & 2032
- Figure 26: South America Portable X-Ray Machines Volume Share (%), by Country 2024 & 2032
- Figure 27: Europe Portable X-Ray Machines Revenue (million), by Application 2024 & 2032
- Figure 28: Europe Portable X-Ray Machines Volume (K), by Application 2024 & 2032
- Figure 29: Europe Portable X-Ray Machines Revenue Share (%), by Application 2024 & 2032
- Figure 30: Europe Portable X-Ray Machines Volume Share (%), by Application 2024 & 2032
- Figure 31: Europe Portable X-Ray Machines Revenue (million), by Types 2024 & 2032
- Figure 32: Europe Portable X-Ray Machines Volume (K), by Types 2024 & 2032
- Figure 33: Europe Portable X-Ray Machines Revenue Share (%), by Types 2024 & 2032
- Figure 34: Europe Portable X-Ray Machines Volume Share (%), by Types 2024 & 2032
- Figure 35: Europe Portable X-Ray Machines Revenue (million), by Country 2024 & 2032
- Figure 36: Europe Portable X-Ray Machines Volume (K), by Country 2024 & 2032
- Figure 37: Europe Portable X-Ray Machines Revenue Share (%), by Country 2024 & 2032
- Figure 38: Europe Portable X-Ray Machines Volume Share (%), by Country 2024 & 2032
- Figure 39: Middle East & Africa Portable X-Ray Machines Revenue (million), by Application 2024 & 2032
- Figure 40: Middle East & Africa Portable X-Ray Machines Volume (K), by Application 2024 & 2032
- Figure 41: Middle East & Africa Portable X-Ray Machines Revenue Share (%), by Application 2024 & 2032
- Figure 42: Middle East & Africa Portable X-Ray Machines Volume Share (%), by Application 2024 & 2032
- Figure 43: Middle East & Africa Portable X-Ray Machines Revenue (million), by Types 2024 & 2032
- Figure 44: Middle East & Africa Portable X-Ray Machines Volume (K), by Types 2024 & 2032
- Figure 45: Middle East & Africa Portable X-Ray Machines Revenue Share (%), by Types 2024 & 2032
- Figure 46: Middle East & Africa Portable X-Ray Machines Volume Share (%), by Types 2024 & 2032
- Figure 47: Middle East & Africa Portable X-Ray Machines Revenue (million), by Country 2024 & 2032
- Figure 48: Middle East & Africa Portable X-Ray Machines Volume (K), by Country 2024 & 2032
- Figure 49: Middle East & Africa Portable X-Ray Machines Revenue Share (%), by Country 2024 & 2032
- Figure 50: Middle East & Africa Portable X-Ray Machines Volume Share (%), by Country 2024 & 2032
- Figure 51: Asia Pacific Portable X-Ray Machines Revenue (million), by Application 2024 & 2032
- Figure 52: Asia Pacific Portable X-Ray Machines Volume (K), by Application 2024 & 2032
- Figure 53: Asia Pacific Portable X-Ray Machines Revenue Share (%), by Application 2024 & 2032
- Figure 54: Asia Pacific Portable X-Ray Machines Volume Share (%), by Application 2024 & 2032
- Figure 55: Asia Pacific Portable X-Ray Machines Revenue (million), by Types 2024 & 2032
- Figure 56: Asia Pacific Portable X-Ray Machines Volume (K), by Types 2024 & 2032
- Figure 57: Asia Pacific Portable X-Ray Machines Revenue Share (%), by Types 2024 & 2032
- Figure 58: Asia Pacific Portable X-Ray Machines Volume Share (%), by Types 2024 & 2032
- Figure 59: Asia Pacific Portable X-Ray Machines Revenue (million), by Country 2024 & 2032
- Figure 60: Asia Pacific Portable X-Ray Machines Volume (K), by Country 2024 & 2032
- Figure 61: Asia Pacific Portable X-Ray Machines Revenue Share (%), by Country 2024 & 2032
- Figure 62: Asia Pacific Portable X-Ray Machines Volume Share (%), by Country 2024 & 2032
List of Tables
- Table 1: Global Portable X-Ray Machines Revenue million Forecast, by Region 2019 & 2032
- Table 2: Global Portable X-Ray Machines Volume K Forecast, by Region 2019 & 2032
- Table 3: Global Portable X-Ray Machines Revenue million Forecast, by Application 2019 & 2032
- Table 4: Global Portable X-Ray Machines Volume K Forecast, by Application 2019 & 2032
- Table 5: Global Portable X-Ray Machines Revenue million Forecast, by Types 2019 & 2032
- Table 6: Global Portable X-Ray Machines Volume K Forecast, by Types 2019 & 2032
- Table 7: Global Portable X-Ray Machines Revenue million Forecast, by Region 2019 & 2032
- Table 8: Global Portable X-Ray Machines Volume K Forecast, by Region 2019 & 2032
- Table 9: Global Portable X-Ray Machines Revenue million Forecast, by Application 2019 & 2032
- Table 10: Global Portable X-Ray Machines Volume K Forecast, by Application 2019 & 2032
- Table 11: Global Portable X-Ray Machines Revenue million Forecast, by Types 2019 & 2032
- Table 12: Global Portable X-Ray Machines Volume K Forecast, by Types 2019 & 2032
- Table 13: Global Portable X-Ray Machines Revenue million Forecast, by Country 2019 & 2032
- Table 14: Global Portable X-Ray Machines Volume K Forecast, by Country 2019 & 2032
- Table 15: United States Portable X-Ray Machines Revenue (million) Forecast, by Application 2019 & 2032
- Table 16: United States Portable X-Ray Machines Volume (K) Forecast, by Application 2019 & 2032
- Table 17: Canada Portable X-Ray Machines Revenue (million) Forecast, by Application 2019 & 2032
- Table 18: Canada Portable X-Ray Machines Volume (K) Forecast, by Application 2019 & 2032
- Table 19: Mexico Portable X-Ray Machines Revenue (million) Forecast, by Application 2019 & 2032
- Table 20: Mexico Portable X-Ray Machines Volume (K) Forecast, by Application 2019 & 2032
- Table 21: Global Portable X-Ray Machines Revenue million Forecast, by Application 2019 & 2032
- Table 22: Global Portable X-Ray Machines Volume K Forecast, by Application 2019 & 2032
- Table 23: Global Portable X-Ray Machines Revenue million Forecast, by Types 2019 & 2032
- Table 24: Global Portable X-Ray Machines Volume K Forecast, by Types 2019 & 2032
- Table 25: Global Portable X-Ray Machines Revenue million Forecast, by Country 2019 & 2032
- Table 26: Global Portable X-Ray Machines Volume K Forecast, by Country 2019 & 2032
- Table 27: Brazil Portable X-Ray Machines Revenue (million) Forecast, by Application 2019 & 2032
- Table 28: Brazil Portable X-Ray Machines Volume (K) Forecast, by Application 2019 & 2032
- Table 29: Argentina Portable X-Ray Machines Revenue (million) Forecast, by Application 2019 & 2032
- Table 30: Argentina Portable X-Ray Machines Volume (K) Forecast, by Application 2019 & 2032
- Table 31: Rest of South America Portable X-Ray Machines Revenue (million) Forecast, by Application 2019 & 2032
- Table 32: Rest of South America Portable X-Ray Machines Volume (K) Forecast, by Application 2019 & 2032
- Table 33: Global Portable X-Ray Machines Revenue million Forecast, by Application 2019 & 2032
- Table 34: Global Portable X-Ray Machines Volume K Forecast, by Application 2019 & 2032
- Table 35: Global Portable X-Ray Machines Revenue million Forecast, by Types 2019 & 2032
- Table 36: Global Portable X-Ray Machines Volume K Forecast, by Types 2019 & 2032
- Table 37: Global Portable X-Ray Machines Revenue million Forecast, by Country 2019 & 2032
- Table 38: Global Portable X-Ray Machines Volume K Forecast, by Country 2019 & 2032
- Table 39: United Kingdom Portable X-Ray Machines Revenue (million) Forecast, by Application 2019 & 2032
- Table 40: United Kingdom Portable X-Ray Machines Volume (K) Forecast, by Application 2019 & 2032
- Table 41: Germany Portable X-Ray Machines Revenue (million) Forecast, by Application 2019 & 2032
- Table 42: Germany Portable X-Ray Machines Volume (K) Forecast, by Application 2019 & 2032
- Table 43: France Portable X-Ray Machines Revenue (million) Forecast, by Application 2019 & 2032
- Table 44: France Portable X-Ray Machines Volume (K) Forecast, by Application 2019 & 2032
- Table 45: Italy Portable X-Ray Machines Revenue (million) Forecast, by Application 2019 & 2032
- Table 46: Italy Portable X-Ray Machines Volume (K) Forecast, by Application 2019 & 2032
- Table 47: Spain Portable X-Ray Machines Revenue (million) Forecast, by Application 2019 & 2032
- Table 48: Spain Portable X-Ray Machines Volume (K) Forecast, by Application 2019 & 2032
- Table 49: Russia Portable X-Ray Machines Revenue (million) Forecast, by Application 2019 & 2032
- Table 50: Russia Portable X-Ray Machines Volume (K) Forecast, by Application 2019 & 2032
- Table 51: Benelux Portable X-Ray Machines Revenue (million) Forecast, by Application 2019 & 2032
- Table 52: Benelux Portable X-Ray Machines Volume (K) Forecast, by Application 2019 & 2032
- Table 53: Nordics Portable X-Ray Machines Revenue (million) Forecast, by Application 2019 & 2032
- Table 54: Nordics Portable X-Ray Machines Volume (K) Forecast, by Application 2019 & 2032
- Table 55: Rest of Europe Portable X-Ray Machines Revenue (million) Forecast, by Application 2019 & 2032
- Table 56: Rest of Europe Portable X-Ray Machines Volume (K) Forecast, by Application 2019 & 2032
- Table 57: Global Portable X-Ray Machines Revenue million Forecast, by Application 2019 & 2032
- Table 58: Global Portable X-Ray Machines Volume K Forecast, by Application 2019 & 2032
- Table 59: Global Portable X-Ray Machines Revenue million Forecast, by Types 2019 & 2032
- Table 60: Global Portable X-Ray Machines Volume K Forecast, by Types 2019 & 2032
- Table 61: Global Portable X-Ray Machines Revenue million Forecast, by Country 2019 & 2032
- Table 62: Global Portable X-Ray Machines Volume K Forecast, by Country 2019 & 2032
- Table 63: Turkey Portable X-Ray Machines Revenue (million) Forecast, by Application 2019 & 2032
- Table 64: Turkey Portable X-Ray Machines Volume (K) Forecast, by Application 2019 & 2032
- Table 65: Israel Portable X-Ray Machines Revenue (million) Forecast, by Application 2019 & 2032
- Table 66: Israel Portable X-Ray Machines Volume (K) Forecast, by Application 2019 & 2032
- Table 67: GCC Portable X-Ray Machines Revenue (million) Forecast, by Application 2019 & 2032
- Table 68: GCC Portable X-Ray Machines Volume (K) Forecast, by Application 2019 & 2032
- Table 69: North Africa Portable X-Ray Machines Revenue (million) Forecast, by Application 2019 & 2032
- Table 70: North Africa Portable X-Ray Machines Volume (K) Forecast, by Application 2019 & 2032
- Table 71: South Africa Portable X-Ray Machines Revenue (million) Forecast, by Application 2019 & 2032
- Table 72: South Africa Portable X-Ray Machines Volume (K) Forecast, by Application 2019 & 2032
- Table 73: Rest of Middle East & Africa Portable X-Ray Machines Revenue (million) Forecast, by Application 2019 & 2032
- Table 74: Rest of Middle East & Africa Portable X-Ray Machines Volume (K) Forecast, by Application 2019 & 2032
- Table 75: Global Portable X-Ray Machines Revenue million Forecast, by Application 2019 & 2032
- Table 76: Global Portable X-Ray Machines Volume K Forecast, by Application 2019 & 2032
- Table 77: Global Portable X-Ray Machines Revenue million Forecast, by Types 2019 & 2032
- Table 78: Global Portable X-Ray Machines Volume K Forecast, by Types 2019 & 2032
- Table 79: Global Portable X-Ray Machines Revenue million Forecast, by Country 2019 & 2032
- Table 80: Global Portable X-Ray Machines Volume K Forecast, by Country 2019 & 2032
- Table 81: China Portable X-Ray Machines Revenue (million) Forecast, by Application 2019 & 2032
- Table 82: China Portable X-Ray Machines Volume (K) Forecast, by Application 2019 & 2032
- Table 83: India Portable X-Ray Machines Revenue (million) Forecast, by Application 2019 & 2032
- Table 84: India Portable X-Ray Machines Volume (K) Forecast, by Application 2019 & 2032
- Table 85: Japan Portable X-Ray Machines Revenue (million) Forecast, by Application 2019 & 2032
- Table 86: Japan Portable X-Ray Machines Volume (K) Forecast, by Application 2019 & 2032
- Table 87: South Korea Portable X-Ray Machines Revenue (million) Forecast, by Application 2019 & 2032
- Table 88: South Korea Portable X-Ray Machines Volume (K) Forecast, by Application 2019 & 2032
- Table 89: ASEAN Portable X-Ray Machines Revenue (million) Forecast, by Application 2019 & 2032
- Table 90: ASEAN Portable X-Ray Machines Volume (K) Forecast, by Application 2019 & 2032
- Table 91: Oceania Portable X-Ray Machines Revenue (million) Forecast, by Application 2019 & 2032
- Table 92: Oceania Portable X-Ray Machines Volume (K) Forecast, by Application 2019 & 2032
- Table 93: Rest of Asia Pacific Portable X-Ray Machines Revenue (million) Forecast, by Application 2019 & 2032
- Table 94: Rest of Asia Pacific Portable X-Ray Machines Volume (K) Forecast, by Application 2019 & 2032
Frequently Asked Questions
1. What is the projected Compound Annual Growth Rate (CAGR) of the Portable X-Ray Machines?
The projected CAGR is approximately XX%.
2. Which companies are prominent players in the Portable X-Ray Machines?
Key companies in the market include Siemens, GE Healthcare, Philips Healthcare, Canon, Fujifilm, Konica Minolta Healthcare, Hitachi, MinXray, Inc, Shimadzu, Samsung Healthcare, Wandong Medical Equipment, Wandong Dingli Medical Equipment.
3. What are the main segments of the Portable X-Ray Machines?
The market segments include Application, Types.
4. Can you provide details about the market size?
The market size is estimated to be USD XXX million as of 2022.
5. What are some drivers contributing to market growth?
N/A
6. What are the notable trends driving market growth?
N/A
7. Are there any restraints impacting market growth?
N/A
8. Can you provide examples of recent developments in the market?
N/A
9. What pricing options are available for accessing the report?
Pricing options include single-user, multi-user, and enterprise licenses priced at USD 3950.00, USD 5925.00, and USD 7900.00 respectively.
10. Is the market size provided in terms of value or volume?
The market size is provided in terms of value, measured in million and volume, measured in K.
11. Are there any specific market keywords associated with the report?
Yes, the market keyword associated with the report is "Portable X-Ray Machines," which aids in identifying and referencing the specific market segment covered.
12. How do I determine which pricing option suits my needs best?
The pricing options vary based on user requirements and access needs. Individual users may opt for single-user licenses, while businesses requiring broader access may choose multi-user or enterprise licenses for cost-effective access to the report.
13. Are there any additional resources or data provided in the Portable X-Ray Machines report?
While the report offers comprehensive insights, it's advisable to review the specific contents or supplementary materials provided to ascertain if additional resources or data are available.
14. How can I stay updated on further developments or reports in the Portable X-Ray Machines?
To stay informed about further developments, trends, and reports in the Portable X-Ray Machines, consider subscribing to industry newsletters, following relevant companies and organizations, or regularly checking reputable industry news sources and publications.
Methodology
Step 1 - Identification of Relevant Samples Size from Population Database


Step 2 - Approaches for Defining Global Market Size (Value, Volume* & Price*)

Note*: In applicable scenarios
Step 3 - Data Sources
Primary Research
- Web Analytics
- Survey Reports
- Research Institute
- Latest Research Reports
- Opinion Leaders
Secondary Research
- Annual Reports
- White Paper
- Latest Press Release
- Industry Association
- Paid Database
- Investor Presentations

Step 4 - Data Triangulation
Involves using different sources of information in order to increase the validity of a study
These sources are likely to be stakeholders in a program - participants, other researchers, program staff, other community members, and so on.
Then we put all data in single framework & apply various statistical tools to find out the dynamic on the market.
During the analysis stage, feedback from the stakeholder groups would be compared to determine areas of agreement as well as areas of divergence
