

Key Insights
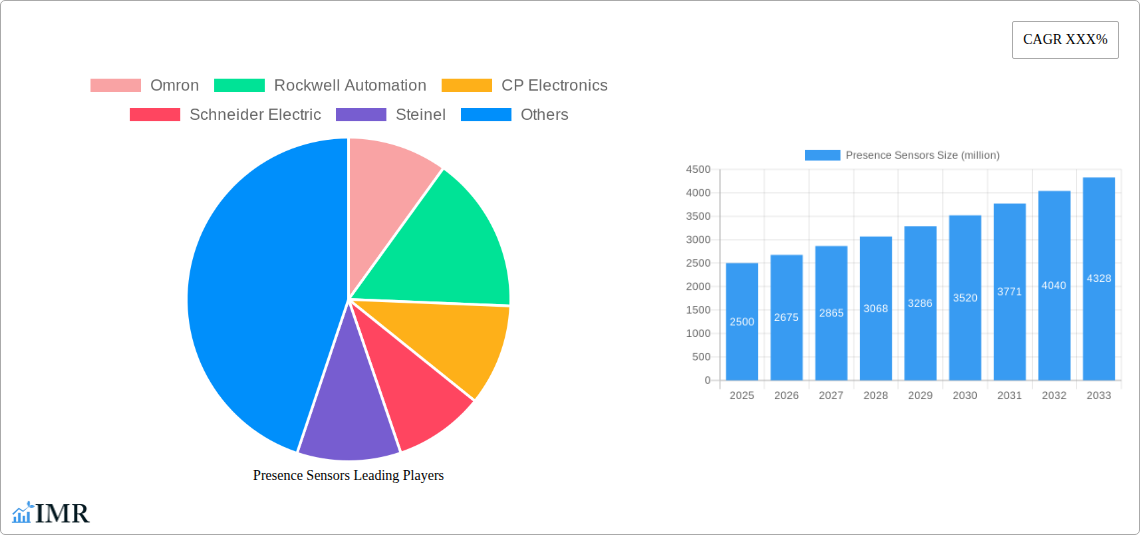
The presence sensor market is experiencing robust growth, driven by increasing automation across various sectors and a rising demand for energy-efficient solutions. The market, estimated at $2.5 billion in 2025, is projected to exhibit a Compound Annual Growth Rate (CAGR) of 7% from 2025 to 2033, reaching approximately $4.2 billion by 2033. This growth is fueled by several key factors, including the widespread adoption of smart buildings and homes, advancements in sensor technology leading to improved accuracy and reliability, and the growing need for enhanced security and safety measures in commercial and industrial spaces. Furthermore, the integration of presence sensors with IoT platforms is opening new avenues for data-driven applications, optimizing building management systems, and enabling personalized user experiences. Key players like Omron, Rockwell Automation, Schneider Electric, and others are continuously innovating, introducing advanced features, and expanding their product portfolios to cater to the growing demand across diverse applications.
Market segmentation reveals strong growth in occupancy sensing for HVAC control, as businesses actively seek to improve energy efficiency and reduce operational costs. The adoption of presence sensors in healthcare, retail, and industrial automation is also significantly contributing to overall market expansion. However, challenges such as high initial investment costs, the need for robust infrastructure, and concerns about data privacy and security are acting as potential restraints. Nevertheless, ongoing technological improvements and the increasing affordability of presence sensors are expected to mitigate these challenges, further accelerating market growth in the coming years. Regional analysis suggests North America and Europe will remain dominant markets due to early adoption of smart technologies and stringent energy regulations. However, emerging economies in Asia-Pacific are expected to show significant growth potential, fueled by rising urbanization and increasing investments in infrastructure development.
Presence Sensors Market Report: 2019-2033
This comprehensive report provides a detailed analysis of the global presence sensors market, encompassing market dynamics, growth trends, regional performance, key players, and future outlook. The study period covers 2019-2033, with 2025 as the base and estimated year. This report is invaluable for industry professionals, investors, and strategic decision-makers seeking actionable insights into this rapidly evolving sector. The report projects a market size of xx million units by 2033, representing a CAGR of xx% during the forecast period (2025-2033).
Presence Sensors Market Dynamics & Structure
The global presence sensors market is characterized by moderate concentration, with key players like Omron, Rockwell Automation, CP Electronics, Schneider Electric, Steinel, Optex, and Ms Sedco holding significant market share. Technological innovation, particularly in areas like improved accuracy, energy efficiency, and integration with smart systems, is a primary growth driver. Stringent safety regulations in various industries, especially automotive and healthcare, also influence market dynamics. Competitive substitutes include contact sensors and other proximity detection technologies, while the rise of IoT and smart building technologies presents significant opportunities. The market has seen a moderate level of M&A activity in recent years, with approximately xx deals concluded between 2019 and 2024. End-user demographics are diverse, spanning industrial automation, building automation, automotive, healthcare, and retail sectors.
- Market Concentration: Moderately concentrated, with top players holding xx% of market share in 2025.
- Technological Innovation: Focus on miniaturization, improved accuracy (e.g., sub-millimeter precision), and enhanced power efficiency.
- Regulatory Landscape: Stringent safety and performance standards, particularly in sectors like automotive and healthcare.
- Competitive Substitutes: Contact sensors, ultrasonic sensors, and other proximity detection technologies.
- M&A Activity: Approximately xx deals between 2019 and 2024, driven by expansion strategies and technology acquisition.
- End-User Demographics: Diverse, including industrial automation (xx million units), building automation (xx million units), automotive (xx million units), and other sectors.
Presence Sensors Growth Trends & Insights
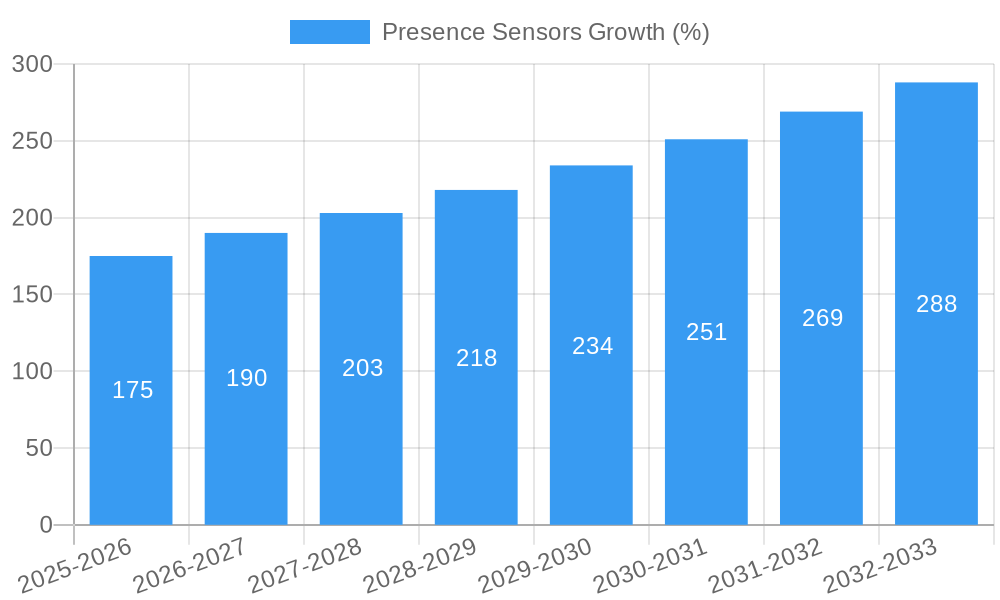
The global presence sensors market witnessed significant growth during the historical period (2019-2024), driven by increasing adoption across various industries. The market size expanded from xx million units in 2019 to xx million units in 2024, exhibiting a CAGR of xx%. This growth trajectory is projected to continue during the forecast period, fueled by the increasing demand for automation, energy efficiency, and smart technologies. Technological advancements such as the integration of AI and machine learning are further driving market penetration. Consumer behavior shifts towards smart homes and buildings contribute positively to the overall demand. The market penetration rate is expected to reach xx% by 2033.
Dominant Regions, Countries, or Segments in Presence Sensors
North America currently dominates the presence sensors market, holding approximately xx% market share in 2025, followed by Europe and Asia Pacific. This dominance is primarily attributed to advanced infrastructure, a strong focus on automation, and the presence of major industry players in the region. The high adoption of smart building technologies and stringent safety regulations in North America are significant drivers. Countries such as the US and Canada exhibit robust growth potential due to high government investments in infrastructure and automation projects. The industrial automation segment is currently the largest market segment, accounting for approximately xx million units in 2025.
- North America Dominance: Driven by advanced infrastructure, high adoption of automation, and presence of major players.
- Strong Growth in Europe: Fueled by increasing investments in smart city initiatives and industrial automation.
- Asia-Pacific Potential: High growth potential due to rapid industrialization and urbanization.
- Industrial Automation Segment: Largest segment, driven by the need for efficient production processes and improved safety.
Presence Sensors Product Landscape
Presence sensors encompass a range of technologies, including ultrasonic, infrared, microwave, and capacitive sensors. Recent innovations focus on miniaturization, improved accuracy, and enhanced power efficiency. These sensors find applications in diverse sectors, offering unique selling propositions like contactless operation, enhanced reliability, and ease of integration. Key performance metrics include detection range, accuracy, response time, and power consumption. Advanced features, such as integrated microcontrollers and communication protocols (e.g., IO-Link), are becoming increasingly prevalent.
Key Drivers, Barriers & Challenges in Presence Sensors
Key Drivers:
The market is propelled by factors such as increasing automation across various industries, rising demand for energy-efficient solutions, and the growing adoption of smart technologies (IoT and Industry 4.0). Government initiatives promoting energy efficiency and automation further boost market growth.
Key Barriers & Challenges:
High initial investment costs, concerns about data security and privacy, and the complexity of integrating presence sensors into existing systems pose significant challenges. Supply chain disruptions and the availability of skilled labor also impact market growth. The competitive landscape, with several established players, presents additional pressure.
Emerging Opportunities in Presence Sensors
Emerging opportunities include the expansion into untapped markets like developing economies, particularly in smart city initiatives and infrastructure development. Innovative applications in areas like healthcare (patient monitoring), robotics (obstacle avoidance), and augmented reality (gesture recognition) hold considerable potential. Evolving consumer preferences towards enhanced convenience and safety in residential and commercial spaces further drive market growth.
Growth Accelerators in the Presence Sensors Industry
Technological breakthroughs in sensor technology, such as the development of more sensitive and energy-efficient sensors, are key growth catalysts. Strategic partnerships between sensor manufacturers and system integrators enable wider market reach and faster adoption. Market expansion strategies focusing on emerging economies and untapped applications are expected to fuel long-term growth.
Key Players Shaping the Presence Sensors Market
Notable Milestones in Presence Sensors Sector
- 2020: Launch of a new generation of ultra-low power presence sensors by Omron.
- 2021: Acquisition of a smaller sensor technology company by Schneider Electric.
- 2022: Introduction of AI-powered presence sensors by a leading player in the market.
- 2023: Adoption of new industry standards for presence sensor interoperability.
- 2024: Significant increase in demand for presence sensors in the smart building sector.
In-Depth Presence Sensors Market Outlook
The presence sensors market exhibits significant long-term growth potential, driven by continued technological advancements, expanding applications across diverse sectors, and the increasing demand for smart and automated systems. Strategic partnerships, focused R&D, and targeted market expansion initiatives will play a crucial role in shaping the future of this dynamic market. The market is expected to experience strong growth in the coming years, with substantial opportunities for innovation and expansion.
Presence Sensors Segmentation
-
1. Application
- 1.1. Packaging
- 1.2. Machinery
- 1.3. Material Handling
- 1.4. Food Industry
- 1.5. Transportation Industry
-
2. Type
- 2.1. Photoelectric
- 2.2. Electromechanical
- 2.3. Radiofrequency
- 2.4. Pullback
- 2.5. Safety Trip Controls
- 2.6. Two Hand Control
Presence Sensors Segmentation By Geography
-
1. North America
- 1.1. United States
- 1.2. Canada
- 1.3. Mexico
-
2. South America
- 2.1. Brazil
- 2.2. Argentina
- 2.3. Rest of South America
-
3. Europe
- 3.1. United Kingdom
- 3.2. Germany
- 3.3. France
- 3.4. Italy
- 3.5. Spain
- 3.6. Russia
- 3.7. Benelux
- 3.8. Nordics
- 3.9. Rest of Europe
-
4. Middle East & Africa
- 4.1. Turkey
- 4.2. Israel
- 4.3. GCC
- 4.4. North Africa
- 4.5. South Africa
- 4.6. Rest of Middle East & Africa
-
5. Asia Pacific
- 5.1. China
- 5.2. India
- 5.3. Japan
- 5.4. South Korea
- 5.5. ASEAN
- 5.6. Oceania
- 5.7. Rest of Asia Pacific

Presence Sensors REPORT HIGHLIGHTS
| Aspects | Details |
|---|---|
| Study Period | 2019-2033 |
| Base Year | 2024 |
| Estimated Year | 2025 |
| Forecast Period | 2025-2033 |
| Historical Period | 2019-2024 |
| Growth Rate | CAGR of XXX% from 2019-2033 |
| Segmentation |
|
Table of Contents
- 1. Introduction
- 1.1. Research Scope
- 1.2. Market Segmentation
- 1.3. Research Methodology
- 1.4. Definitions and Assumptions
- 2. Executive Summary
- 2.1. Introduction
- 3. Market Dynamics
- 3.1. Introduction
- 3.2. Market Drivers
- 3.3. Market Restrains
- 3.4. Market Trends
- 4. Market Factor Analysis
- 4.1. Porters Five Forces
- 4.2. Supply/Value Chain
- 4.3. PESTEL analysis
- 4.4. Market Entropy
- 4.5. Patent/Trademark Analysis
- 5. Global Presence Sensors Analysis, Insights and Forecast, 2019-2031
- 5.1. Market Analysis, Insights and Forecast - by Application
- 5.1.1. Packaging
- 5.1.2. Machinery
- 5.1.3. Material Handling
- 5.1.4. Food Industry
- 5.1.5. Transportation Industry
- 5.2. Market Analysis, Insights and Forecast - by Type
- 5.2.1. Photoelectric
- 5.2.2. Electromechanical
- 5.2.3. Radiofrequency
- 5.2.4. Pullback
- 5.2.5. Safety Trip Controls
- 5.2.6. Two Hand Control
- 5.3. Market Analysis, Insights and Forecast - by Region
- 5.3.1. North America
- 5.3.2. South America
- 5.3.3. Europe
- 5.3.4. Middle East & Africa
- 5.3.5. Asia Pacific
- 5.1. Market Analysis, Insights and Forecast - by Application
- 6. North America Presence Sensors Analysis, Insights and Forecast, 2019-2031
- 6.1. Market Analysis, Insights and Forecast - by Application
- 6.1.1. Packaging
- 6.1.2. Machinery
- 6.1.3. Material Handling
- 6.1.4. Food Industry
- 6.1.5. Transportation Industry
- 6.2. Market Analysis, Insights and Forecast - by Type
- 6.2.1. Photoelectric
- 6.2.2. Electromechanical
- 6.2.3. Radiofrequency
- 6.2.4. Pullback
- 6.2.5. Safety Trip Controls
- 6.2.6. Two Hand Control
- 6.1. Market Analysis, Insights and Forecast - by Application
- 7. South America Presence Sensors Analysis, Insights and Forecast, 2019-2031
- 7.1. Market Analysis, Insights and Forecast - by Application
- 7.1.1. Packaging
- 7.1.2. Machinery
- 7.1.3. Material Handling
- 7.1.4. Food Industry
- 7.1.5. Transportation Industry
- 7.2. Market Analysis, Insights and Forecast - by Type
- 7.2.1. Photoelectric
- 7.2.2. Electromechanical
- 7.2.3. Radiofrequency
- 7.2.4. Pullback
- 7.2.5. Safety Trip Controls
- 7.2.6. Two Hand Control
- 7.1. Market Analysis, Insights and Forecast - by Application
- 8. Europe Presence Sensors Analysis, Insights and Forecast, 2019-2031
- 8.1. Market Analysis, Insights and Forecast - by Application
- 8.1.1. Packaging
- 8.1.2. Machinery
- 8.1.3. Material Handling
- 8.1.4. Food Industry
- 8.1.5. Transportation Industry
- 8.2. Market Analysis, Insights and Forecast - by Type
- 8.2.1. Photoelectric
- 8.2.2. Electromechanical
- 8.2.3. Radiofrequency
- 8.2.4. Pullback
- 8.2.5. Safety Trip Controls
- 8.2.6. Two Hand Control
- 8.1. Market Analysis, Insights and Forecast - by Application
- 9. Middle East & Africa Presence Sensors Analysis, Insights and Forecast, 2019-2031
- 9.1. Market Analysis, Insights and Forecast - by Application
- 9.1.1. Packaging
- 9.1.2. Machinery
- 9.1.3. Material Handling
- 9.1.4. Food Industry
- 9.1.5. Transportation Industry
- 9.2. Market Analysis, Insights and Forecast - by Type
- 9.2.1. Photoelectric
- 9.2.2. Electromechanical
- 9.2.3. Radiofrequency
- 9.2.4. Pullback
- 9.2.5. Safety Trip Controls
- 9.2.6. Two Hand Control
- 9.1. Market Analysis, Insights and Forecast - by Application
- 10. Asia Pacific Presence Sensors Analysis, Insights and Forecast, 2019-2031
- 10.1. Market Analysis, Insights and Forecast - by Application
- 10.1.1. Packaging
- 10.1.2. Machinery
- 10.1.3. Material Handling
- 10.1.4. Food Industry
- 10.1.5. Transportation Industry
- 10.2. Market Analysis, Insights and Forecast - by Type
- 10.2.1. Photoelectric
- 10.2.2. Electromechanical
- 10.2.3. Radiofrequency
- 10.2.4. Pullback
- 10.2.5. Safety Trip Controls
- 10.2.6. Two Hand Control
- 10.1. Market Analysis, Insights and Forecast - by Application
- 11. Competitive Analysis
- 11.1. Global Market Share Analysis 2024
- 11.2. Company Profiles
- 11.2.1 Omron
- 11.2.1.1. Overview
- 11.2.1.2. Products
- 11.2.1.3. SWOT Analysis
- 11.2.1.4. Recent Developments
- 11.2.1.5. Financials (Based on Availability)
- 11.2.2 Rockwell Automation
- 11.2.2.1. Overview
- 11.2.2.2. Products
- 11.2.2.3. SWOT Analysis
- 11.2.2.4. Recent Developments
- 11.2.2.5. Financials (Based on Availability)
- 11.2.3 CP Electronics
- 11.2.3.1. Overview
- 11.2.3.2. Products
- 11.2.3.3. SWOT Analysis
- 11.2.3.4. Recent Developments
- 11.2.3.5. Financials (Based on Availability)
- 11.2.4 Schneider Electric
- 11.2.4.1. Overview
- 11.2.4.2. Products
- 11.2.4.3. SWOT Analysis
- 11.2.4.4. Recent Developments
- 11.2.4.5. Financials (Based on Availability)
- 11.2.5 Steinel
- 11.2.5.1. Overview
- 11.2.5.2. Products
- 11.2.5.3. SWOT Analysis
- 11.2.5.4. Recent Developments
- 11.2.5.5. Financials (Based on Availability)
- 11.2.6 Optex
- 11.2.6.1. Overview
- 11.2.6.2. Products
- 11.2.6.3. SWOT Analysis
- 11.2.6.4. Recent Developments
- 11.2.6.5. Financials (Based on Availability)
- 11.2.7 Ms Sedco
- 11.2.7.1. Overview
- 11.2.7.2. Products
- 11.2.7.3. SWOT Analysis
- 11.2.7.4. Recent Developments
- 11.2.7.5. Financials (Based on Availability)
- 11.2.1 Omron
List of Figures
- Figure 1: Global Presence Sensors Revenue Breakdown (million, %) by Region 2024 & 2032
- Figure 2: North America Presence Sensors Revenue (million), by Application 2024 & 2032
- Figure 3: North America Presence Sensors Revenue Share (%), by Application 2024 & 2032
- Figure 4: North America Presence Sensors Revenue (million), by Type 2024 & 2032
- Figure 5: North America Presence Sensors Revenue Share (%), by Type 2024 & 2032
- Figure 6: North America Presence Sensors Revenue (million), by Country 2024 & 2032
- Figure 7: North America Presence Sensors Revenue Share (%), by Country 2024 & 2032
- Figure 8: South America Presence Sensors Revenue (million), by Application 2024 & 2032
- Figure 9: South America Presence Sensors Revenue Share (%), by Application 2024 & 2032
- Figure 10: South America Presence Sensors Revenue (million), by Type 2024 & 2032
- Figure 11: South America Presence Sensors Revenue Share (%), by Type 2024 & 2032
- Figure 12: South America Presence Sensors Revenue (million), by Country 2024 & 2032
- Figure 13: South America Presence Sensors Revenue Share (%), by Country 2024 & 2032
- Figure 14: Europe Presence Sensors Revenue (million), by Application 2024 & 2032
- Figure 15: Europe Presence Sensors Revenue Share (%), by Application 2024 & 2032
- Figure 16: Europe Presence Sensors Revenue (million), by Type 2024 & 2032
- Figure 17: Europe Presence Sensors Revenue Share (%), by Type 2024 & 2032
- Figure 18: Europe Presence Sensors Revenue (million), by Country 2024 & 2032
- Figure 19: Europe Presence Sensors Revenue Share (%), by Country 2024 & 2032
- Figure 20: Middle East & Africa Presence Sensors Revenue (million), by Application 2024 & 2032
- Figure 21: Middle East & Africa Presence Sensors Revenue Share (%), by Application 2024 & 2032
- Figure 22: Middle East & Africa Presence Sensors Revenue (million), by Type 2024 & 2032
- Figure 23: Middle East & Africa Presence Sensors Revenue Share (%), by Type 2024 & 2032
- Figure 24: Middle East & Africa Presence Sensors Revenue (million), by Country 2024 & 2032
- Figure 25: Middle East & Africa Presence Sensors Revenue Share (%), by Country 2024 & 2032
- Figure 26: Asia Pacific Presence Sensors Revenue (million), by Application 2024 & 2032
- Figure 27: Asia Pacific Presence Sensors Revenue Share (%), by Application 2024 & 2032
- Figure 28: Asia Pacific Presence Sensors Revenue (million), by Type 2024 & 2032
- Figure 29: Asia Pacific Presence Sensors Revenue Share (%), by Type 2024 & 2032
- Figure 30: Asia Pacific Presence Sensors Revenue (million), by Country 2024 & 2032
- Figure 31: Asia Pacific Presence Sensors Revenue Share (%), by Country 2024 & 2032
List of Tables
- Table 1: Global Presence Sensors Revenue million Forecast, by Region 2019 & 2032
- Table 2: Global Presence Sensors Revenue million Forecast, by Application 2019 & 2032
- Table 3: Global Presence Sensors Revenue million Forecast, by Type 2019 & 2032
- Table 4: Global Presence Sensors Revenue million Forecast, by Region 2019 & 2032
- Table 5: Global Presence Sensors Revenue million Forecast, by Application 2019 & 2032
- Table 6: Global Presence Sensors Revenue million Forecast, by Type 2019 & 2032
- Table 7: Global Presence Sensors Revenue million Forecast, by Country 2019 & 2032
- Table 8: United States Presence Sensors Revenue (million) Forecast, by Application 2019 & 2032
- Table 9: Canada Presence Sensors Revenue (million) Forecast, by Application 2019 & 2032
- Table 10: Mexico Presence Sensors Revenue (million) Forecast, by Application 2019 & 2032
- Table 11: Global Presence Sensors Revenue million Forecast, by Application 2019 & 2032
- Table 12: Global Presence Sensors Revenue million Forecast, by Type 2019 & 2032
- Table 13: Global Presence Sensors Revenue million Forecast, by Country 2019 & 2032
- Table 14: Brazil Presence Sensors Revenue (million) Forecast, by Application 2019 & 2032
- Table 15: Argentina Presence Sensors Revenue (million) Forecast, by Application 2019 & 2032
- Table 16: Rest of South America Presence Sensors Revenue (million) Forecast, by Application 2019 & 2032
- Table 17: Global Presence Sensors Revenue million Forecast, by Application 2019 & 2032
- Table 18: Global Presence Sensors Revenue million Forecast, by Type 2019 & 2032
- Table 19: Global Presence Sensors Revenue million Forecast, by Country 2019 & 2032
- Table 20: United Kingdom Presence Sensors Revenue (million) Forecast, by Application 2019 & 2032
- Table 21: Germany Presence Sensors Revenue (million) Forecast, by Application 2019 & 2032
- Table 22: France Presence Sensors Revenue (million) Forecast, by Application 2019 & 2032
- Table 23: Italy Presence Sensors Revenue (million) Forecast, by Application 2019 & 2032
- Table 24: Spain Presence Sensors Revenue (million) Forecast, by Application 2019 & 2032
- Table 25: Russia Presence Sensors Revenue (million) Forecast, by Application 2019 & 2032
- Table 26: Benelux Presence Sensors Revenue (million) Forecast, by Application 2019 & 2032
- Table 27: Nordics Presence Sensors Revenue (million) Forecast, by Application 2019 & 2032
- Table 28: Rest of Europe Presence Sensors Revenue (million) Forecast, by Application 2019 & 2032
- Table 29: Global Presence Sensors Revenue million Forecast, by Application 2019 & 2032
- Table 30: Global Presence Sensors Revenue million Forecast, by Type 2019 & 2032
- Table 31: Global Presence Sensors Revenue million Forecast, by Country 2019 & 2032
- Table 32: Turkey Presence Sensors Revenue (million) Forecast, by Application 2019 & 2032
- Table 33: Israel Presence Sensors Revenue (million) Forecast, by Application 2019 & 2032
- Table 34: GCC Presence Sensors Revenue (million) Forecast, by Application 2019 & 2032
- Table 35: North Africa Presence Sensors Revenue (million) Forecast, by Application 2019 & 2032
- Table 36: South Africa Presence Sensors Revenue (million) Forecast, by Application 2019 & 2032
- Table 37: Rest of Middle East & Africa Presence Sensors Revenue (million) Forecast, by Application 2019 & 2032
- Table 38: Global Presence Sensors Revenue million Forecast, by Application 2019 & 2032
- Table 39: Global Presence Sensors Revenue million Forecast, by Type 2019 & 2032
- Table 40: Global Presence Sensors Revenue million Forecast, by Country 2019 & 2032
- Table 41: China Presence Sensors Revenue (million) Forecast, by Application 2019 & 2032
- Table 42: India Presence Sensors Revenue (million) Forecast, by Application 2019 & 2032
- Table 43: Japan Presence Sensors Revenue (million) Forecast, by Application 2019 & 2032
- Table 44: South Korea Presence Sensors Revenue (million) Forecast, by Application 2019 & 2032
- Table 45: ASEAN Presence Sensors Revenue (million) Forecast, by Application 2019 & 2032
- Table 46: Oceania Presence Sensors Revenue (million) Forecast, by Application 2019 & 2032
- Table 47: Rest of Asia Pacific Presence Sensors Revenue (million) Forecast, by Application 2019 & 2032
Frequently Asked Questions
1. What is the projected Compound Annual Growth Rate (CAGR) of the Presence Sensors?
The projected CAGR is approximately XXX%.
2. Which companies are prominent players in the Presence Sensors?
Key companies in the market include Omron, Rockwell Automation, CP Electronics, Schneider Electric, Steinel, Optex, Ms Sedco.
3. What are the main segments of the Presence Sensors?
The market segments include Application, Type.
4. Can you provide details about the market size?
The market size is estimated to be USD XXX million as of 2022.
5. What are some drivers contributing to market growth?
N/A
6. What are the notable trends driving market growth?
N/A
7. Are there any restraints impacting market growth?
N/A
8. Can you provide examples of recent developments in the market?
N/A
9. What pricing options are available for accessing the report?
Pricing options include single-user, multi-user, and enterprise licenses priced at USD 2900.00, USD 4350.00, and USD 5800.00 respectively.
10. Is the market size provided in terms of value or volume?
The market size is provided in terms of value, measured in million.
11. Are there any specific market keywords associated with the report?
Yes, the market keyword associated with the report is "Presence Sensors," which aids in identifying and referencing the specific market segment covered.
12. How do I determine which pricing option suits my needs best?
The pricing options vary based on user requirements and access needs. Individual users may opt for single-user licenses, while businesses requiring broader access may choose multi-user or enterprise licenses for cost-effective access to the report.
13. Are there any additional resources or data provided in the Presence Sensors report?
While the report offers comprehensive insights, it's advisable to review the specific contents or supplementary materials provided to ascertain if additional resources or data are available.
14. How can I stay updated on further developments or reports in the Presence Sensors?
To stay informed about further developments, trends, and reports in the Presence Sensors, consider subscribing to industry newsletters, following relevant companies and organizations, or regularly checking reputable industry news sources and publications.
Methodology
Step 1 - Identification of Relevant Samples Size from Population Database


Step 2 - Approaches for Defining Global Market Size (Value, Volume* & Price*)

Note*: In applicable scenarios
Step 3 - Data Sources
Primary Research
- Web Analytics
- Survey Reports
- Research Institute
- Latest Research Reports
- Opinion Leaders
Secondary Research
- Annual Reports
- White Paper
- Latest Press Release
- Industry Association
- Paid Database
- Investor Presentations

Step 4 - Data Triangulation
Involves using different sources of information in order to increase the validity of a study
These sources are likely to be stakeholders in a program - participants, other researchers, program staff, other community members, and so on.
Then we put all data in single framework & apply various statistical tools to find out the dynamic on the market.
During the analysis stage, feedback from the stakeholder groups would be compared to determine areas of agreement as well as areas of divergence
