

Key Insights
The Propane Dehydrogenation (PDH) Technology Services market is experiencing robust growth, driven by the increasing global demand for propylene, a crucial building block in the production of plastics, textiles, and other petrochemical products. The market's expansion is fueled by several factors, including the rising consumption of polypropylene and other propylene-derived materials, particularly in developing economies experiencing rapid industrialization. Furthermore, technological advancements in PDH technologies, such as the development of more efficient and cost-effective catalysts and reactor designs, are enhancing the attractiveness of this process compared to traditional propylene production methods. The market is witnessing a shift towards larger-scale PDH plants, driven by economies of scale and improved operational efficiency. Leading players, including Honeywell UOP, Lummus Technology, thyssenkrupp Uhde, Linde, Saipem SpA, Dow, KBR, and Sinopec, are actively investing in research and development to enhance their offerings and maintain a competitive edge. These companies are also focusing on strategic collaborations and mergers & acquisitions to expand their market reach and technological capabilities.
Despite the positive outlook, the PDH Technology Services market faces certain challenges. Fluctuating propane prices and the volatility of the global petrochemical market pose significant risks. Furthermore, stringent environmental regulations related to greenhouse gas emissions and the increasing focus on sustainable manufacturing practices necessitate the adoption of cleaner and more energy-efficient PDH technologies. This presents opportunities for companies to develop and implement innovative solutions that address environmental concerns while maintaining profitability. The market is expected to witness continued consolidation, with larger players acquiring smaller companies to strengthen their market positions. Regional variations in market growth are anticipated, driven by factors such as industrial development, government policies, and the availability of feedstock. Assuming a conservative CAGR of 8% based on typical industry growth in similar sectors, and a 2025 market size of $10 billion, the market can be expected to grow significantly over the forecast period.
Propane Dehydrogenation Technology Services Market Report: 2019-2033
This comprehensive report provides an in-depth analysis of the Propane Dehydrogenation (PDH) Technology Services market, covering the period 2019-2033. It offers valuable insights into market dynamics, growth trends, key players, and future opportunities within the broader petrochemical and chemical processing industries. The report is essential for industry professionals, investors, and researchers seeking a clear understanding of this rapidly evolving sector.
Propane Dehydrogenation Technology Services Market Dynamics & Structure
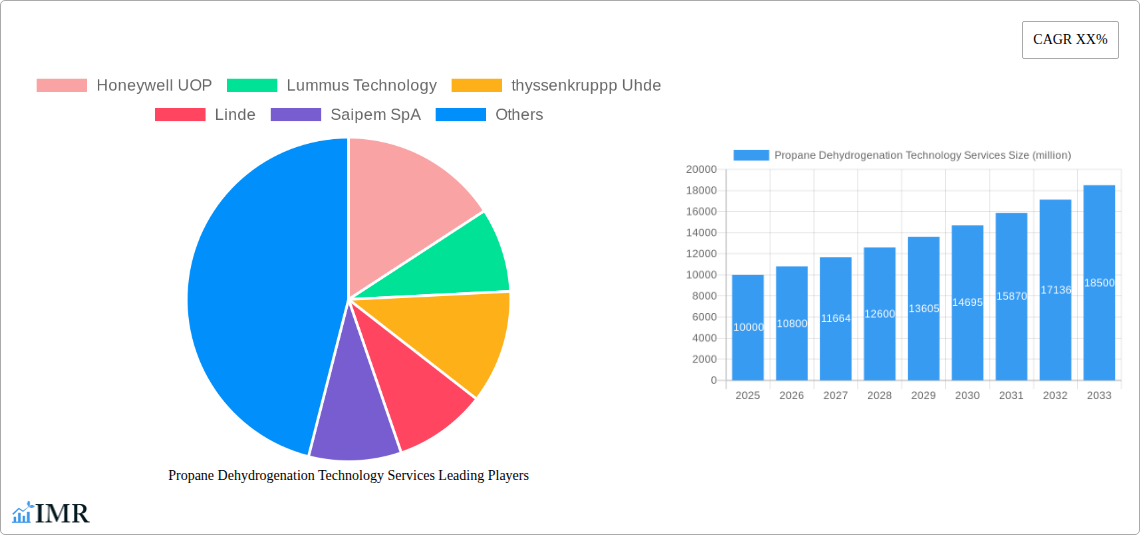
This section analyzes the competitive landscape of the Propane Dehydrogenation Technology Services market, encompassing market concentration, technological innovation, regulatory influences, and industry consolidation. The study period covers 2019-2024 (Historical Period), with a base year of 2025 and a forecast period of 2025-2033. The Estimated Year is 2025. The market is characterized by a moderate level of concentration, with several major players commanding significant market share. Market size in 2025 is estimated at $XX million.
- Market Concentration: The top five players (Honeywell UOP, Lummus Technology, thyssenkrupp Uhde, Linde, Saipem SpA) hold approximately 65% of the global market share in 2025.
- Technological Innovation: Continuous advancements in catalyst technology, reactor design, and process optimization are key drivers. However, high R&D costs represent a significant barrier to entry for smaller players.
- Regulatory Framework: Stringent environmental regulations related to emissions are shaping technology adoption and driving demand for more efficient and cleaner processes.
- Competitive Substitutes: Other propylene production methods (e.g., steam cracking) present competition, but PDH's advantages in terms of feedstock flexibility and lower emissions are expected to support its growth.
- End-User Demographics: The primary end-users are polypropylene producers, and the growth of this segment directly influences demand for PDH technology services.
- M&A Trends: The past five years have witnessed several significant mergers and acquisitions, totaling approximately $XX million in deal value, primarily aimed at consolidating market share and expanding geographical reach.
Propane Dehydrogenation Technology Services Growth Trends & Insights
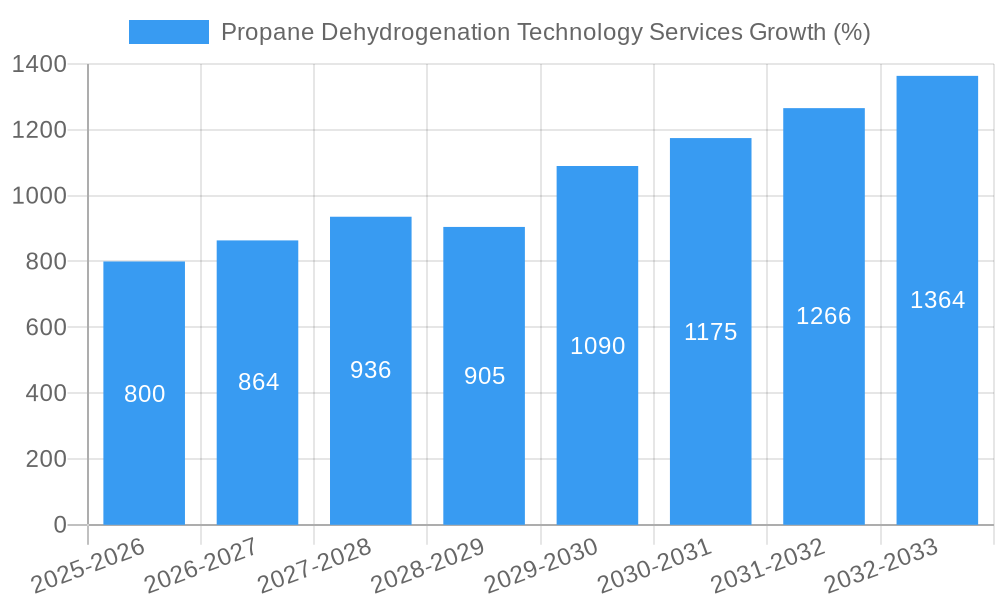
The global Propane Dehydrogenation Technology Services market exhibits robust growth, driven by increasing demand for propylene, particularly in Asia-Pacific. The market witnessed a CAGR of XX% during the historical period (2019-2024). The forecast period (2025-2033) projects a CAGR of XX%, reaching an estimated market size of $XX million by 2033. This growth is fueled by several factors:
- Expanding polypropylene production capacity globally, particularly in developing economies.
- Increasing adoption of propane as a feedstock due to its relative cost-effectiveness compared to naphtha.
- Technological advancements leading to improved process efficiency and reduced operating costs.
- Stringent environmental regulations promoting cleaner propylene production methods.
- Government incentives and supportive policies in key regions.
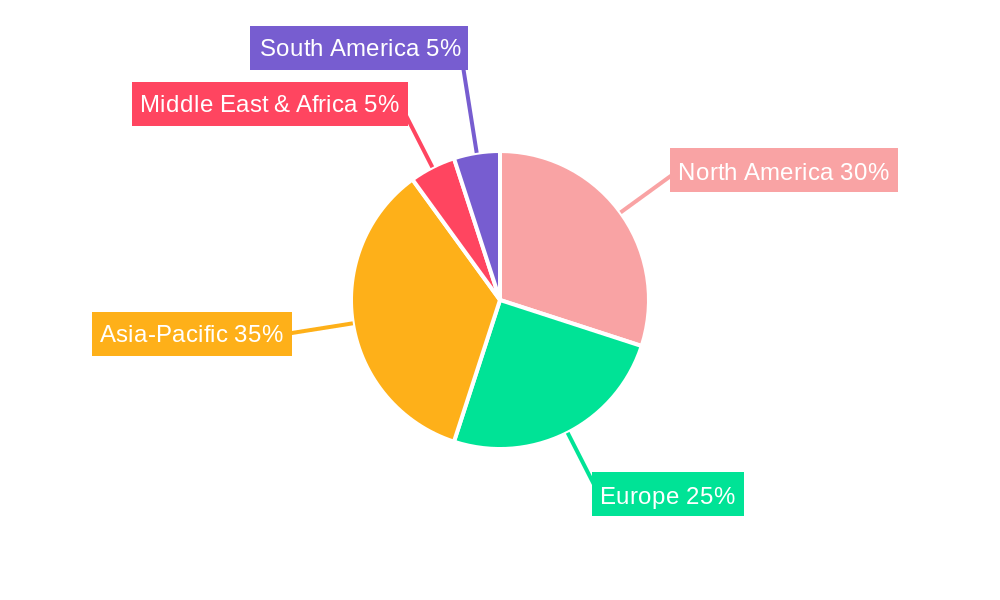
Dominant Regions, Countries, or Segments in Propane Dehydrogenation Technology Services
The Asia-Pacific region, particularly China and Southeast Asia, dominates the Propane Dehydrogenation Technology Services market, accounting for approximately 60% of global demand in 2025. This dominance is driven by:
Rapid growth of the polypropylene industry in the region.
Significant investments in petrochemical infrastructure.
Favorable government policies promoting industrial development.
Abundant availability of propane feedstock.
Key Drivers:
- Strong economic growth and increasing per capita income.
- Expansion of downstream polypropylene applications.
- Government initiatives to support the petrochemical industry.
- Development of new PDH plants in the region.
Other significant regions include the Middle East and North America, characterized by established polypropylene production capacities and ongoing investment in upgrading existing facilities.
Propane Dehydrogenation Technology Services Product Landscape
The Propane Dehydrogenation Technology Services market offers a range of solutions, including proprietary catalyst technologies, reactor designs, and process optimization services. Key features include improved catalyst activity, selectivity, and lifetime, along with enhanced energy efficiency and reduced emissions. These advancements translate to lower operating costs and reduced environmental impact, offering significant value propositions to clients.
Key Drivers, Barriers & Challenges in Propane Dehydrogenation Technology Services
Key Drivers:
- Rising demand for polypropylene in various applications (packaging, textiles, automotive).
- Increasing availability and cost-effectiveness of propane feedstock.
- Technological advancements leading to improved process efficiency and reduced operating costs.
Challenges & Restraints:
- Fluctuations in propane prices can affect the profitability of PDH operations.
- Stringent environmental regulations require compliance with emission standards, which can add to operational costs.
- Intense competition among technology providers can pressure pricing.
- The high capital investment required for setting up PDH plants can be a barrier to entry for smaller players.
Emerging Opportunities in Propane Dehydrogenation Technology Services
Emerging opportunities include:
- Expanding into untapped markets in developing economies.
- Developing innovative applications for propylene derived from PDH processes.
- Exploring opportunities in bio-propylene production using renewable feedstocks.
- Collaborations and partnerships to achieve greater efficiency and sustainability.
Growth Accelerators in the Propane Dehydrogenation Technology Services Industry
Technological breakthroughs in catalyst development, reactor design, and process intensification will drive significant growth. Strategic partnerships between technology providers and end-users can also accelerate market expansion. Expansion into new markets and diversification of applications will further propel growth in the coming years.
Key Players Shaping the Propane Dehydrogenation Technology Services Market
Notable Milestones in Propane Dehydrogenation Technology Services Sector
- 2021: Honeywell UOP launched its new generation of propane dehydrogenation catalyst.
- 2022: Lummus Technology secured a major contract for a new PDH plant in the Middle East.
- 2023: Several significant mergers and acquisitions occurred within the PDH technology services sector. (Specific details require further research to be added here).
In-Depth Propane Dehydrogenation Technology Services Market Outlook
The Propane Dehydrogenation Technology Services market is poised for sustained growth, driven by the factors outlined above. The continued expansion of the polypropylene industry, coupled with advancements in PDH technology, promises significant opportunities for technology providers and investors in the coming years. Strategic partnerships and diversification into new markets will be crucial for achieving long-term success in this competitive yet lucrative sector.
Propane Dehydrogenation Technology Services Segmentation
-
1. Application
- 1.1. Mixed Alkane Dehydrogenation
- 1.2. Propane Dehydrogenation
-
2. Types
- 2.1. Fixed Bed Reactor
- 2.2. Moving Bed Reactors
- 2.3. Fluidized Bed Reactor
Propane Dehydrogenation Technology Services Segmentation By Geography
-
1. North America
- 1.1. United States
- 1.2. Canada
- 1.3. Mexico
-
2. South America
- 2.1. Brazil
- 2.2. Argentina
- 2.3. Rest of South America
-
3. Europe
- 3.1. United Kingdom
- 3.2. Germany
- 3.3. France
- 3.4. Italy
- 3.5. Spain
- 3.6. Russia
- 3.7. Benelux
- 3.8. Nordics
- 3.9. Rest of Europe
-
4. Middle East & Africa
- 4.1. Turkey
- 4.2. Israel
- 4.3. GCC
- 4.4. North Africa
- 4.5. South Africa
- 4.6. Rest of Middle East & Africa
-
5. Asia Pacific
- 5.1. China
- 5.2. India
- 5.3. Japan
- 5.4. South Korea
- 5.5. ASEAN
- 5.6. Oceania
- 5.7. Rest of Asia Pacific
Propane Dehydrogenation Technology Services REPORT HIGHLIGHTS
| Aspects | Details |
|---|---|
| Study Period | 2019-2033 |
| Base Year | 2024 |
| Estimated Year | 2025 |
| Forecast Period | 2025-2033 |
| Historical Period | 2019-2024 |
| Growth Rate | CAGR of XX% from 2019-2033 |
| Segmentation |
|
Table of Contents
- 1. Introduction
- 1.1. Research Scope
- 1.2. Market Segmentation
- 1.3. Research Methodology
- 1.4. Definitions and Assumptions
- 2. Executive Summary
- 2.1. Introduction
- 3. Market Dynamics
- 3.1. Introduction
- 3.2. Market Drivers
- 3.3. Market Restrains
- 3.4. Market Trends
- 4. Market Factor Analysis
- 4.1. Porters Five Forces
- 4.2. Supply/Value Chain
- 4.3. PESTEL analysis
- 4.4. Market Entropy
- 4.5. Patent/Trademark Analysis
- 5. Global Propane Dehydrogenation Technology Services Analysis, Insights and Forecast, 2019-2031
- 5.1. Market Analysis, Insights and Forecast - by Application
- 5.1.1. Mixed Alkane Dehydrogenation
- 5.1.2. Propane Dehydrogenation
- 5.2. Market Analysis, Insights and Forecast - by Types
- 5.2.1. Fixed Bed Reactor
- 5.2.2. Moving Bed Reactors
- 5.2.3. Fluidized Bed Reactor
- 5.3. Market Analysis, Insights and Forecast - by Region
- 5.3.1. North America
- 5.3.2. South America
- 5.3.3. Europe
- 5.3.4. Middle East & Africa
- 5.3.5. Asia Pacific
- 5.1. Market Analysis, Insights and Forecast - by Application
- 6. North America Propane Dehydrogenation Technology Services Analysis, Insights and Forecast, 2019-2031
- 6.1. Market Analysis, Insights and Forecast - by Application
- 6.1.1. Mixed Alkane Dehydrogenation
- 6.1.2. Propane Dehydrogenation
- 6.2. Market Analysis, Insights and Forecast - by Types
- 6.2.1. Fixed Bed Reactor
- 6.2.2. Moving Bed Reactors
- 6.2.3. Fluidized Bed Reactor
- 6.1. Market Analysis, Insights and Forecast - by Application
- 7. South America Propane Dehydrogenation Technology Services Analysis, Insights and Forecast, 2019-2031
- 7.1. Market Analysis, Insights and Forecast - by Application
- 7.1.1. Mixed Alkane Dehydrogenation
- 7.1.2. Propane Dehydrogenation
- 7.2. Market Analysis, Insights and Forecast - by Types
- 7.2.1. Fixed Bed Reactor
- 7.2.2. Moving Bed Reactors
- 7.2.3. Fluidized Bed Reactor
- 7.1. Market Analysis, Insights and Forecast - by Application
- 8. Europe Propane Dehydrogenation Technology Services Analysis, Insights and Forecast, 2019-2031
- 8.1. Market Analysis, Insights and Forecast - by Application
- 8.1.1. Mixed Alkane Dehydrogenation
- 8.1.2. Propane Dehydrogenation
- 8.2. Market Analysis, Insights and Forecast - by Types
- 8.2.1. Fixed Bed Reactor
- 8.2.2. Moving Bed Reactors
- 8.2.3. Fluidized Bed Reactor
- 8.1. Market Analysis, Insights and Forecast - by Application
- 9. Middle East & Africa Propane Dehydrogenation Technology Services Analysis, Insights and Forecast, 2019-2031
- 9.1. Market Analysis, Insights and Forecast - by Application
- 9.1.1. Mixed Alkane Dehydrogenation
- 9.1.2. Propane Dehydrogenation
- 9.2. Market Analysis, Insights and Forecast - by Types
- 9.2.1. Fixed Bed Reactor
- 9.2.2. Moving Bed Reactors
- 9.2.3. Fluidized Bed Reactor
- 9.1. Market Analysis, Insights and Forecast - by Application
- 10. Asia Pacific Propane Dehydrogenation Technology Services Analysis, Insights and Forecast, 2019-2031
- 10.1. Market Analysis, Insights and Forecast - by Application
- 10.1.1. Mixed Alkane Dehydrogenation
- 10.1.2. Propane Dehydrogenation
- 10.2. Market Analysis, Insights and Forecast - by Types
- 10.2.1. Fixed Bed Reactor
- 10.2.2. Moving Bed Reactors
- 10.2.3. Fluidized Bed Reactor
- 10.1. Market Analysis, Insights and Forecast - by Application
- 11. Competitive Analysis
- 11.1. Global Market Share Analysis 2024
- 11.2. Company Profiles
- 11.2.1 Honeywell UOP
- 11.2.1.1. Overview
- 11.2.1.2. Products
- 11.2.1.3. SWOT Analysis
- 11.2.1.4. Recent Developments
- 11.2.1.5. Financials (Based on Availability)
- 11.2.2 Lummus Technology
- 11.2.2.1. Overview
- 11.2.2.2. Products
- 11.2.2.3. SWOT Analysis
- 11.2.2.4. Recent Developments
- 11.2.2.5. Financials (Based on Availability)
- 11.2.3 thyssenkruppp Uhde
- 11.2.3.1. Overview
- 11.2.3.2. Products
- 11.2.3.3. SWOT Analysis
- 11.2.3.4. Recent Developments
- 11.2.3.5. Financials (Based on Availability)
- 11.2.4 Linde
- 11.2.4.1. Overview
- 11.2.4.2. Products
- 11.2.4.3. SWOT Analysis
- 11.2.4.4. Recent Developments
- 11.2.4.5. Financials (Based on Availability)
- 11.2.5 Saipem SpA
- 11.2.5.1. Overview
- 11.2.5.2. Products
- 11.2.5.3. SWOT Analysis
- 11.2.5.4. Recent Developments
- 11.2.5.5. Financials (Based on Availability)
- 11.2.6 Dow
- 11.2.6.1. Overview
- 11.2.6.2. Products
- 11.2.6.3. SWOT Analysis
- 11.2.6.4. Recent Developments
- 11.2.6.5. Financials (Based on Availability)
- 11.2.7 KBR
- 11.2.7.1. Overview
- 11.2.7.2. Products
- 11.2.7.3. SWOT Analysis
- 11.2.7.4. Recent Developments
- 11.2.7.5. Financials (Based on Availability)
- 11.2.8 Sinopec
- 11.2.8.1. Overview
- 11.2.8.2. Products
- 11.2.8.3. SWOT Analysis
- 11.2.8.4. Recent Developments
- 11.2.8.5. Financials (Based on Availability)
- 11.2.1 Honeywell UOP
List of Figures
- Figure 1: Global Propane Dehydrogenation Technology Services Revenue Breakdown (million, %) by Region 2024 & 2032
- Figure 2: North America Propane Dehydrogenation Technology Services Revenue (million), by Application 2024 & 2032
- Figure 3: North America Propane Dehydrogenation Technology Services Revenue Share (%), by Application 2024 & 2032
- Figure 4: North America Propane Dehydrogenation Technology Services Revenue (million), by Types 2024 & 2032
- Figure 5: North America Propane Dehydrogenation Technology Services Revenue Share (%), by Types 2024 & 2032
- Figure 6: North America Propane Dehydrogenation Technology Services Revenue (million), by Country 2024 & 2032
- Figure 7: North America Propane Dehydrogenation Technology Services Revenue Share (%), by Country 2024 & 2032
- Figure 8: South America Propane Dehydrogenation Technology Services Revenue (million), by Application 2024 & 2032
- Figure 9: South America Propane Dehydrogenation Technology Services Revenue Share (%), by Application 2024 & 2032
- Figure 10: South America Propane Dehydrogenation Technology Services Revenue (million), by Types 2024 & 2032
- Figure 11: South America Propane Dehydrogenation Technology Services Revenue Share (%), by Types 2024 & 2032
- Figure 12: South America Propane Dehydrogenation Technology Services Revenue (million), by Country 2024 & 2032
- Figure 13: South America Propane Dehydrogenation Technology Services Revenue Share (%), by Country 2024 & 2032
- Figure 14: Europe Propane Dehydrogenation Technology Services Revenue (million), by Application 2024 & 2032
- Figure 15: Europe Propane Dehydrogenation Technology Services Revenue Share (%), by Application 2024 & 2032
- Figure 16: Europe Propane Dehydrogenation Technology Services Revenue (million), by Types 2024 & 2032
- Figure 17: Europe Propane Dehydrogenation Technology Services Revenue Share (%), by Types 2024 & 2032
- Figure 18: Europe Propane Dehydrogenation Technology Services Revenue (million), by Country 2024 & 2032
- Figure 19: Europe Propane Dehydrogenation Technology Services Revenue Share (%), by Country 2024 & 2032
- Figure 20: Middle East & Africa Propane Dehydrogenation Technology Services Revenue (million), by Application 2024 & 2032
- Figure 21: Middle East & Africa Propane Dehydrogenation Technology Services Revenue Share (%), by Application 2024 & 2032
- Figure 22: Middle East & Africa Propane Dehydrogenation Technology Services Revenue (million), by Types 2024 & 2032
- Figure 23: Middle East & Africa Propane Dehydrogenation Technology Services Revenue Share (%), by Types 2024 & 2032
- Figure 24: Middle East & Africa Propane Dehydrogenation Technology Services Revenue (million), by Country 2024 & 2032
- Figure 25: Middle East & Africa Propane Dehydrogenation Technology Services Revenue Share (%), by Country 2024 & 2032
- Figure 26: Asia Pacific Propane Dehydrogenation Technology Services Revenue (million), by Application 2024 & 2032
- Figure 27: Asia Pacific Propane Dehydrogenation Technology Services Revenue Share (%), by Application 2024 & 2032
- Figure 28: Asia Pacific Propane Dehydrogenation Technology Services Revenue (million), by Types 2024 & 2032
- Figure 29: Asia Pacific Propane Dehydrogenation Technology Services Revenue Share (%), by Types 2024 & 2032
- Figure 30: Asia Pacific Propane Dehydrogenation Technology Services Revenue (million), by Country 2024 & 2032
- Figure 31: Asia Pacific Propane Dehydrogenation Technology Services Revenue Share (%), by Country 2024 & 2032
List of Tables
- Table 1: Global Propane Dehydrogenation Technology Services Revenue million Forecast, by Region 2019 & 2032
- Table 2: Global Propane Dehydrogenation Technology Services Revenue million Forecast, by Application 2019 & 2032
- Table 3: Global Propane Dehydrogenation Technology Services Revenue million Forecast, by Types 2019 & 2032
- Table 4: Global Propane Dehydrogenation Technology Services Revenue million Forecast, by Region 2019 & 2032
- Table 5: Global Propane Dehydrogenation Technology Services Revenue million Forecast, by Application 2019 & 2032
- Table 6: Global Propane Dehydrogenation Technology Services Revenue million Forecast, by Types 2019 & 2032
- Table 7: Global Propane Dehydrogenation Technology Services Revenue million Forecast, by Country 2019 & 2032
- Table 8: United States Propane Dehydrogenation Technology Services Revenue (million) Forecast, by Application 2019 & 2032
- Table 9: Canada Propane Dehydrogenation Technology Services Revenue (million) Forecast, by Application 2019 & 2032
- Table 10: Mexico Propane Dehydrogenation Technology Services Revenue (million) Forecast, by Application 2019 & 2032
- Table 11: Global Propane Dehydrogenation Technology Services Revenue million Forecast, by Application 2019 & 2032
- Table 12: Global Propane Dehydrogenation Technology Services Revenue million Forecast, by Types 2019 & 2032
- Table 13: Global Propane Dehydrogenation Technology Services Revenue million Forecast, by Country 2019 & 2032
- Table 14: Brazil Propane Dehydrogenation Technology Services Revenue (million) Forecast, by Application 2019 & 2032
- Table 15: Argentina Propane Dehydrogenation Technology Services Revenue (million) Forecast, by Application 2019 & 2032
- Table 16: Rest of South America Propane Dehydrogenation Technology Services Revenue (million) Forecast, by Application 2019 & 2032
- Table 17: Global Propane Dehydrogenation Technology Services Revenue million Forecast, by Application 2019 & 2032
- Table 18: Global Propane Dehydrogenation Technology Services Revenue million Forecast, by Types 2019 & 2032
- Table 19: Global Propane Dehydrogenation Technology Services Revenue million Forecast, by Country 2019 & 2032
- Table 20: United Kingdom Propane Dehydrogenation Technology Services Revenue (million) Forecast, by Application 2019 & 2032
- Table 21: Germany Propane Dehydrogenation Technology Services Revenue (million) Forecast, by Application 2019 & 2032
- Table 22: France Propane Dehydrogenation Technology Services Revenue (million) Forecast, by Application 2019 & 2032
- Table 23: Italy Propane Dehydrogenation Technology Services Revenue (million) Forecast, by Application 2019 & 2032
- Table 24: Spain Propane Dehydrogenation Technology Services Revenue (million) Forecast, by Application 2019 & 2032
- Table 25: Russia Propane Dehydrogenation Technology Services Revenue (million) Forecast, by Application 2019 & 2032
- Table 26: Benelux Propane Dehydrogenation Technology Services Revenue (million) Forecast, by Application 2019 & 2032
- Table 27: Nordics Propane Dehydrogenation Technology Services Revenue (million) Forecast, by Application 2019 & 2032
- Table 28: Rest of Europe Propane Dehydrogenation Technology Services Revenue (million) Forecast, by Application 2019 & 2032
- Table 29: Global Propane Dehydrogenation Technology Services Revenue million Forecast, by Application 2019 & 2032
- Table 30: Global Propane Dehydrogenation Technology Services Revenue million Forecast, by Types 2019 & 2032
- Table 31: Global Propane Dehydrogenation Technology Services Revenue million Forecast, by Country 2019 & 2032
- Table 32: Turkey Propane Dehydrogenation Technology Services Revenue (million) Forecast, by Application 2019 & 2032
- Table 33: Israel Propane Dehydrogenation Technology Services Revenue (million) Forecast, by Application 2019 & 2032
- Table 34: GCC Propane Dehydrogenation Technology Services Revenue (million) Forecast, by Application 2019 & 2032
- Table 35: North Africa Propane Dehydrogenation Technology Services Revenue (million) Forecast, by Application 2019 & 2032
- Table 36: South Africa Propane Dehydrogenation Technology Services Revenue (million) Forecast, by Application 2019 & 2032
- Table 37: Rest of Middle East & Africa Propane Dehydrogenation Technology Services Revenue (million) Forecast, by Application 2019 & 2032
- Table 38: Global Propane Dehydrogenation Technology Services Revenue million Forecast, by Application 2019 & 2032
- Table 39: Global Propane Dehydrogenation Technology Services Revenue million Forecast, by Types 2019 & 2032
- Table 40: Global Propane Dehydrogenation Technology Services Revenue million Forecast, by Country 2019 & 2032
- Table 41: China Propane Dehydrogenation Technology Services Revenue (million) Forecast, by Application 2019 & 2032
- Table 42: India Propane Dehydrogenation Technology Services Revenue (million) Forecast, by Application 2019 & 2032
- Table 43: Japan Propane Dehydrogenation Technology Services Revenue (million) Forecast, by Application 2019 & 2032
- Table 44: South Korea Propane Dehydrogenation Technology Services Revenue (million) Forecast, by Application 2019 & 2032
- Table 45: ASEAN Propane Dehydrogenation Technology Services Revenue (million) Forecast, by Application 2019 & 2032
- Table 46: Oceania Propane Dehydrogenation Technology Services Revenue (million) Forecast, by Application 2019 & 2032
- Table 47: Rest of Asia Pacific Propane Dehydrogenation Technology Services Revenue (million) Forecast, by Application 2019 & 2032
Frequently Asked Questions
1. What is the projected Compound Annual Growth Rate (CAGR) of the Propane Dehydrogenation Technology Services?
The projected CAGR is approximately XX%.
2. Which companies are prominent players in the Propane Dehydrogenation Technology Services?
Key companies in the market include Honeywell UOP, Lummus Technology, thyssenkruppp Uhde, Linde, Saipem SpA, Dow, KBR, Sinopec.
3. What are the main segments of the Propane Dehydrogenation Technology Services?
The market segments include Application, Types.
4. Can you provide details about the market size?
The market size is estimated to be USD XXX million as of 2022.
5. What are some drivers contributing to market growth?
N/A
6. What are the notable trends driving market growth?
N/A
7. Are there any restraints impacting market growth?
N/A
8. Can you provide examples of recent developments in the market?
N/A
9. What pricing options are available for accessing the report?
Pricing options include single-user, multi-user, and enterprise licenses priced at USD 4350.00, USD 6525.00, and USD 8700.00 respectively.
10. Is the market size provided in terms of value or volume?
The market size is provided in terms of value, measured in million.
11. Are there any specific market keywords associated with the report?
Yes, the market keyword associated with the report is "Propane Dehydrogenation Technology Services," which aids in identifying and referencing the specific market segment covered.
12. How do I determine which pricing option suits my needs best?
The pricing options vary based on user requirements and access needs. Individual users may opt for single-user licenses, while businesses requiring broader access may choose multi-user or enterprise licenses for cost-effective access to the report.
13. Are there any additional resources or data provided in the Propane Dehydrogenation Technology Services report?
While the report offers comprehensive insights, it's advisable to review the specific contents or supplementary materials provided to ascertain if additional resources or data are available.
14. How can I stay updated on further developments or reports in the Propane Dehydrogenation Technology Services?
To stay informed about further developments, trends, and reports in the Propane Dehydrogenation Technology Services, consider subscribing to industry newsletters, following relevant companies and organizations, or regularly checking reputable industry news sources and publications.
Methodology
Step 1 - Identification of Relevant Samples Size from Population Database


Step 2 - Approaches for Defining Global Market Size (Value, Volume* & Price*)

Note*: In applicable scenarios
Step 3 - Data Sources
Primary Research
- Web Analytics
- Survey Reports
- Research Institute
- Latest Research Reports
- Opinion Leaders
Secondary Research
- Annual Reports
- White Paper
- Latest Press Release
- Industry Association
- Paid Database
- Investor Presentations

Step 4 - Data Triangulation
Involves using different sources of information in order to increase the validity of a study
These sources are likely to be stakeholders in a program - participants, other researchers, program staff, other community members, and so on.
Then we put all data in single framework & apply various statistical tools to find out the dynamic on the market.
During the analysis stage, feedback from the stakeholder groups would be compared to determine areas of agreement as well as areas of divergence
