

Key Insights
The rapid application development (RAD) market is experiencing explosive growth, fueled by the increasing demand for faster software delivery and digital transformation initiatives across various sectors. The market's 42.80% CAGR from 2019-2033 indicates a significant upward trajectory, driven by factors such as the rising adoption of cloud-based solutions, the need for agile development methodologies, and the increasing complexity of business processes requiring efficient software solutions. The prevalence of low-code and no-code platforms empowers citizen developers and accelerates development cycles, further boosting market expansion. Key segments like BFSI, retail and e-commerce, and healthcare are witnessing rapid adoption due to the need for customized applications and improved operational efficiency. Large enterprises are driving significant market share due to their higher budgets and complex application requirements, although SMEs are also actively adopting RAD solutions to improve competitiveness and streamline operations. The global market is witnessing a geographical spread of adoption, with North America maintaining a significant share due to early adoption and robust technological infrastructure, but regions like Asia-Pacific exhibiting rapid growth due to increasing digitalization efforts. Competition is fierce, with established players like IBM, Salesforce, and Microsoft vying for market share alongside emerging specialized providers. The future growth will likely be shaped by advancements in AI integration within RAD platforms, enhanced security features, and increasing focus on platform interoperability.
The dominance of cloud-based deployment models is expected to continue, offering scalability and cost-effectiveness. However, security concerns surrounding cloud-based solutions remain a potential restraint. The future success of RAD providers will hinge on their ability to offer innovative features, integrate seamlessly with existing systems, and provide robust customer support. The ongoing expansion into emerging markets and the development of more intuitive and user-friendly platforms will play a crucial role in shaping the future landscape of the RAD market. While the market presents immense potential, companies need to strategically address the challenges related to data security, platform integration and skill gap to fully capitalize on the opportunities.
Rapid App Development Industry Market Report: 2019-2033
This comprehensive report provides an in-depth analysis of the Rapid Application Development (RAD) industry, encompassing market dynamics, growth trends, dominant segments, and key players. With a study period spanning 2019-2033, a base year of 2025, and a forecast period of 2025-2033, this report offers invaluable insights for businesses, investors, and industry professionals seeking to navigate this rapidly evolving landscape. The report covers the parent market of Software Development and the child market of Rapid Application Development. The market size is projected to reach xx Million by 2033.
Rapid App Development Industry Market Dynamics & Structure
The Rapid App Development market is characterized by a moderately concentrated structure, with several major players holding significant market share. However, the emergence of numerous niche players and open-source solutions is increasing competition. Technological innovation, particularly in areas like AI-powered development and low-code/no-code platforms, is a major driver. Regulatory frameworks concerning data privacy and security are shaping market practices, while the availability of cloud computing resources significantly impacts deployment models. M&A activity is relatively high, reflecting consolidation and expansion strategies among key players. Substitutes include traditional software development methodologies, but RAD's speed and efficiency offer a compelling advantage. End-user demographics are diverse, encompassing small and large enterprises across various industries.
- Market Concentration: Moderately concentrated, with top 10 players holding approximately xx% market share in 2025.
- Technological Innovation: AI, machine learning, and automation are driving efficiency gains.
- Regulatory Frameworks: GDPR, CCPA, and other regulations influence data handling and security protocols.
- Competitive Substitutes: Traditional development methods face increasing competition from RAD solutions.
- M&A Activity: xx M&A deals recorded in the historical period (2019-2024), with an expected xx% increase in the forecast period.
- Innovation Barriers: High initial investment in infrastructure and skilled labor can be a barrier to entry for smaller players.
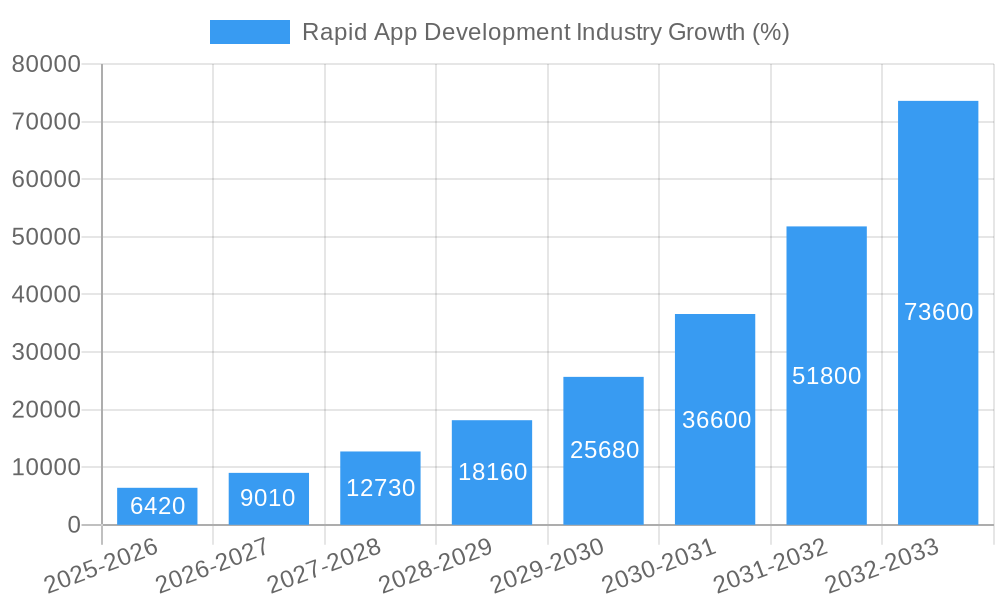
Rapid App Development Industry Growth Trends & Insights
The Rapid App Development market has witnessed significant growth over the past years, driven by increasing demand for faster application delivery and digital transformation initiatives across various sectors. The market size experienced a CAGR of xx% during the historical period (2019-2024) and is projected to maintain a CAGR of xx% during the forecast period (2025-2033). This growth is fueled by rising adoption of cloud-based solutions, the proliferation of low-code/no-code platforms, and increasing demand from SMEs and large enterprises seeking agile development capabilities. Technological disruptions, such as the introduction of AI-powered development tools, are further accelerating market growth. Shifting consumer preferences towards mobile-first and personalized experiences are also major contributors to market expansion. Market penetration is expected to reach xx% by 2033.
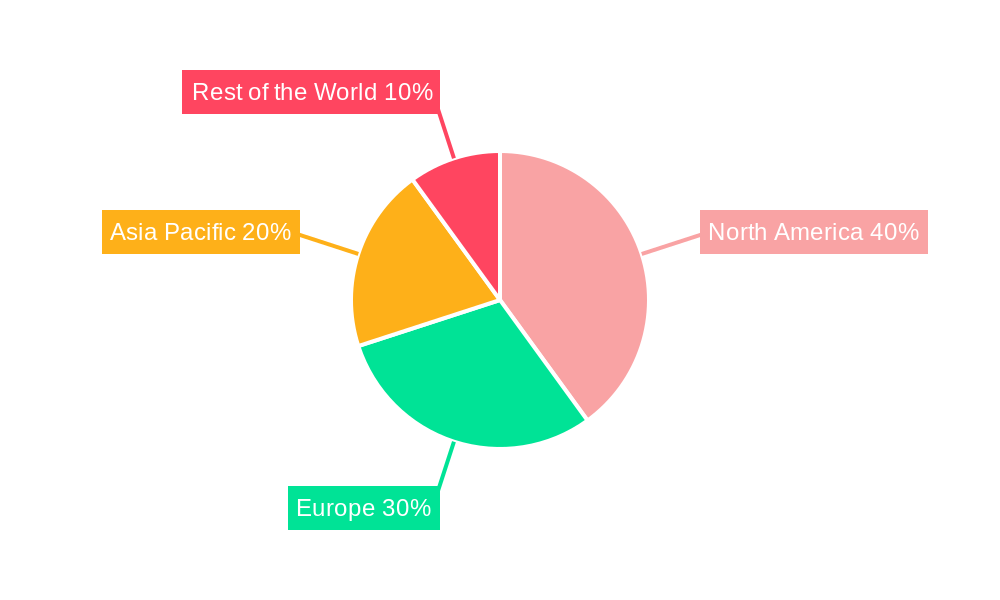
Dominant Regions, Countries, or Segments in Rapid App Development Industry
North America currently dominates the Rapid App Development market, driven by high technology adoption, robust digital infrastructure, and the presence of major technology vendors. However, Asia-Pacific is projected to witness the fastest growth rate during the forecast period due to increasing digitalization efforts and rising investments in IT infrastructure across emerging economies.
By Type: Low-code platforms are currently the dominant segment, but no-code platforms are experiencing rapid growth fueled by their ease of use and accessibility.
By Deployment Mode: Cloud-based deployment dominates, driven by scalability, cost-effectiveness, and accessibility.
By Organization Size: Large enterprises are the primary drivers of market growth due to their higher IT budgets and complex application needs. However, the SME segment is showing significant growth potential.
By End-user Industry: BFSI and IT sectors are major contributors due to their high reliance on technology and agile development needs. Growth in the healthcare and retail sectors is also notable.
- North America: High technology adoption and presence of major vendors drive dominance.
- Asia-Pacific: Fastest growth potential due to increasing digitalization and IT investments.
- Europe: Steady growth, influenced by regulations and government initiatives.
- Low-Code Platforms: Dominant segment due to wider functionality and flexibility.
- Cloud Deployment: Preferred deployment model for scalability and cost benefits.
- Large Enterprises: Higher IT budgets and complex application needs contribute to market dominance.
Rapid App Development Industry Product Landscape
The RAD product landscape is characterized by a diverse range of low-code, no-code platforms, and integrated development environments (IDEs). These platforms offer features like drag-and-drop interfaces, pre-built components, and automated testing capabilities to accelerate development cycles. Key differentiators include ease of use, integration capabilities, scalability, security features, and the level of customization offered. Technological advancements focus on AI-powered features like code generation, predictive analytics, and automated debugging to further enhance efficiency and reduce development time.
Key Drivers, Barriers & Challenges in Rapid App Development Industry
Key Drivers:
- Increased demand for faster application delivery.
- Rising adoption of cloud computing and digital transformation initiatives.
- Growth of the mobile-first economy.
- Emergence of low-code/no-code platforms.
Challenges:
- The high initial investment in infrastructure and skilled labor can be a barrier to entry for smaller players.
- Security concerns and data breaches remain a significant challenge, especially in cloud-based deployments.
- Integration with legacy systems can be complex and time-consuming.
- Competition from traditional software development methods and open-source solutions.
- Dependence on vendor lock-in.
Emerging Opportunities in Rapid App Development Industry
- Expansion into untapped markets in developing economies.
- Development of specialized RAD solutions for specific industry verticals.
- Integration of AI and machine learning to further automate development processes.
- Focus on citizen developers and empowering non-technical users to create applications.
- Rise of serverless computing and its integration with RAD platforms.
Growth Accelerators in the Rapid App Development Industry
Technological advancements in AI, machine learning, and automation are major catalysts for long-term growth. Strategic partnerships between RAD platform providers and cloud service providers are expanding market reach and capabilities. Government initiatives promoting digital transformation are fueling adoption across various sectors. Expansion into new geographic markets and the development of specialized industry solutions are also key growth drivers.
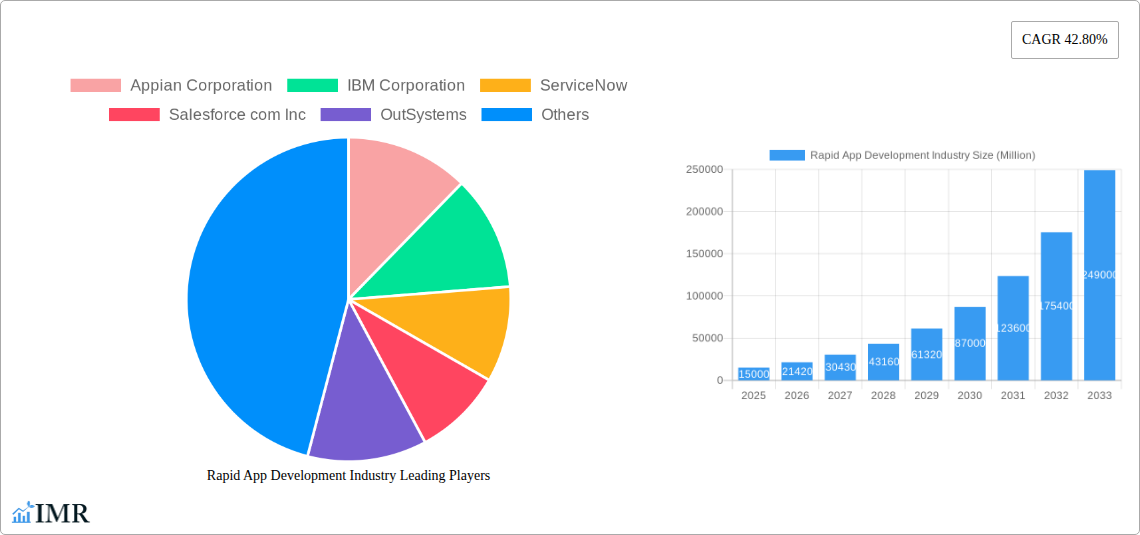
Key Players Shaping the Rapid App Development Industry Market
- Appian Corporation
- IBM Corporation
- ServiceNow
- Salesforce com Inc
- OutSystems
- Microsoft Corporation
- Amazon Web Services Inc
- Oracle Corporation
- Zoho Corporation Private Limited
- LANSA
- List Not Exhaustive
Notable Milestones in Rapid App Development Industry Sector
- November 2021: Datacentrix partners with OutSystems to expand its application development capabilities in Africa and the Middle East. This partnership highlights the growing demand for rapid application development solutions in these regions.
In-Depth Rapid App Development Industry Market Outlook
The Rapid App Development market is poised for continued robust growth, driven by ongoing technological innovation, increased cloud adoption, and the growing need for agile development capabilities across various industries. Strategic partnerships, expansion into new markets, and the emergence of AI-powered development tools will shape future market dynamics. Opportunities exist in developing niche solutions for specific industry verticals and empowering citizen developers. The market is expected to witness a steady increase in the adoption of low-code/no-code platforms, leading to further expansion in the coming years.
Rapid App Development Industry Segmentation
-
1. Type
- 1.1. Low-Code Development Platforms
- 1.2. No-Code Development Platforms
-
2. Deployment Mode
- 2.1. On-Premise
- 2.2. Cloud
-
3. Organization Size
- 3.1. Small and Medium Enterprises
- 3.2. Large Enterprises
-
4. End-user Industry
- 4.1. BFSI
- 4.2. Retail and E-commerce
- 4.3. Government and Defense
- 4.4. Healthcare
- 4.5. Information Technology
- 4.6. Other En
Rapid App Development Industry Segmentation By Geography
- 1. North America
- 2. Europe
- 3. Asia Pacific
- 4. Rest of the World
Rapid App Development Industry REPORT HIGHLIGHTS
| Aspects | Details |
|---|---|
| Study Period | 2019-2033 |
| Base Year | 2024 |
| Estimated Year | 2025 |
| Forecast Period | 2025-2033 |
| Historical Period | 2019-2024 |
| Growth Rate | CAGR of 42.80% from 2019-2033 |
| Segmentation |
|
Table of Contents
- 1. Introduction
- 1.1. Research Scope
- 1.2. Market Segmentation
- 1.3. Research Methodology
- 1.4. Definitions and Assumptions
- 2. Executive Summary
- 2.1. Introduction
- 3. Market Dynamics
- 3.1. Introduction
- 3.2. Market Drivers
- 3.2.1. Innovation in the Businesses and Integration of Advanced Technologies; Flexibility to Customize Solutions as per an Organizations Dynamic Requirements
- 3.3. Market Restrains
- 3.3.1. Lack of Skilled Professionals
- 3.4. Market Trends
- 3.4.1. Small and Medium-sized Enterprises To Drive the Market Growth
- 4. Market Factor Analysis
- 4.1. Porters Five Forces
- 4.2. Supply/Value Chain
- 4.3. PESTEL analysis
- 4.4. Market Entropy
- 4.5. Patent/Trademark Analysis
- 5. Global Rapid App Development Industry Analysis, Insights and Forecast, 2019-2031
- 5.1. Market Analysis, Insights and Forecast - by Type
- 5.1.1. Low-Code Development Platforms
- 5.1.2. No-Code Development Platforms
- 5.2. Market Analysis, Insights and Forecast - by Deployment Mode
- 5.2.1. On-Premise
- 5.2.2. Cloud
- 5.3. Market Analysis, Insights and Forecast - by Organization Size
- 5.3.1. Small and Medium Enterprises
- 5.3.2. Large Enterprises
- 5.4. Market Analysis, Insights and Forecast - by End-user Industry
- 5.4.1. BFSI
- 5.4.2. Retail and E-commerce
- 5.4.3. Government and Defense
- 5.4.4. Healthcare
- 5.4.5. Information Technology
- 5.4.6. Other En
- 5.5. Market Analysis, Insights and Forecast - by Region
- 5.5.1. North America
- 5.5.2. Europe
- 5.5.3. Asia Pacific
- 5.5.4. Rest of the World
- 5.1. Market Analysis, Insights and Forecast - by Type
- 6. North America Rapid App Development Industry Analysis, Insights and Forecast, 2019-2031
- 6.1. Market Analysis, Insights and Forecast - by Type
- 6.1.1. Low-Code Development Platforms
- 6.1.2. No-Code Development Platforms
- 6.2. Market Analysis, Insights and Forecast - by Deployment Mode
- 6.2.1. On-Premise
- 6.2.2. Cloud
- 6.3. Market Analysis, Insights and Forecast - by Organization Size
- 6.3.1. Small and Medium Enterprises
- 6.3.2. Large Enterprises
- 6.4. Market Analysis, Insights and Forecast - by End-user Industry
- 6.4.1. BFSI
- 6.4.2. Retail and E-commerce
- 6.4.3. Government and Defense
- 6.4.4. Healthcare
- 6.4.5. Information Technology
- 6.4.6. Other En
- 6.1. Market Analysis, Insights and Forecast - by Type
- 7. Europe Rapid App Development Industry Analysis, Insights and Forecast, 2019-2031
- 7.1. Market Analysis, Insights and Forecast - by Type
- 7.1.1. Low-Code Development Platforms
- 7.1.2. No-Code Development Platforms
- 7.2. Market Analysis, Insights and Forecast - by Deployment Mode
- 7.2.1. On-Premise
- 7.2.2. Cloud
- 7.3. Market Analysis, Insights and Forecast - by Organization Size
- 7.3.1. Small and Medium Enterprises
- 7.3.2. Large Enterprises
- 7.4. Market Analysis, Insights and Forecast - by End-user Industry
- 7.4.1. BFSI
- 7.4.2. Retail and E-commerce
- 7.4.3. Government and Defense
- 7.4.4. Healthcare
- 7.4.5. Information Technology
- 7.4.6. Other En
- 7.1. Market Analysis, Insights and Forecast - by Type
- 8. Asia Pacific Rapid App Development Industry Analysis, Insights and Forecast, 2019-2031
- 8.1. Market Analysis, Insights and Forecast - by Type
- 8.1.1. Low-Code Development Platforms
- 8.1.2. No-Code Development Platforms
- 8.2. Market Analysis, Insights and Forecast - by Deployment Mode
- 8.2.1. On-Premise
- 8.2.2. Cloud
- 8.3. Market Analysis, Insights and Forecast - by Organization Size
- 8.3.1. Small and Medium Enterprises
- 8.3.2. Large Enterprises
- 8.4. Market Analysis, Insights and Forecast - by End-user Industry
- 8.4.1. BFSI
- 8.4.2. Retail and E-commerce
- 8.4.3. Government and Defense
- 8.4.4. Healthcare
- 8.4.5. Information Technology
- 8.4.6. Other En
- 8.1. Market Analysis, Insights and Forecast - by Type
- 9. Rest of the World Rapid App Development Industry Analysis, Insights and Forecast, 2019-2031
- 9.1. Market Analysis, Insights and Forecast - by Type
- 9.1.1. Low-Code Development Platforms
- 9.1.2. No-Code Development Platforms
- 9.2. Market Analysis, Insights and Forecast - by Deployment Mode
- 9.2.1. On-Premise
- 9.2.2. Cloud
- 9.3. Market Analysis, Insights and Forecast - by Organization Size
- 9.3.1. Small and Medium Enterprises
- 9.3.2. Large Enterprises
- 9.4. Market Analysis, Insights and Forecast - by End-user Industry
- 9.4.1. BFSI
- 9.4.2. Retail and E-commerce
- 9.4.3. Government and Defense
- 9.4.4. Healthcare
- 9.4.5. Information Technology
- 9.4.6. Other En
- 9.1. Market Analysis, Insights and Forecast - by Type
- 10. North America Rapid App Development Industry Analysis, Insights and Forecast, 2019-2031
- 10.1. Market Analysis, Insights and Forecast - By Country/Sub-region
- 10.1.1.
- 11. Europe Rapid App Development Industry Analysis, Insights and Forecast, 2019-2031
- 11.1. Market Analysis, Insights and Forecast - By Country/Sub-region
- 11.1.1.
- 12. Asia Pacific Rapid App Development Industry Analysis, Insights and Forecast, 2019-2031
- 12.1. Market Analysis, Insights and Forecast - By Country/Sub-region
- 12.1.1.
- 13. Rest of the World Rapid App Development Industry Analysis, Insights and Forecast, 2019-2031
- 13.1. Market Analysis, Insights and Forecast - By Country/Sub-region
- 13.1.1.
- 14. Competitive Analysis
- 14.1. Global Market Share Analysis 2024
- 14.2. Company Profiles
- 14.2.1 Appian Corporation
- 14.2.1.1. Overview
- 14.2.1.2. Products
- 14.2.1.3. SWOT Analysis
- 14.2.1.4. Recent Developments
- 14.2.1.5. Financials (Based on Availability)
- 14.2.2 IBM Corporation
- 14.2.2.1. Overview
- 14.2.2.2. Products
- 14.2.2.3. SWOT Analysis
- 14.2.2.4. Recent Developments
- 14.2.2.5. Financials (Based on Availability)
- 14.2.3 ServiceNow
- 14.2.3.1. Overview
- 14.2.3.2. Products
- 14.2.3.3. SWOT Analysis
- 14.2.3.4. Recent Developments
- 14.2.3.5. Financials (Based on Availability)
- 14.2.4 Salesforce com Inc
- 14.2.4.1. Overview
- 14.2.4.2. Products
- 14.2.4.3. SWOT Analysis
- 14.2.4.4. Recent Developments
- 14.2.4.5. Financials (Based on Availability)
- 14.2.5 OutSystems
- 14.2.5.1. Overview
- 14.2.5.2. Products
- 14.2.5.3. SWOT Analysis
- 14.2.5.4. Recent Developments
- 14.2.5.5. Financials (Based on Availability)
- 14.2.6 Microsoft Corporation
- 14.2.6.1. Overview
- 14.2.6.2. Products
- 14.2.6.3. SWOT Analysis
- 14.2.6.4. Recent Developments
- 14.2.6.5. Financials (Based on Availability)
- 14.2.7 Amazon Web Services Inc
- 14.2.7.1. Overview
- 14.2.7.2. Products
- 14.2.7.3. SWOT Analysis
- 14.2.7.4. Recent Developments
- 14.2.7.5. Financials (Based on Availability)
- 14.2.8 Oracle Corporation
- 14.2.8.1. Overview
- 14.2.8.2. Products
- 14.2.8.3. SWOT Analysis
- 14.2.8.4. Recent Developments
- 14.2.8.5. Financials (Based on Availability)
- 14.2.9 Zoho Corporation Private Limited
- 14.2.9.1. Overview
- 14.2.9.2. Products
- 14.2.9.3. SWOT Analysis
- 14.2.9.4. Recent Developments
- 14.2.9.5. Financials (Based on Availability)
- 14.2.10 LANSA*List Not Exhaustive
- 14.2.10.1. Overview
- 14.2.10.2. Products
- 14.2.10.3. SWOT Analysis
- 14.2.10.4. Recent Developments
- 14.2.10.5. Financials (Based on Availability)
- 14.2.1 Appian Corporation
List of Figures
- Figure 1: Global Rapid App Development Industry Revenue Breakdown (Million, %) by Region 2024 & 2032
- Figure 2: North America Rapid App Development Industry Revenue (Million), by Country 2024 & 2032
- Figure 3: North America Rapid App Development Industry Revenue Share (%), by Country 2024 & 2032
- Figure 4: Europe Rapid App Development Industry Revenue (Million), by Country 2024 & 2032
- Figure 5: Europe Rapid App Development Industry Revenue Share (%), by Country 2024 & 2032
- Figure 6: Asia Pacific Rapid App Development Industry Revenue (Million), by Country 2024 & 2032
- Figure 7: Asia Pacific Rapid App Development Industry Revenue Share (%), by Country 2024 & 2032
- Figure 8: Rest of the World Rapid App Development Industry Revenue (Million), by Country 2024 & 2032
- Figure 9: Rest of the World Rapid App Development Industry Revenue Share (%), by Country 2024 & 2032
- Figure 10: North America Rapid App Development Industry Revenue (Million), by Type 2024 & 2032
- Figure 11: North America Rapid App Development Industry Revenue Share (%), by Type 2024 & 2032
- Figure 12: North America Rapid App Development Industry Revenue (Million), by Deployment Mode 2024 & 2032
- Figure 13: North America Rapid App Development Industry Revenue Share (%), by Deployment Mode 2024 & 2032
- Figure 14: North America Rapid App Development Industry Revenue (Million), by Organization Size 2024 & 2032
- Figure 15: North America Rapid App Development Industry Revenue Share (%), by Organization Size 2024 & 2032
- Figure 16: North America Rapid App Development Industry Revenue (Million), by End-user Industry 2024 & 2032
- Figure 17: North America Rapid App Development Industry Revenue Share (%), by End-user Industry 2024 & 2032
- Figure 18: North America Rapid App Development Industry Revenue (Million), by Country 2024 & 2032
- Figure 19: North America Rapid App Development Industry Revenue Share (%), by Country 2024 & 2032
- Figure 20: Europe Rapid App Development Industry Revenue (Million), by Type 2024 & 2032
- Figure 21: Europe Rapid App Development Industry Revenue Share (%), by Type 2024 & 2032
- Figure 22: Europe Rapid App Development Industry Revenue (Million), by Deployment Mode 2024 & 2032
- Figure 23: Europe Rapid App Development Industry Revenue Share (%), by Deployment Mode 2024 & 2032
- Figure 24: Europe Rapid App Development Industry Revenue (Million), by Organization Size 2024 & 2032
- Figure 25: Europe Rapid App Development Industry Revenue Share (%), by Organization Size 2024 & 2032
- Figure 26: Europe Rapid App Development Industry Revenue (Million), by End-user Industry 2024 & 2032
- Figure 27: Europe Rapid App Development Industry Revenue Share (%), by End-user Industry 2024 & 2032
- Figure 28: Europe Rapid App Development Industry Revenue (Million), by Country 2024 & 2032
- Figure 29: Europe Rapid App Development Industry Revenue Share (%), by Country 2024 & 2032
- Figure 30: Asia Pacific Rapid App Development Industry Revenue (Million), by Type 2024 & 2032
- Figure 31: Asia Pacific Rapid App Development Industry Revenue Share (%), by Type 2024 & 2032
- Figure 32: Asia Pacific Rapid App Development Industry Revenue (Million), by Deployment Mode 2024 & 2032
- Figure 33: Asia Pacific Rapid App Development Industry Revenue Share (%), by Deployment Mode 2024 & 2032
- Figure 34: Asia Pacific Rapid App Development Industry Revenue (Million), by Organization Size 2024 & 2032
- Figure 35: Asia Pacific Rapid App Development Industry Revenue Share (%), by Organization Size 2024 & 2032
- Figure 36: Asia Pacific Rapid App Development Industry Revenue (Million), by End-user Industry 2024 & 2032
- Figure 37: Asia Pacific Rapid App Development Industry Revenue Share (%), by End-user Industry 2024 & 2032
- Figure 38: Asia Pacific Rapid App Development Industry Revenue (Million), by Country 2024 & 2032
- Figure 39: Asia Pacific Rapid App Development Industry Revenue Share (%), by Country 2024 & 2032
- Figure 40: Rest of the World Rapid App Development Industry Revenue (Million), by Type 2024 & 2032
- Figure 41: Rest of the World Rapid App Development Industry Revenue Share (%), by Type 2024 & 2032
- Figure 42: Rest of the World Rapid App Development Industry Revenue (Million), by Deployment Mode 2024 & 2032
- Figure 43: Rest of the World Rapid App Development Industry Revenue Share (%), by Deployment Mode 2024 & 2032
- Figure 44: Rest of the World Rapid App Development Industry Revenue (Million), by Organization Size 2024 & 2032
- Figure 45: Rest of the World Rapid App Development Industry Revenue Share (%), by Organization Size 2024 & 2032
- Figure 46: Rest of the World Rapid App Development Industry Revenue (Million), by End-user Industry 2024 & 2032
- Figure 47: Rest of the World Rapid App Development Industry Revenue Share (%), by End-user Industry 2024 & 2032
- Figure 48: Rest of the World Rapid App Development Industry Revenue (Million), by Country 2024 & 2032
- Figure 49: Rest of the World Rapid App Development Industry Revenue Share (%), by Country 2024 & 2032
List of Tables
- Table 1: Global Rapid App Development Industry Revenue Million Forecast, by Region 2019 & 2032
- Table 2: Global Rapid App Development Industry Revenue Million Forecast, by Type 2019 & 2032
- Table 3: Global Rapid App Development Industry Revenue Million Forecast, by Deployment Mode 2019 & 2032
- Table 4: Global Rapid App Development Industry Revenue Million Forecast, by Organization Size 2019 & 2032
- Table 5: Global Rapid App Development Industry Revenue Million Forecast, by End-user Industry 2019 & 2032
- Table 6: Global Rapid App Development Industry Revenue Million Forecast, by Region 2019 & 2032
- Table 7: Global Rapid App Development Industry Revenue Million Forecast, by Country 2019 & 2032
- Table 8: Rapid App Development Industry Revenue (Million) Forecast, by Application 2019 & 2032
- Table 9: Global Rapid App Development Industry Revenue Million Forecast, by Country 2019 & 2032
- Table 10: Rapid App Development Industry Revenue (Million) Forecast, by Application 2019 & 2032
- Table 11: Global Rapid App Development Industry Revenue Million Forecast, by Country 2019 & 2032
- Table 12: Rapid App Development Industry Revenue (Million) Forecast, by Application 2019 & 2032
- Table 13: Global Rapid App Development Industry Revenue Million Forecast, by Country 2019 & 2032
- Table 14: Rapid App Development Industry Revenue (Million) Forecast, by Application 2019 & 2032
- Table 15: Global Rapid App Development Industry Revenue Million Forecast, by Type 2019 & 2032
- Table 16: Global Rapid App Development Industry Revenue Million Forecast, by Deployment Mode 2019 & 2032
- Table 17: Global Rapid App Development Industry Revenue Million Forecast, by Organization Size 2019 & 2032
- Table 18: Global Rapid App Development Industry Revenue Million Forecast, by End-user Industry 2019 & 2032
- Table 19: Global Rapid App Development Industry Revenue Million Forecast, by Country 2019 & 2032
- Table 20: Global Rapid App Development Industry Revenue Million Forecast, by Type 2019 & 2032
- Table 21: Global Rapid App Development Industry Revenue Million Forecast, by Deployment Mode 2019 & 2032
- Table 22: Global Rapid App Development Industry Revenue Million Forecast, by Organization Size 2019 & 2032
- Table 23: Global Rapid App Development Industry Revenue Million Forecast, by End-user Industry 2019 & 2032
- Table 24: Global Rapid App Development Industry Revenue Million Forecast, by Country 2019 & 2032
- Table 25: Global Rapid App Development Industry Revenue Million Forecast, by Type 2019 & 2032
- Table 26: Global Rapid App Development Industry Revenue Million Forecast, by Deployment Mode 2019 & 2032
- Table 27: Global Rapid App Development Industry Revenue Million Forecast, by Organization Size 2019 & 2032
- Table 28: Global Rapid App Development Industry Revenue Million Forecast, by End-user Industry 2019 & 2032
- Table 29: Global Rapid App Development Industry Revenue Million Forecast, by Country 2019 & 2032
- Table 30: Global Rapid App Development Industry Revenue Million Forecast, by Type 2019 & 2032
- Table 31: Global Rapid App Development Industry Revenue Million Forecast, by Deployment Mode 2019 & 2032
- Table 32: Global Rapid App Development Industry Revenue Million Forecast, by Organization Size 2019 & 2032
- Table 33: Global Rapid App Development Industry Revenue Million Forecast, by End-user Industry 2019 & 2032
- Table 34: Global Rapid App Development Industry Revenue Million Forecast, by Country 2019 & 2032
Frequently Asked Questions
1. What is the projected Compound Annual Growth Rate (CAGR) of the Rapid App Development Industry?
The projected CAGR is approximately 42.80%.
2. Which companies are prominent players in the Rapid App Development Industry?
Key companies in the market include Appian Corporation, IBM Corporation, ServiceNow, Salesforce com Inc, OutSystems, Microsoft Corporation, Amazon Web Services Inc, Oracle Corporation, Zoho Corporation Private Limited, LANSA*List Not Exhaustive.
3. What are the main segments of the Rapid App Development Industry?
The market segments include Type, Deployment Mode, Organization Size, End-user Industry.
4. Can you provide details about the market size?
The market size is estimated to be USD XX Million as of 2022.
5. What are some drivers contributing to market growth?
Innovation in the Businesses and Integration of Advanced Technologies; Flexibility to Customize Solutions as per an Organizations Dynamic Requirements.
6. What are the notable trends driving market growth?
Small and Medium-sized Enterprises To Drive the Market Growth.
7. Are there any restraints impacting market growth?
Lack of Skilled Professionals.
8. Can you provide examples of recent developments in the market?
November 2021 - Hybrid IT systems integrator and managed services provider Datacentrix formed a partnership agreement with the OutSystems application development platform for Africa and the Middle East. The OutSystems modern application platform is specifically designed to accelerate the development and deployment of critical applications while also delivering flexibility and efficiency. This is expected to aid Datacentrix in assisting customers in their application modernization strategies with a cloud engagement strategy that aligns with Datacentrix's vision.
9. What pricing options are available for accessing the report?
Pricing options include single-user, multi-user, and enterprise licenses priced at USD 4750, USD 5250, and USD 8750 respectively.
10. Is the market size provided in terms of value or volume?
The market size is provided in terms of value, measured in Million.
11. Are there any specific market keywords associated with the report?
Yes, the market keyword associated with the report is "Rapid App Development Industry," which aids in identifying and referencing the specific market segment covered.
12. How do I determine which pricing option suits my needs best?
The pricing options vary based on user requirements and access needs. Individual users may opt for single-user licenses, while businesses requiring broader access may choose multi-user or enterprise licenses for cost-effective access to the report.
13. Are there any additional resources or data provided in the Rapid App Development Industry report?
While the report offers comprehensive insights, it's advisable to review the specific contents or supplementary materials provided to ascertain if additional resources or data are available.
14. How can I stay updated on further developments or reports in the Rapid App Development Industry?
To stay informed about further developments, trends, and reports in the Rapid App Development Industry, consider subscribing to industry newsletters, following relevant companies and organizations, or regularly checking reputable industry news sources and publications.
Methodology
Step 1 - Identification of Relevant Samples Size from Population Database


Step 2 - Approaches for Defining Global Market Size (Value, Volume* & Price*)

Note*: In applicable scenarios
Step 3 - Data Sources
Primary Research
- Web Analytics
- Survey Reports
- Research Institute
- Latest Research Reports
- Opinion Leaders
Secondary Research
- Annual Reports
- White Paper
- Latest Press Release
- Industry Association
- Paid Database
- Investor Presentations

Step 4 - Data Triangulation
Involves using different sources of information in order to increase the validity of a study
These sources are likely to be stakeholders in a program - participants, other researchers, program staff, other community members, and so on.
Then we put all data in single framework & apply various statistical tools to find out the dynamic on the market.
During the analysis stage, feedback from the stakeholder groups would be compared to determine areas of agreement as well as areas of divergence
