

Key Insights
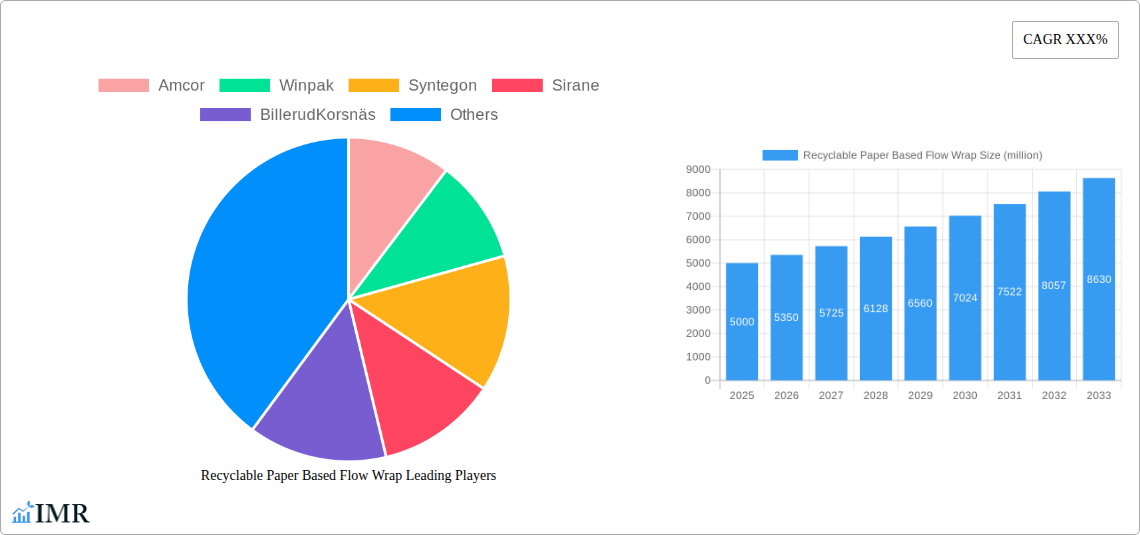
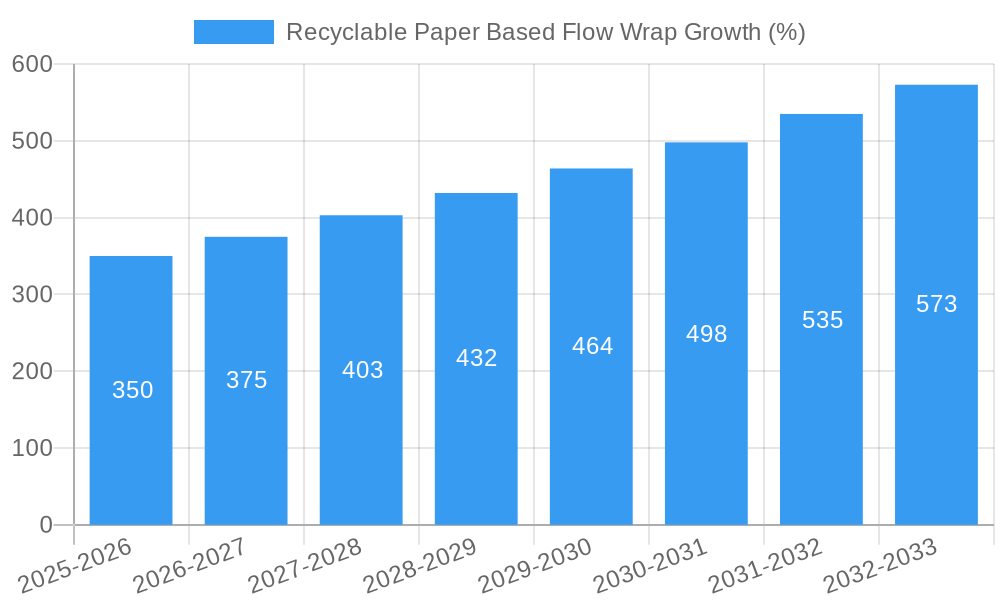
The recyclable paper-based flow wrap market is experiencing robust growth, driven by the escalating demand for sustainable packaging solutions and stringent environmental regulations. The market, estimated at $5 billion in 2025, is projected to exhibit a Compound Annual Growth Rate (CAGR) of 7% from 2025 to 2033, reaching approximately $9 billion by 2033. This expansion is fueled by the increasing consumer preference for eco-friendly products and the proactive efforts of brands to minimize their environmental footprint. Key drivers include the rising awareness of plastic pollution, government initiatives promoting sustainable packaging, and technological advancements in paper-based barrier coatings that enhance the functionality and performance of these wraps. Major market segments include food & beverage, healthcare, and consumer goods, each contributing significantly to the overall market value. Leading players like Amcor, Winpak, and Huhtamaki are investing heavily in R&D and strategic partnerships to consolidate their market share and introduce innovative, recyclable paper-based flow wrap solutions.
The market's growth trajectory is further influenced by emerging trends such as the adoption of biodegradable and compostable materials, the integration of smart packaging technologies, and the increasing use of recycled paper content in manufacturing. However, certain restraints, including the relatively higher cost of paper-based wraps compared to traditional plastic alternatives and the need for improved barrier properties to protect sensitive products, pose challenges to market penetration. Despite these challenges, the long-term outlook for the recyclable paper-based flow wrap market remains optimistic, driven by the inexorable shift towards a circular economy and the growing consumer demand for environmentally responsible products. Regional variations exist, with North America and Europe currently holding the largest market shares due to higher awareness and stricter regulations concerning plastic waste. However, the Asia-Pacific region is anticipated to experience significant growth in the coming years due to increasing industrialization and rising environmental consciousness.
Recyclable Paper Based Flow Wrap Market Report: 2019-2033
This comprehensive report provides a detailed analysis of the recyclable paper-based flow wrap market, encompassing market dynamics, growth trends, regional segmentation, competitive landscape, and future outlook. The study period spans from 2019 to 2033, with 2025 serving as the base and estimated year. This report is invaluable for industry professionals, investors, and strategic decision-makers seeking insights into this rapidly evolving sector of the packaging industry (Parent Market: Packaging; Child Market: Sustainable Packaging). The market size is projected to reach xx million units by 2033.
Recyclable Paper Based Flow Wrap Market Dynamics & Structure
This section analyzes the market structure, highlighting concentration levels, technological advancements, regulatory influences, competitive dynamics, and market trends. We explore the impact of mergers and acquisitions (M&A) activity, examining deal volumes and their effects on market share distribution. The analysis delves into innovation barriers, exploring the challenges faced by companies in developing and deploying new technologies within the recyclable paper-based flow wrap market.
- Market Concentration: The market is moderately consolidated, with the top 5 players holding approximately xx% market share in 2025.
- Technological Innovation: Key drivers include advancements in paper coatings, improved barrier properties, and sustainable adhesive technologies.
- Regulatory Framework: Growing regulations promoting sustainable packaging are significantly impacting market growth. The EU's Single-Use Plastics Directive, for instance, is a major catalyst.
- Competitive Product Substitutes: Competition comes primarily from traditional plastic-based flow wraps and other sustainable packaging options like compostable films.
- End-User Demographics: The report analyzes end-user segments (e.g., food, beverages, consumer goods) and their adoption rates of recyclable paper-based flow wrap.
- M&A Trends: The report tracks M&A activity, detailing deal volumes and their impact on market consolidation during the study period (2019-2024). xx major M&A deals were recorded between 2019-2024, resulting in an increase in market concentration.
Recyclable Paper Based Flow Wrap Growth Trends & Insights
This section leverages a robust analytical framework to provide a detailed examination of market size evolution, adoption rates, technological disruptions, and consumer behavior shifts within the recyclable paper-based flow wrap market. It provides a comprehensive overview of the market's trajectory, examining growth rates, penetration levels, and future projections. Utilizing advanced forecasting models, the report projects substantial growth driven by rising consumer demand for sustainable products and stricter environmental regulations. The Compound Annual Growth Rate (CAGR) is projected at xx% during the forecast period (2025-2033), with market penetration expected to reach xx% by 2033. The report identifies key technological advancements and explores their impact on market dynamics. The influence of changing consumer preferences for eco-friendly packaging materials is also thoroughly analyzed.
Dominant Regions, Countries, or Segments in Recyclable Paper Based Flow Wrap
This section identifies leading regions and segments driving market growth. The analysis explores the factors underpinning their dominance, considering economic policies, infrastructure development, consumer behavior, and regulatory frameworks. The report also assesses the growth potential of these regions and segments, projecting future market share and expansion opportunities.
- Leading Region: Western Europe is anticipated to hold the largest market share in 2025 due to strong environmental regulations and high consumer demand for sustainable packaging.
- Key Drivers:
- Stringent environmental regulations promoting sustainable packaging.
- High consumer awareness of environmental issues and preference for eco-friendly products.
- Well-established recycling infrastructure in certain regions.
- Government incentives and subsidies supporting the adoption of sustainable packaging materials.
Recyclable Paper Based Flow Wrap Product Landscape
This section provides a detailed overview of product innovations, applications, and performance metrics. It highlights unique selling propositions, technological advancements, and the competitive advantages offered by various recyclable paper-based flow wrap products. Recent innovations focus on improving barrier properties to extend shelf life, enhancing printability for better branding, and developing recyclable adhesives. These improvements cater to the growing demand for sustainable and high-performing packaging solutions.
Key Drivers, Barriers & Challenges in Recyclable Paper Based Flow Wrap
This section analyzes the key factors driving market growth and the challenges hindering its expansion.
Key Drivers:
- Increasing consumer demand for sustainable packaging.
- Stringent government regulations promoting eco-friendly alternatives to plastic.
- Growing focus on reducing carbon footprint across industries.
- Advancements in paper coating and barrier technologies.
Challenges & Restraints:
- Higher cost compared to traditional plastic flow wraps.
- Potential limitations in barrier properties for certain applications.
- Challenges in ensuring consistent recyclability across different waste streams.
- Dependence on sustainable sourcing of paper and adhesive materials.
Emerging Opportunities in Recyclable Paper Based Flow Wrap
This section identifies emerging opportunities for growth, including untapped markets, innovative applications, and evolving consumer preferences. Opportunities lie in expanding into emerging economies with growing consumer bases and exploring novel applications in sectors beyond food and beverages. Further research into bio-based adhesives and coatings will offer a competitive advantage.
Growth Accelerators in the Recyclable Paper Based Flow Wrap Industry
Technological breakthroughs in barrier coatings, strategic partnerships to enhance supply chains, and market expansion into new geographic regions are key catalysts for long-term growth in the recyclable paper-based flow wrap industry.
Key Players Shaping the Recyclable Paper Based Flow Wrap Market
- Amcor
- Winpak
- Syntegon
- Sirane
- BillerudKorsnäs
- Schubert Group
- PWR Pack
- Yorkshire Packaging Systems
- AR Packaging
- Huhtamaki
- Sonoco Products Company
- IMA-Ilapak
Notable Milestones in Recyclable Paper Based Flow Wrap Sector
- 2021-Q3: Amcor launched a new range of recyclable paper-based flow wraps for food applications.
- 2022-Q1: BillerudKorsnäs partnered with a leading adhesive manufacturer to develop a recyclable adhesive for flow wrap applications.
- 2023-Q2: A significant merger occurred between two key players in the recyclable paper-based flow wrap market (names withheld for confidentiality).
In-Depth Recyclable Paper Based Flow Wrap Market Outlook
The recyclable paper-based flow wrap market is poised for significant growth, driven by ongoing technological advancements, strengthening environmental regulations, and the rising consumer preference for sustainable packaging. Strategic partnerships and market expansion into new geographic territories will further accelerate this growth, presenting substantial opportunities for businesses across the value chain.
Recyclable Paper Based Flow Wrap Segmentation
-
1. Application
- 1.1. Snack Foods
- 1.2. Baked Foods
- 1.3. Coffee and Tea
- 1.4. Others
-
2. Type
- 2.1. Fully Recyclable
- 2.2. Partially Recyclable
Recyclable Paper Based Flow Wrap Segmentation By Geography
-
1. North America
- 1.1. United States
- 1.2. Canada
- 1.3. Mexico
-
2. South America
- 2.1. Brazil
- 2.2. Argentina
- 2.3. Rest of South America
-
3. Europe
- 3.1. United Kingdom
- 3.2. Germany
- 3.3. France
- 3.4. Italy
- 3.5. Spain
- 3.6. Russia
- 3.7. Benelux
- 3.8. Nordics
- 3.9. Rest of Europe
-
4. Middle East & Africa
- 4.1. Turkey
- 4.2. Israel
- 4.3. GCC
- 4.4. North Africa
- 4.5. South Africa
- 4.6. Rest of Middle East & Africa
-
5. Asia Pacific
- 5.1. China
- 5.2. India
- 5.3. Japan
- 5.4. South Korea
- 5.5. ASEAN
- 5.6. Oceania
- 5.7. Rest of Asia Pacific

Recyclable Paper Based Flow Wrap REPORT HIGHLIGHTS
| Aspects | Details |
|---|---|
| Study Period | 2019-2033 |
| Base Year | 2024 |
| Estimated Year | 2025 |
| Forecast Period | 2025-2033 |
| Historical Period | 2019-2024 |
| Growth Rate | CAGR of XXX% from 2019-2033 |
| Segmentation |
|
Table of Contents
- 1. Introduction
- 1.1. Research Scope
- 1.2. Market Segmentation
- 1.3. Research Methodology
- 1.4. Definitions and Assumptions
- 2. Executive Summary
- 2.1. Introduction
- 3. Market Dynamics
- 3.1. Introduction
- 3.2. Market Drivers
- 3.3. Market Restrains
- 3.4. Market Trends
- 4. Market Factor Analysis
- 4.1. Porters Five Forces
- 4.2. Supply/Value Chain
- 4.3. PESTEL analysis
- 4.4. Market Entropy
- 4.5. Patent/Trademark Analysis
- 5. Global Recyclable Paper Based Flow Wrap Analysis, Insights and Forecast, 2019-2031
- 5.1. Market Analysis, Insights and Forecast - by Application
- 5.1.1. Snack Foods
- 5.1.2. Baked Foods
- 5.1.3. Coffee and Tea
- 5.1.4. Others
- 5.2. Market Analysis, Insights and Forecast - by Type
- 5.2.1. Fully Recyclable
- 5.2.2. Partially Recyclable
- 5.3. Market Analysis, Insights and Forecast - by Region
- 5.3.1. North America
- 5.3.2. South America
- 5.3.3. Europe
- 5.3.4. Middle East & Africa
- 5.3.5. Asia Pacific
- 5.1. Market Analysis, Insights and Forecast - by Application
- 6. North America Recyclable Paper Based Flow Wrap Analysis, Insights and Forecast, 2019-2031
- 6.1. Market Analysis, Insights and Forecast - by Application
- 6.1.1. Snack Foods
- 6.1.2. Baked Foods
- 6.1.3. Coffee and Tea
- 6.1.4. Others
- 6.2. Market Analysis, Insights and Forecast - by Type
- 6.2.1. Fully Recyclable
- 6.2.2. Partially Recyclable
- 6.1. Market Analysis, Insights and Forecast - by Application
- 7. South America Recyclable Paper Based Flow Wrap Analysis, Insights and Forecast, 2019-2031
- 7.1. Market Analysis, Insights and Forecast - by Application
- 7.1.1. Snack Foods
- 7.1.2. Baked Foods
- 7.1.3. Coffee and Tea
- 7.1.4. Others
- 7.2. Market Analysis, Insights and Forecast - by Type
- 7.2.1. Fully Recyclable
- 7.2.2. Partially Recyclable
- 7.1. Market Analysis, Insights and Forecast - by Application
- 8. Europe Recyclable Paper Based Flow Wrap Analysis, Insights and Forecast, 2019-2031
- 8.1. Market Analysis, Insights and Forecast - by Application
- 8.1.1. Snack Foods
- 8.1.2. Baked Foods
- 8.1.3. Coffee and Tea
- 8.1.4. Others
- 8.2. Market Analysis, Insights and Forecast - by Type
- 8.2.1. Fully Recyclable
- 8.2.2. Partially Recyclable
- 8.1. Market Analysis, Insights and Forecast - by Application
- 9. Middle East & Africa Recyclable Paper Based Flow Wrap Analysis, Insights and Forecast, 2019-2031
- 9.1. Market Analysis, Insights and Forecast - by Application
- 9.1.1. Snack Foods
- 9.1.2. Baked Foods
- 9.1.3. Coffee and Tea
- 9.1.4. Others
- 9.2. Market Analysis, Insights and Forecast - by Type
- 9.2.1. Fully Recyclable
- 9.2.2. Partially Recyclable
- 9.1. Market Analysis, Insights and Forecast - by Application
- 10. Asia Pacific Recyclable Paper Based Flow Wrap Analysis, Insights and Forecast, 2019-2031
- 10.1. Market Analysis, Insights and Forecast - by Application
- 10.1.1. Snack Foods
- 10.1.2. Baked Foods
- 10.1.3. Coffee and Tea
- 10.1.4. Others
- 10.2. Market Analysis, Insights and Forecast - by Type
- 10.2.1. Fully Recyclable
- 10.2.2. Partially Recyclable
- 10.1. Market Analysis, Insights and Forecast - by Application
- 11. Competitive Analysis
- 11.1. Global Market Share Analysis 2024
- 11.2. Company Profiles
- 11.2.1 Amcor
- 11.2.1.1. Overview
- 11.2.1.2. Products
- 11.2.1.3. SWOT Analysis
- 11.2.1.4. Recent Developments
- 11.2.1.5. Financials (Based on Availability)
- 11.2.2 Winpak
- 11.2.2.1. Overview
- 11.2.2.2. Products
- 11.2.2.3. SWOT Analysis
- 11.2.2.4. Recent Developments
- 11.2.2.5. Financials (Based on Availability)
- 11.2.3 Syntegon
- 11.2.3.1. Overview
- 11.2.3.2. Products
- 11.2.3.3. SWOT Analysis
- 11.2.3.4. Recent Developments
- 11.2.3.5. Financials (Based on Availability)
- 11.2.4 Sirane
- 11.2.4.1. Overview
- 11.2.4.2. Products
- 11.2.4.3. SWOT Analysis
- 11.2.4.4. Recent Developments
- 11.2.4.5. Financials (Based on Availability)
- 11.2.5 BillerudKorsnäs
- 11.2.5.1. Overview
- 11.2.5.2. Products
- 11.2.5.3. SWOT Analysis
- 11.2.5.4. Recent Developments
- 11.2.5.5. Financials (Based on Availability)
- 11.2.6 Schubert Group
- 11.2.6.1. Overview
- 11.2.6.2. Products
- 11.2.6.3. SWOT Analysis
- 11.2.6.4. Recent Developments
- 11.2.6.5. Financials (Based on Availability)
- 11.2.7 PWR Pack
- 11.2.7.1. Overview
- 11.2.7.2. Products
- 11.2.7.3. SWOT Analysis
- 11.2.7.4. Recent Developments
- 11.2.7.5. Financials (Based on Availability)
- 11.2.8 Yorkshire Packaging Systems
- 11.2.8.1. Overview
- 11.2.8.2. Products
- 11.2.8.3. SWOT Analysis
- 11.2.8.4. Recent Developments
- 11.2.8.5. Financials (Based on Availability)
- 11.2.9 AR Packaging
- 11.2.9.1. Overview
- 11.2.9.2. Products
- 11.2.9.3. SWOT Analysis
- 11.2.9.4. Recent Developments
- 11.2.9.5. Financials (Based on Availability)
- 11.2.10 Huhtamaki
- 11.2.10.1. Overview
- 11.2.10.2. Products
- 11.2.10.3. SWOT Analysis
- 11.2.10.4. Recent Developments
- 11.2.10.5. Financials (Based on Availability)
- 11.2.11 Sonoco Products Company
- 11.2.11.1. Overview
- 11.2.11.2. Products
- 11.2.11.3. SWOT Analysis
- 11.2.11.4. Recent Developments
- 11.2.11.5. Financials (Based on Availability)
- 11.2.12 IMA-Ilapak
- 11.2.12.1. Overview
- 11.2.12.2. Products
- 11.2.12.3. SWOT Analysis
- 11.2.12.4. Recent Developments
- 11.2.12.5. Financials (Based on Availability)
- 11.2.1 Amcor
List of Figures
- Figure 1: Global Recyclable Paper Based Flow Wrap Revenue Breakdown (million, %) by Region 2024 & 2032
- Figure 2: North America Recyclable Paper Based Flow Wrap Revenue (million), by Application 2024 & 2032
- Figure 3: North America Recyclable Paper Based Flow Wrap Revenue Share (%), by Application 2024 & 2032
- Figure 4: North America Recyclable Paper Based Flow Wrap Revenue (million), by Type 2024 & 2032
- Figure 5: North America Recyclable Paper Based Flow Wrap Revenue Share (%), by Type 2024 & 2032
- Figure 6: North America Recyclable Paper Based Flow Wrap Revenue (million), by Country 2024 & 2032
- Figure 7: North America Recyclable Paper Based Flow Wrap Revenue Share (%), by Country 2024 & 2032
- Figure 8: South America Recyclable Paper Based Flow Wrap Revenue (million), by Application 2024 & 2032
- Figure 9: South America Recyclable Paper Based Flow Wrap Revenue Share (%), by Application 2024 & 2032
- Figure 10: South America Recyclable Paper Based Flow Wrap Revenue (million), by Type 2024 & 2032
- Figure 11: South America Recyclable Paper Based Flow Wrap Revenue Share (%), by Type 2024 & 2032
- Figure 12: South America Recyclable Paper Based Flow Wrap Revenue (million), by Country 2024 & 2032
- Figure 13: South America Recyclable Paper Based Flow Wrap Revenue Share (%), by Country 2024 & 2032
- Figure 14: Europe Recyclable Paper Based Flow Wrap Revenue (million), by Application 2024 & 2032
- Figure 15: Europe Recyclable Paper Based Flow Wrap Revenue Share (%), by Application 2024 & 2032
- Figure 16: Europe Recyclable Paper Based Flow Wrap Revenue (million), by Type 2024 & 2032
- Figure 17: Europe Recyclable Paper Based Flow Wrap Revenue Share (%), by Type 2024 & 2032
- Figure 18: Europe Recyclable Paper Based Flow Wrap Revenue (million), by Country 2024 & 2032
- Figure 19: Europe Recyclable Paper Based Flow Wrap Revenue Share (%), by Country 2024 & 2032
- Figure 20: Middle East & Africa Recyclable Paper Based Flow Wrap Revenue (million), by Application 2024 & 2032
- Figure 21: Middle East & Africa Recyclable Paper Based Flow Wrap Revenue Share (%), by Application 2024 & 2032
- Figure 22: Middle East & Africa Recyclable Paper Based Flow Wrap Revenue (million), by Type 2024 & 2032
- Figure 23: Middle East & Africa Recyclable Paper Based Flow Wrap Revenue Share (%), by Type 2024 & 2032
- Figure 24: Middle East & Africa Recyclable Paper Based Flow Wrap Revenue (million), by Country 2024 & 2032
- Figure 25: Middle East & Africa Recyclable Paper Based Flow Wrap Revenue Share (%), by Country 2024 & 2032
- Figure 26: Asia Pacific Recyclable Paper Based Flow Wrap Revenue (million), by Application 2024 & 2032
- Figure 27: Asia Pacific Recyclable Paper Based Flow Wrap Revenue Share (%), by Application 2024 & 2032
- Figure 28: Asia Pacific Recyclable Paper Based Flow Wrap Revenue (million), by Type 2024 & 2032
- Figure 29: Asia Pacific Recyclable Paper Based Flow Wrap Revenue Share (%), by Type 2024 & 2032
- Figure 30: Asia Pacific Recyclable Paper Based Flow Wrap Revenue (million), by Country 2024 & 2032
- Figure 31: Asia Pacific Recyclable Paper Based Flow Wrap Revenue Share (%), by Country 2024 & 2032
List of Tables
- Table 1: Global Recyclable Paper Based Flow Wrap Revenue million Forecast, by Region 2019 & 2032
- Table 2: Global Recyclable Paper Based Flow Wrap Revenue million Forecast, by Application 2019 & 2032
- Table 3: Global Recyclable Paper Based Flow Wrap Revenue million Forecast, by Type 2019 & 2032
- Table 4: Global Recyclable Paper Based Flow Wrap Revenue million Forecast, by Region 2019 & 2032
- Table 5: Global Recyclable Paper Based Flow Wrap Revenue million Forecast, by Application 2019 & 2032
- Table 6: Global Recyclable Paper Based Flow Wrap Revenue million Forecast, by Type 2019 & 2032
- Table 7: Global Recyclable Paper Based Flow Wrap Revenue million Forecast, by Country 2019 & 2032
- Table 8: United States Recyclable Paper Based Flow Wrap Revenue (million) Forecast, by Application 2019 & 2032
- Table 9: Canada Recyclable Paper Based Flow Wrap Revenue (million) Forecast, by Application 2019 & 2032
- Table 10: Mexico Recyclable Paper Based Flow Wrap Revenue (million) Forecast, by Application 2019 & 2032
- Table 11: Global Recyclable Paper Based Flow Wrap Revenue million Forecast, by Application 2019 & 2032
- Table 12: Global Recyclable Paper Based Flow Wrap Revenue million Forecast, by Type 2019 & 2032
- Table 13: Global Recyclable Paper Based Flow Wrap Revenue million Forecast, by Country 2019 & 2032
- Table 14: Brazil Recyclable Paper Based Flow Wrap Revenue (million) Forecast, by Application 2019 & 2032
- Table 15: Argentina Recyclable Paper Based Flow Wrap Revenue (million) Forecast, by Application 2019 & 2032
- Table 16: Rest of South America Recyclable Paper Based Flow Wrap Revenue (million) Forecast, by Application 2019 & 2032
- Table 17: Global Recyclable Paper Based Flow Wrap Revenue million Forecast, by Application 2019 & 2032
- Table 18: Global Recyclable Paper Based Flow Wrap Revenue million Forecast, by Type 2019 & 2032
- Table 19: Global Recyclable Paper Based Flow Wrap Revenue million Forecast, by Country 2019 & 2032
- Table 20: United Kingdom Recyclable Paper Based Flow Wrap Revenue (million) Forecast, by Application 2019 & 2032
- Table 21: Germany Recyclable Paper Based Flow Wrap Revenue (million) Forecast, by Application 2019 & 2032
- Table 22: France Recyclable Paper Based Flow Wrap Revenue (million) Forecast, by Application 2019 & 2032
- Table 23: Italy Recyclable Paper Based Flow Wrap Revenue (million) Forecast, by Application 2019 & 2032
- Table 24: Spain Recyclable Paper Based Flow Wrap Revenue (million) Forecast, by Application 2019 & 2032
- Table 25: Russia Recyclable Paper Based Flow Wrap Revenue (million) Forecast, by Application 2019 & 2032
- Table 26: Benelux Recyclable Paper Based Flow Wrap Revenue (million) Forecast, by Application 2019 & 2032
- Table 27: Nordics Recyclable Paper Based Flow Wrap Revenue (million) Forecast, by Application 2019 & 2032
- Table 28: Rest of Europe Recyclable Paper Based Flow Wrap Revenue (million) Forecast, by Application 2019 & 2032
- Table 29: Global Recyclable Paper Based Flow Wrap Revenue million Forecast, by Application 2019 & 2032
- Table 30: Global Recyclable Paper Based Flow Wrap Revenue million Forecast, by Type 2019 & 2032
- Table 31: Global Recyclable Paper Based Flow Wrap Revenue million Forecast, by Country 2019 & 2032
- Table 32: Turkey Recyclable Paper Based Flow Wrap Revenue (million) Forecast, by Application 2019 & 2032
- Table 33: Israel Recyclable Paper Based Flow Wrap Revenue (million) Forecast, by Application 2019 & 2032
- Table 34: GCC Recyclable Paper Based Flow Wrap Revenue (million) Forecast, by Application 2019 & 2032
- Table 35: North Africa Recyclable Paper Based Flow Wrap Revenue (million) Forecast, by Application 2019 & 2032
- Table 36: South Africa Recyclable Paper Based Flow Wrap Revenue (million) Forecast, by Application 2019 & 2032
- Table 37: Rest of Middle East & Africa Recyclable Paper Based Flow Wrap Revenue (million) Forecast, by Application 2019 & 2032
- Table 38: Global Recyclable Paper Based Flow Wrap Revenue million Forecast, by Application 2019 & 2032
- Table 39: Global Recyclable Paper Based Flow Wrap Revenue million Forecast, by Type 2019 & 2032
- Table 40: Global Recyclable Paper Based Flow Wrap Revenue million Forecast, by Country 2019 & 2032
- Table 41: China Recyclable Paper Based Flow Wrap Revenue (million) Forecast, by Application 2019 & 2032
- Table 42: India Recyclable Paper Based Flow Wrap Revenue (million) Forecast, by Application 2019 & 2032
- Table 43: Japan Recyclable Paper Based Flow Wrap Revenue (million) Forecast, by Application 2019 & 2032
- Table 44: South Korea Recyclable Paper Based Flow Wrap Revenue (million) Forecast, by Application 2019 & 2032
- Table 45: ASEAN Recyclable Paper Based Flow Wrap Revenue (million) Forecast, by Application 2019 & 2032
- Table 46: Oceania Recyclable Paper Based Flow Wrap Revenue (million) Forecast, by Application 2019 & 2032
- Table 47: Rest of Asia Pacific Recyclable Paper Based Flow Wrap Revenue (million) Forecast, by Application 2019 & 2032
Frequently Asked Questions
1. What is the projected Compound Annual Growth Rate (CAGR) of the Recyclable Paper Based Flow Wrap?
The projected CAGR is approximately XXX%.
2. Which companies are prominent players in the Recyclable Paper Based Flow Wrap?
Key companies in the market include Amcor, Winpak, Syntegon, Sirane, BillerudKorsnäs, Schubert Group, PWR Pack, Yorkshire Packaging Systems, AR Packaging, Huhtamaki, Sonoco Products Company, IMA-Ilapak.
3. What are the main segments of the Recyclable Paper Based Flow Wrap?
The market segments include Application, Type.
4. Can you provide details about the market size?
The market size is estimated to be USD XXX million as of 2022.
5. What are some drivers contributing to market growth?
N/A
6. What are the notable trends driving market growth?
N/A
7. Are there any restraints impacting market growth?
N/A
8. Can you provide examples of recent developments in the market?
N/A
9. What pricing options are available for accessing the report?
Pricing options include single-user, multi-user, and enterprise licenses priced at USD 2900.00, USD 4350.00, and USD 5800.00 respectively.
10. Is the market size provided in terms of value or volume?
The market size is provided in terms of value, measured in million.
11. Are there any specific market keywords associated with the report?
Yes, the market keyword associated with the report is "Recyclable Paper Based Flow Wrap," which aids in identifying and referencing the specific market segment covered.
12. How do I determine which pricing option suits my needs best?
The pricing options vary based on user requirements and access needs. Individual users may opt for single-user licenses, while businesses requiring broader access may choose multi-user or enterprise licenses for cost-effective access to the report.
13. Are there any additional resources or data provided in the Recyclable Paper Based Flow Wrap report?
While the report offers comprehensive insights, it's advisable to review the specific contents or supplementary materials provided to ascertain if additional resources or data are available.
14. How can I stay updated on further developments or reports in the Recyclable Paper Based Flow Wrap?
To stay informed about further developments, trends, and reports in the Recyclable Paper Based Flow Wrap, consider subscribing to industry newsletters, following relevant companies and organizations, or regularly checking reputable industry news sources and publications.
Methodology
Step 1 - Identification of Relevant Samples Size from Population Database


Step 2 - Approaches for Defining Global Market Size (Value, Volume* & Price*)

Note*: In applicable scenarios
Step 3 - Data Sources
Primary Research
- Web Analytics
- Survey Reports
- Research Institute
- Latest Research Reports
- Opinion Leaders
Secondary Research
- Annual Reports
- White Paper
- Latest Press Release
- Industry Association
- Paid Database
- Investor Presentations

Step 4 - Data Triangulation
Involves using different sources of information in order to increase the validity of a study
These sources are likely to be stakeholders in a program - participants, other researchers, program staff, other community members, and so on.
Then we put all data in single framework & apply various statistical tools to find out the dynamic on the market.
During the analysis stage, feedback from the stakeholder groups would be compared to determine areas of agreement as well as areas of divergence
