

Key Insights
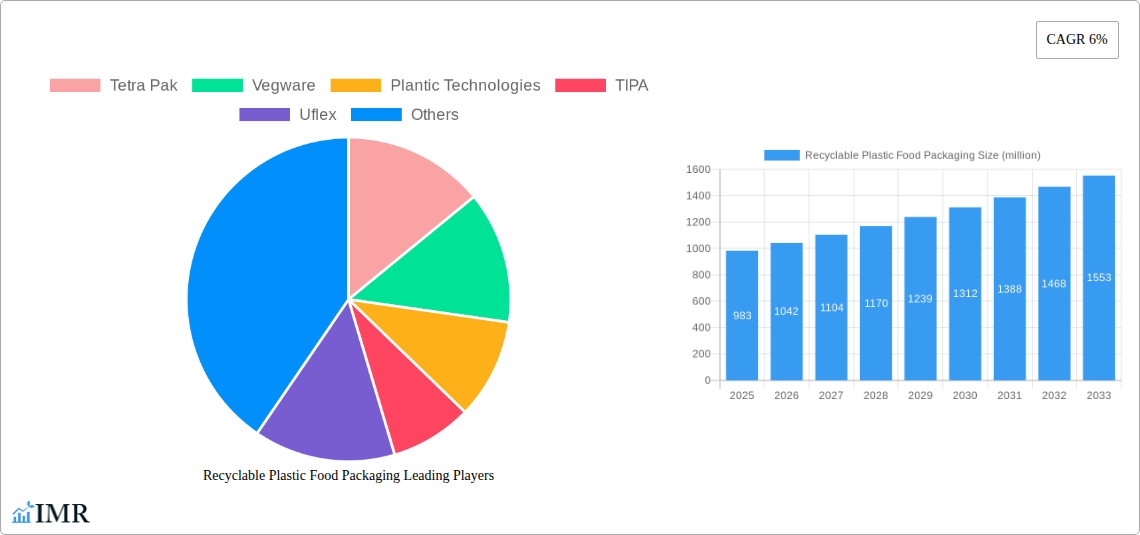
The global recyclable plastic food packaging market, valued at $983 million in 2025, is projected to experience robust growth, driven by escalating consumer demand for sustainable and eco-friendly packaging solutions. A Compound Annual Growth Rate (CAGR) of 6% from 2025 to 2033 indicates a significant market expansion, reaching an estimated value exceeding $1.5 billion by 2033. This growth is fueled by several key factors. Firstly, stringent government regulations and increasing environmental concerns are pushing manufacturers to adopt more sustainable packaging materials. Secondly, the rising popularity of ready-to-eat meals and online food delivery services is increasing demand for convenient and safe packaging that also meets sustainability requirements. Thirdly, technological advancements in recyclable plastic materials, such as biodegradable polymers and improved recycling processes, are making recyclable options more economically viable and technically feasible. Major players like Tetra Pak, Amcor, and Huhtamaki Group are leading the innovation in this space, developing advanced recyclable packaging formats and investing heavily in research and development.
However, the market also faces challenges. The high initial cost of recyclable plastic materials compared to conventional plastics remains a barrier for some manufacturers. Furthermore, the lack of standardized recycling infrastructure globally and the inconsistent consumer participation in recycling programs can hinder the widespread adoption of recyclable packaging. Nevertheless, the long-term outlook for the recyclable plastic food packaging market remains positive, driven by continued innovation, increasing consumer awareness, and supportive government policies aimed at reducing plastic waste and promoting circular economy principles. The market segmentation (while not explicitly provided) will likely include various types of recyclable plastics (PET, HDPE, etc.), packaging formats (bottles, trays, films), and food applications (dairy, produce, meat). The regional distribution will likely see strong growth in North America and Europe initially, followed by expansion in Asia-Pacific and other emerging markets.
Recyclable Plastic Food Packaging Market Report: 2019-2033
This comprehensive report provides an in-depth analysis of the recyclable plastic food packaging market, encompassing market dynamics, growth trends, regional analysis, competitive landscape, and future outlook. The study period covers 2019-2033, with a base year of 2025 and a forecast period of 2025-2033. The report is essential for industry professionals, investors, and stakeholders seeking a clear understanding of this rapidly evolving market. Parent market (flexible packaging) and child markets (food packaging, consumer goods packaging) are deeply considered throughout the analysis. The total market value in 2025 is estimated at xx million units.
Recyclable Plastic Food Packaging Market Dynamics & Structure
This section analyzes the market structure, examining concentration levels, technological innovation drivers, regulatory frameworks, and competitive dynamics. We delve into the impact of substitute products, end-user demographics, and mergers & acquisitions (M&A) activities.
- Market Concentration: The market exhibits a moderately concentrated structure with a few major players holding significant market share. In 2025, the top 5 players held an estimated xx% of the market share.
- Technological Innovation: Advancements in barrier technologies, material science, and recycling processes are key drivers. xx million units of new product innovations were launched between 2019-2024.
- Regulatory Landscape: Government regulations promoting sustainability and reducing plastic waste are significantly impacting market growth. xx countries implemented stricter regulations during the historical period.
- Competitive Substitutes: Biodegradable and compostable packaging materials pose a competitive threat, but recyclable plastic solutions maintain a significant advantage due to cost-effectiveness and recycling infrastructure. xx million units of substitute products were introduced in 2024.
- End-User Demographics: Growing consumer awareness of environmental issues and demand for sustainable packaging solutions are driving market growth, particularly among younger demographics.
- M&A Activity: The period 2019-2024 witnessed xx M&A deals, mainly focused on consolidating market share and expanding product portfolios. These deals totaled an estimated value of xx million units.
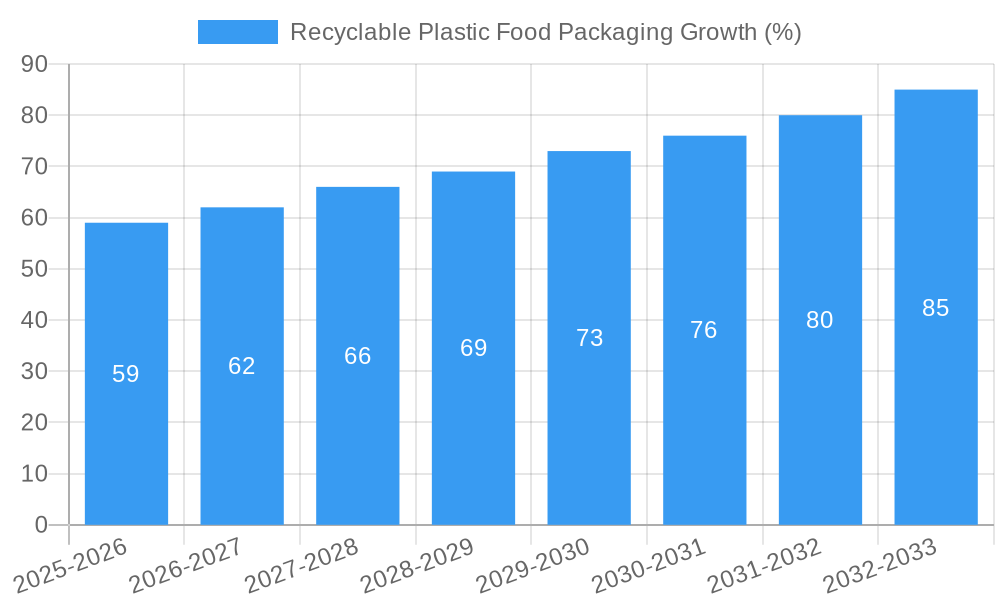
Recyclable Plastic Food Packaging Growth Trends & Insights
This section offers a detailed analysis of market size evolution, adoption rates, technological disruptions, and evolving consumer preferences. The analysis leverages proprietary data and market research to provide in-depth insights into market growth trajectories.
The recyclable plastic food packaging market witnessed robust growth during the historical period (2019-2024), expanding at a CAGR of xx%. This growth is projected to continue during the forecast period (2025-2033), reaching an estimated market size of xx million units by 2033, with a projected CAGR of xx%. Key factors driving this growth include increasing consumer preference for sustainable packaging, stringent government regulations on plastic waste, and technological advancements in recyclable plastic materials. Market penetration increased from xx% in 2019 to xx% in 2024, reflecting the growing adoption of these solutions. Technological disruptions, such as the development of advanced recycling technologies and innovative material formulations, are further fueling market growth.
Dominant Regions, Countries, or Segments in Recyclable Plastic Food Packaging
This section identifies leading regions, countries, and segments driving market growth, highlighting key factors influencing their dominance.
- North America: North America holds a significant market share, driven by strong consumer demand for sustainable packaging and stringent environmental regulations. The region’s established recycling infrastructure and advanced technological capabilities also contribute to its dominance. In 2025, North America held xx% market share.
- Europe: Europe follows closely behind North America, with its robust environmental policies and significant investments in sustainable packaging technologies. Government incentives and consumer awareness are major contributors to its growth. In 2025, Europe held xx% market share.
- Asia-Pacific: The Asia-Pacific region is experiencing rapid growth, propelled by rising disposable incomes, increasing urbanization, and a growing middle class. However, inconsistent recycling infrastructure presents a challenge. In 2025, Asia-Pacific held xx% market share.
Recyclable Plastic Food Packaging Product Landscape
The recyclable plastic food packaging market encompasses a diverse range of products, including bottles, containers, films, and pouches, each with varying material compositions and functionalities. Recent innovations include the development of lightweight, high-barrier materials that enhance shelf life while reducing environmental impact. These innovations leverage advanced polymer blends, optimized film structures, and improved recycling capabilities, leading to cost savings and reduced waste.
Key Drivers, Barriers & Challenges in Recyclable Plastic Food Packaging
Key Drivers:
- Growing consumer demand for eco-friendly packaging.
- Stringent government regulations to reduce plastic waste.
- Technological advancements in recycling and material science.
Challenges & Restraints:
- High initial investment costs for recyclable plastic packaging solutions.
- Inconsistent recycling infrastructure across different regions.
- Competition from biodegradable and compostable alternatives. These alternatives present a challenge to recyclable plastics due to their potential for complete decomposition and reduction in environmental impact.
Emerging Opportunities in Recyclable Plastic Food Packaging
- Expanding into untapped markets in developing economies.
- Development of innovative applications for recyclable plastic packaging in emerging sectors like e-commerce and food delivery.
- Growing demand for customized and personalized packaging solutions.
Growth Accelerators in the Recyclable Plastic Food Packaging Industry
Technological breakthroughs in material science and recycling technologies are poised to significantly accelerate market growth in the coming years. Strategic partnerships between packaging manufacturers, recyclers, and brand owners are essential to developing a closed-loop recycling system. Expanding into new applications and markets and creating greater consumer awareness of environmentally responsible packaging will also drive long-term growth.
Key Players Shaping the Recyclable Plastic Food Packaging Market
- Tetra Pak
- Vegware
- Plantic Technologies
- TIPA
- Uflex
- DuPont
- Innovia Films
- Huhtamaki Group
- Amcor
- Mondi Group
- Be Green Packaging
- Biopak
- Biomass Packaging
- Eco-Products
Notable Milestones in Recyclable Plastic Food Packaging Sector
- 2020: Introduction of new high-barrier recyclable PET film by Amcor.
- 2021: DuPont launches a new bio-based polymer for recyclable plastic food packaging.
- 2022: Tetra Pak partners with recycling company to improve collection infrastructure.
- 2023: Several major brands commit to using 100% recyclable packaging by 2025.
In-Depth Recyclable Plastic Food Packaging Market Outlook
The recyclable plastic food packaging market is poised for continued strong growth, driven by increasing consumer demand for sustainable solutions, stringent environmental regulations, and technological advancements. Strategic investments in advanced recycling technologies and collaborations across the value chain will play a crucial role in realizing the full market potential. The development of more durable and versatile recyclable materials, along with the expansion of convenient recycling programs, will significantly enhance market growth in the years to come.
Recyclable Plastic Food Packaging Segmentation
-
1. Application
- 1.1. Flexible Packaging
- 1.2. Stand-up Pouches
- 1.3. Trays
- 1.4. Containers
- 1.5. Bottles
- 1.6. Other
-
2. Types
- 2.1. PP
- 2.2. PE
- 2.3. PET
- 2.4. Other
Recyclable Plastic Food Packaging Segmentation By Geography
-
1. North America
- 1.1. United States
- 1.2. Canada
- 1.3. Mexico
-
2. South America
- 2.1. Brazil
- 2.2. Argentina
- 2.3. Rest of South America
-
3. Europe
- 3.1. United Kingdom
- 3.2. Germany
- 3.3. France
- 3.4. Italy
- 3.5. Spain
- 3.6. Russia
- 3.7. Benelux
- 3.8. Nordics
- 3.9. Rest of Europe
-
4. Middle East & Africa
- 4.1. Turkey
- 4.2. Israel
- 4.3. GCC
- 4.4. North Africa
- 4.5. South Africa
- 4.6. Rest of Middle East & Africa
-
5. Asia Pacific
- 5.1. China
- 5.2. India
- 5.3. Japan
- 5.4. South Korea
- 5.5. ASEAN
- 5.6. Oceania
- 5.7. Rest of Asia Pacific

Recyclable Plastic Food Packaging REPORT HIGHLIGHTS
| Aspects | Details |
|---|---|
| Study Period | 2019-2033 |
| Base Year | 2024 |
| Estimated Year | 2025 |
| Forecast Period | 2025-2033 |
| Historical Period | 2019-2024 |
| Growth Rate | CAGR of 6% from 2019-2033 |
| Segmentation |
|
Table of Contents
- 1. Introduction
- 1.1. Research Scope
- 1.2. Market Segmentation
- 1.3. Research Methodology
- 1.4. Definitions and Assumptions
- 2. Executive Summary
- 2.1. Introduction
- 3. Market Dynamics
- 3.1. Introduction
- 3.2. Market Drivers
- 3.3. Market Restrains
- 3.4. Market Trends
- 4. Market Factor Analysis
- 4.1. Porters Five Forces
- 4.2. Supply/Value Chain
- 4.3. PESTEL analysis
- 4.4. Market Entropy
- 4.5. Patent/Trademark Analysis
- 5. Global Recyclable Plastic Food Packaging Analysis, Insights and Forecast, 2019-2031
- 5.1. Market Analysis, Insights and Forecast - by Application
- 5.1.1. Flexible Packaging
- 5.1.2. Stand-up Pouches
- 5.1.3. Trays
- 5.1.4. Containers
- 5.1.5. Bottles
- 5.1.6. Other
- 5.2. Market Analysis, Insights and Forecast - by Types
- 5.2.1. PP
- 5.2.2. PE
- 5.2.3. PET
- 5.2.4. Other
- 5.3. Market Analysis, Insights and Forecast - by Region
- 5.3.1. North America
- 5.3.2. South America
- 5.3.3. Europe
- 5.3.4. Middle East & Africa
- 5.3.5. Asia Pacific
- 5.1. Market Analysis, Insights and Forecast - by Application
- 6. North America Recyclable Plastic Food Packaging Analysis, Insights and Forecast, 2019-2031
- 6.1. Market Analysis, Insights and Forecast - by Application
- 6.1.1. Flexible Packaging
- 6.1.2. Stand-up Pouches
- 6.1.3. Trays
- 6.1.4. Containers
- 6.1.5. Bottles
- 6.1.6. Other
- 6.2. Market Analysis, Insights and Forecast - by Types
- 6.2.1. PP
- 6.2.2. PE
- 6.2.3. PET
- 6.2.4. Other
- 6.1. Market Analysis, Insights and Forecast - by Application
- 7. South America Recyclable Plastic Food Packaging Analysis, Insights and Forecast, 2019-2031
- 7.1. Market Analysis, Insights and Forecast - by Application
- 7.1.1. Flexible Packaging
- 7.1.2. Stand-up Pouches
- 7.1.3. Trays
- 7.1.4. Containers
- 7.1.5. Bottles
- 7.1.6. Other
- 7.2. Market Analysis, Insights and Forecast - by Types
- 7.2.1. PP
- 7.2.2. PE
- 7.2.3. PET
- 7.2.4. Other
- 7.1. Market Analysis, Insights and Forecast - by Application
- 8. Europe Recyclable Plastic Food Packaging Analysis, Insights and Forecast, 2019-2031
- 8.1. Market Analysis, Insights and Forecast - by Application
- 8.1.1. Flexible Packaging
- 8.1.2. Stand-up Pouches
- 8.1.3. Trays
- 8.1.4. Containers
- 8.1.5. Bottles
- 8.1.6. Other
- 8.2. Market Analysis, Insights and Forecast - by Types
- 8.2.1. PP
- 8.2.2. PE
- 8.2.3. PET
- 8.2.4. Other
- 8.1. Market Analysis, Insights and Forecast - by Application
- 9. Middle East & Africa Recyclable Plastic Food Packaging Analysis, Insights and Forecast, 2019-2031
- 9.1. Market Analysis, Insights and Forecast - by Application
- 9.1.1. Flexible Packaging
- 9.1.2. Stand-up Pouches
- 9.1.3. Trays
- 9.1.4. Containers
- 9.1.5. Bottles
- 9.1.6. Other
- 9.2. Market Analysis, Insights and Forecast - by Types
- 9.2.1. PP
- 9.2.2. PE
- 9.2.3. PET
- 9.2.4. Other
- 9.1. Market Analysis, Insights and Forecast - by Application
- 10. Asia Pacific Recyclable Plastic Food Packaging Analysis, Insights and Forecast, 2019-2031
- 10.1. Market Analysis, Insights and Forecast - by Application
- 10.1.1. Flexible Packaging
- 10.1.2. Stand-up Pouches
- 10.1.3. Trays
- 10.1.4. Containers
- 10.1.5. Bottles
- 10.1.6. Other
- 10.2. Market Analysis, Insights and Forecast - by Types
- 10.2.1. PP
- 10.2.2. PE
- 10.2.3. PET
- 10.2.4. Other
- 10.1. Market Analysis, Insights and Forecast - by Application
- 11. Competitive Analysis
- 11.1. Global Market Share Analysis 2024
- 11.2. Company Profiles
- 11.2.1 Tetra Pak
- 11.2.1.1. Overview
- 11.2.1.2. Products
- 11.2.1.3. SWOT Analysis
- 11.2.1.4. Recent Developments
- 11.2.1.5. Financials (Based on Availability)
- 11.2.2 Vegware
- 11.2.2.1. Overview
- 11.2.2.2. Products
- 11.2.2.3. SWOT Analysis
- 11.2.2.4. Recent Developments
- 11.2.2.5. Financials (Based on Availability)
- 11.2.3 Plantic Technologies
- 11.2.3.1. Overview
- 11.2.3.2. Products
- 11.2.3.3. SWOT Analysis
- 11.2.3.4. Recent Developments
- 11.2.3.5. Financials (Based on Availability)
- 11.2.4 TIPA
- 11.2.4.1. Overview
- 11.2.4.2. Products
- 11.2.4.3. SWOT Analysis
- 11.2.4.4. Recent Developments
- 11.2.4.5. Financials (Based on Availability)
- 11.2.5 Uflex
- 11.2.5.1. Overview
- 11.2.5.2. Products
- 11.2.5.3. SWOT Analysis
- 11.2.5.4. Recent Developments
- 11.2.5.5. Financials (Based on Availability)
- 11.2.6 DuPont
- 11.2.6.1. Overview
- 11.2.6.2. Products
- 11.2.6.3. SWOT Analysis
- 11.2.6.4. Recent Developments
- 11.2.6.5. Financials (Based on Availability)
- 11.2.7 Innovia Films
- 11.2.7.1. Overview
- 11.2.7.2. Products
- 11.2.7.3. SWOT Analysis
- 11.2.7.4. Recent Developments
- 11.2.7.5. Financials (Based on Availability)
- 11.2.8 Huhtamaki Group
- 11.2.8.1. Overview
- 11.2.8.2. Products
- 11.2.8.3. SWOT Analysis
- 11.2.8.4. Recent Developments
- 11.2.8.5. Financials (Based on Availability)
- 11.2.9 Amcor
- 11.2.9.1. Overview
- 11.2.9.2. Products
- 11.2.9.3. SWOT Analysis
- 11.2.9.4. Recent Developments
- 11.2.9.5. Financials (Based on Availability)
- 11.2.10 Mondi Group
- 11.2.10.1. Overview
- 11.2.10.2. Products
- 11.2.10.3. SWOT Analysis
- 11.2.10.4. Recent Developments
- 11.2.10.5. Financials (Based on Availability)
- 11.2.11 Be Green Packaging
- 11.2.11.1. Overview
- 11.2.11.2. Products
- 11.2.11.3. SWOT Analysis
- 11.2.11.4. Recent Developments
- 11.2.11.5. Financials (Based on Availability)
- 11.2.12 Biopak
- 11.2.12.1. Overview
- 11.2.12.2. Products
- 11.2.12.3. SWOT Analysis
- 11.2.12.4. Recent Developments
- 11.2.12.5. Financials (Based on Availability)
- 11.2.13 Biomass Packaging
- 11.2.13.1. Overview
- 11.2.13.2. Products
- 11.2.13.3. SWOT Analysis
- 11.2.13.4. Recent Developments
- 11.2.13.5. Financials (Based on Availability)
- 11.2.14 Eco-Products
- 11.2.14.1. Overview
- 11.2.14.2. Products
- 11.2.14.3. SWOT Analysis
- 11.2.14.4. Recent Developments
- 11.2.14.5. Financials (Based on Availability)
- 11.2.1 Tetra Pak
List of Figures
- Figure 1: Global Recyclable Plastic Food Packaging Revenue Breakdown (million, %) by Region 2024 & 2032
- Figure 2: Global Recyclable Plastic Food Packaging Volume Breakdown (K, %) by Region 2024 & 2032
- Figure 3: North America Recyclable Plastic Food Packaging Revenue (million), by Application 2024 & 2032
- Figure 4: North America Recyclable Plastic Food Packaging Volume (K), by Application 2024 & 2032
- Figure 5: North America Recyclable Plastic Food Packaging Revenue Share (%), by Application 2024 & 2032
- Figure 6: North America Recyclable Plastic Food Packaging Volume Share (%), by Application 2024 & 2032
- Figure 7: North America Recyclable Plastic Food Packaging Revenue (million), by Types 2024 & 2032
- Figure 8: North America Recyclable Plastic Food Packaging Volume (K), by Types 2024 & 2032
- Figure 9: North America Recyclable Plastic Food Packaging Revenue Share (%), by Types 2024 & 2032
- Figure 10: North America Recyclable Plastic Food Packaging Volume Share (%), by Types 2024 & 2032
- Figure 11: North America Recyclable Plastic Food Packaging Revenue (million), by Country 2024 & 2032
- Figure 12: North America Recyclable Plastic Food Packaging Volume (K), by Country 2024 & 2032
- Figure 13: North America Recyclable Plastic Food Packaging Revenue Share (%), by Country 2024 & 2032
- Figure 14: North America Recyclable Plastic Food Packaging Volume Share (%), by Country 2024 & 2032
- Figure 15: South America Recyclable Plastic Food Packaging Revenue (million), by Application 2024 & 2032
- Figure 16: South America Recyclable Plastic Food Packaging Volume (K), by Application 2024 & 2032
- Figure 17: South America Recyclable Plastic Food Packaging Revenue Share (%), by Application 2024 & 2032
- Figure 18: South America Recyclable Plastic Food Packaging Volume Share (%), by Application 2024 & 2032
- Figure 19: South America Recyclable Plastic Food Packaging Revenue (million), by Types 2024 & 2032
- Figure 20: South America Recyclable Plastic Food Packaging Volume (K), by Types 2024 & 2032
- Figure 21: South America Recyclable Plastic Food Packaging Revenue Share (%), by Types 2024 & 2032
- Figure 22: South America Recyclable Plastic Food Packaging Volume Share (%), by Types 2024 & 2032
- Figure 23: South America Recyclable Plastic Food Packaging Revenue (million), by Country 2024 & 2032
- Figure 24: South America Recyclable Plastic Food Packaging Volume (K), by Country 2024 & 2032
- Figure 25: South America Recyclable Plastic Food Packaging Revenue Share (%), by Country 2024 & 2032
- Figure 26: South America Recyclable Plastic Food Packaging Volume Share (%), by Country 2024 & 2032
- Figure 27: Europe Recyclable Plastic Food Packaging Revenue (million), by Application 2024 & 2032
- Figure 28: Europe Recyclable Plastic Food Packaging Volume (K), by Application 2024 & 2032
- Figure 29: Europe Recyclable Plastic Food Packaging Revenue Share (%), by Application 2024 & 2032
- Figure 30: Europe Recyclable Plastic Food Packaging Volume Share (%), by Application 2024 & 2032
- Figure 31: Europe Recyclable Plastic Food Packaging Revenue (million), by Types 2024 & 2032
- Figure 32: Europe Recyclable Plastic Food Packaging Volume (K), by Types 2024 & 2032
- Figure 33: Europe Recyclable Plastic Food Packaging Revenue Share (%), by Types 2024 & 2032
- Figure 34: Europe Recyclable Plastic Food Packaging Volume Share (%), by Types 2024 & 2032
- Figure 35: Europe Recyclable Plastic Food Packaging Revenue (million), by Country 2024 & 2032
- Figure 36: Europe Recyclable Plastic Food Packaging Volume (K), by Country 2024 & 2032
- Figure 37: Europe Recyclable Plastic Food Packaging Revenue Share (%), by Country 2024 & 2032
- Figure 38: Europe Recyclable Plastic Food Packaging Volume Share (%), by Country 2024 & 2032
- Figure 39: Middle East & Africa Recyclable Plastic Food Packaging Revenue (million), by Application 2024 & 2032
- Figure 40: Middle East & Africa Recyclable Plastic Food Packaging Volume (K), by Application 2024 & 2032
- Figure 41: Middle East & Africa Recyclable Plastic Food Packaging Revenue Share (%), by Application 2024 & 2032
- Figure 42: Middle East & Africa Recyclable Plastic Food Packaging Volume Share (%), by Application 2024 & 2032
- Figure 43: Middle East & Africa Recyclable Plastic Food Packaging Revenue (million), by Types 2024 & 2032
- Figure 44: Middle East & Africa Recyclable Plastic Food Packaging Volume (K), by Types 2024 & 2032
- Figure 45: Middle East & Africa Recyclable Plastic Food Packaging Revenue Share (%), by Types 2024 & 2032
- Figure 46: Middle East & Africa Recyclable Plastic Food Packaging Volume Share (%), by Types 2024 & 2032
- Figure 47: Middle East & Africa Recyclable Plastic Food Packaging Revenue (million), by Country 2024 & 2032
- Figure 48: Middle East & Africa Recyclable Plastic Food Packaging Volume (K), by Country 2024 & 2032
- Figure 49: Middle East & Africa Recyclable Plastic Food Packaging Revenue Share (%), by Country 2024 & 2032
- Figure 50: Middle East & Africa Recyclable Plastic Food Packaging Volume Share (%), by Country 2024 & 2032
- Figure 51: Asia Pacific Recyclable Plastic Food Packaging Revenue (million), by Application 2024 & 2032
- Figure 52: Asia Pacific Recyclable Plastic Food Packaging Volume (K), by Application 2024 & 2032
- Figure 53: Asia Pacific Recyclable Plastic Food Packaging Revenue Share (%), by Application 2024 & 2032
- Figure 54: Asia Pacific Recyclable Plastic Food Packaging Volume Share (%), by Application 2024 & 2032
- Figure 55: Asia Pacific Recyclable Plastic Food Packaging Revenue (million), by Types 2024 & 2032
- Figure 56: Asia Pacific Recyclable Plastic Food Packaging Volume (K), by Types 2024 & 2032
- Figure 57: Asia Pacific Recyclable Plastic Food Packaging Revenue Share (%), by Types 2024 & 2032
- Figure 58: Asia Pacific Recyclable Plastic Food Packaging Volume Share (%), by Types 2024 & 2032
- Figure 59: Asia Pacific Recyclable Plastic Food Packaging Revenue (million), by Country 2024 & 2032
- Figure 60: Asia Pacific Recyclable Plastic Food Packaging Volume (K), by Country 2024 & 2032
- Figure 61: Asia Pacific Recyclable Plastic Food Packaging Revenue Share (%), by Country 2024 & 2032
- Figure 62: Asia Pacific Recyclable Plastic Food Packaging Volume Share (%), by Country 2024 & 2032
List of Tables
- Table 1: Global Recyclable Plastic Food Packaging Revenue million Forecast, by Region 2019 & 2032
- Table 2: Global Recyclable Plastic Food Packaging Volume K Forecast, by Region 2019 & 2032
- Table 3: Global Recyclable Plastic Food Packaging Revenue million Forecast, by Application 2019 & 2032
- Table 4: Global Recyclable Plastic Food Packaging Volume K Forecast, by Application 2019 & 2032
- Table 5: Global Recyclable Plastic Food Packaging Revenue million Forecast, by Types 2019 & 2032
- Table 6: Global Recyclable Plastic Food Packaging Volume K Forecast, by Types 2019 & 2032
- Table 7: Global Recyclable Plastic Food Packaging Revenue million Forecast, by Region 2019 & 2032
- Table 8: Global Recyclable Plastic Food Packaging Volume K Forecast, by Region 2019 & 2032
- Table 9: Global Recyclable Plastic Food Packaging Revenue million Forecast, by Application 2019 & 2032
- Table 10: Global Recyclable Plastic Food Packaging Volume K Forecast, by Application 2019 & 2032
- Table 11: Global Recyclable Plastic Food Packaging Revenue million Forecast, by Types 2019 & 2032
- Table 12: Global Recyclable Plastic Food Packaging Volume K Forecast, by Types 2019 & 2032
- Table 13: Global Recyclable Plastic Food Packaging Revenue million Forecast, by Country 2019 & 2032
- Table 14: Global Recyclable Plastic Food Packaging Volume K Forecast, by Country 2019 & 2032
- Table 15: United States Recyclable Plastic Food Packaging Revenue (million) Forecast, by Application 2019 & 2032
- Table 16: United States Recyclable Plastic Food Packaging Volume (K) Forecast, by Application 2019 & 2032
- Table 17: Canada Recyclable Plastic Food Packaging Revenue (million) Forecast, by Application 2019 & 2032
- Table 18: Canada Recyclable Plastic Food Packaging Volume (K) Forecast, by Application 2019 & 2032
- Table 19: Mexico Recyclable Plastic Food Packaging Revenue (million) Forecast, by Application 2019 & 2032
- Table 20: Mexico Recyclable Plastic Food Packaging Volume (K) Forecast, by Application 2019 & 2032
- Table 21: Global Recyclable Plastic Food Packaging Revenue million Forecast, by Application 2019 & 2032
- Table 22: Global Recyclable Plastic Food Packaging Volume K Forecast, by Application 2019 & 2032
- Table 23: Global Recyclable Plastic Food Packaging Revenue million Forecast, by Types 2019 & 2032
- Table 24: Global Recyclable Plastic Food Packaging Volume K Forecast, by Types 2019 & 2032
- Table 25: Global Recyclable Plastic Food Packaging Revenue million Forecast, by Country 2019 & 2032
- Table 26: Global Recyclable Plastic Food Packaging Volume K Forecast, by Country 2019 & 2032
- Table 27: Brazil Recyclable Plastic Food Packaging Revenue (million) Forecast, by Application 2019 & 2032
- Table 28: Brazil Recyclable Plastic Food Packaging Volume (K) Forecast, by Application 2019 & 2032
- Table 29: Argentina Recyclable Plastic Food Packaging Revenue (million) Forecast, by Application 2019 & 2032
- Table 30: Argentina Recyclable Plastic Food Packaging Volume (K) Forecast, by Application 2019 & 2032
- Table 31: Rest of South America Recyclable Plastic Food Packaging Revenue (million) Forecast, by Application 2019 & 2032
- Table 32: Rest of South America Recyclable Plastic Food Packaging Volume (K) Forecast, by Application 2019 & 2032
- Table 33: Global Recyclable Plastic Food Packaging Revenue million Forecast, by Application 2019 & 2032
- Table 34: Global Recyclable Plastic Food Packaging Volume K Forecast, by Application 2019 & 2032
- Table 35: Global Recyclable Plastic Food Packaging Revenue million Forecast, by Types 2019 & 2032
- Table 36: Global Recyclable Plastic Food Packaging Volume K Forecast, by Types 2019 & 2032
- Table 37: Global Recyclable Plastic Food Packaging Revenue million Forecast, by Country 2019 & 2032
- Table 38: Global Recyclable Plastic Food Packaging Volume K Forecast, by Country 2019 & 2032
- Table 39: United Kingdom Recyclable Plastic Food Packaging Revenue (million) Forecast, by Application 2019 & 2032
- Table 40: United Kingdom Recyclable Plastic Food Packaging Volume (K) Forecast, by Application 2019 & 2032
- Table 41: Germany Recyclable Plastic Food Packaging Revenue (million) Forecast, by Application 2019 & 2032
- Table 42: Germany Recyclable Plastic Food Packaging Volume (K) Forecast, by Application 2019 & 2032
- Table 43: France Recyclable Plastic Food Packaging Revenue (million) Forecast, by Application 2019 & 2032
- Table 44: France Recyclable Plastic Food Packaging Volume (K) Forecast, by Application 2019 & 2032
- Table 45: Italy Recyclable Plastic Food Packaging Revenue (million) Forecast, by Application 2019 & 2032
- Table 46: Italy Recyclable Plastic Food Packaging Volume (K) Forecast, by Application 2019 & 2032
- Table 47: Spain Recyclable Plastic Food Packaging Revenue (million) Forecast, by Application 2019 & 2032
- Table 48: Spain Recyclable Plastic Food Packaging Volume (K) Forecast, by Application 2019 & 2032
- Table 49: Russia Recyclable Plastic Food Packaging Revenue (million) Forecast, by Application 2019 & 2032
- Table 50: Russia Recyclable Plastic Food Packaging Volume (K) Forecast, by Application 2019 & 2032
- Table 51: Benelux Recyclable Plastic Food Packaging Revenue (million) Forecast, by Application 2019 & 2032
- Table 52: Benelux Recyclable Plastic Food Packaging Volume (K) Forecast, by Application 2019 & 2032
- Table 53: Nordics Recyclable Plastic Food Packaging Revenue (million) Forecast, by Application 2019 & 2032
- Table 54: Nordics Recyclable Plastic Food Packaging Volume (K) Forecast, by Application 2019 & 2032
- Table 55: Rest of Europe Recyclable Plastic Food Packaging Revenue (million) Forecast, by Application 2019 & 2032
- Table 56: Rest of Europe Recyclable Plastic Food Packaging Volume (K) Forecast, by Application 2019 & 2032
- Table 57: Global Recyclable Plastic Food Packaging Revenue million Forecast, by Application 2019 & 2032
- Table 58: Global Recyclable Plastic Food Packaging Volume K Forecast, by Application 2019 & 2032
- Table 59: Global Recyclable Plastic Food Packaging Revenue million Forecast, by Types 2019 & 2032
- Table 60: Global Recyclable Plastic Food Packaging Volume K Forecast, by Types 2019 & 2032
- Table 61: Global Recyclable Plastic Food Packaging Revenue million Forecast, by Country 2019 & 2032
- Table 62: Global Recyclable Plastic Food Packaging Volume K Forecast, by Country 2019 & 2032
- Table 63: Turkey Recyclable Plastic Food Packaging Revenue (million) Forecast, by Application 2019 & 2032
- Table 64: Turkey Recyclable Plastic Food Packaging Volume (K) Forecast, by Application 2019 & 2032
- Table 65: Israel Recyclable Plastic Food Packaging Revenue (million) Forecast, by Application 2019 & 2032
- Table 66: Israel Recyclable Plastic Food Packaging Volume (K) Forecast, by Application 2019 & 2032
- Table 67: GCC Recyclable Plastic Food Packaging Revenue (million) Forecast, by Application 2019 & 2032
- Table 68: GCC Recyclable Plastic Food Packaging Volume (K) Forecast, by Application 2019 & 2032
- Table 69: North Africa Recyclable Plastic Food Packaging Revenue (million) Forecast, by Application 2019 & 2032
- Table 70: North Africa Recyclable Plastic Food Packaging Volume (K) Forecast, by Application 2019 & 2032
- Table 71: South Africa Recyclable Plastic Food Packaging Revenue (million) Forecast, by Application 2019 & 2032
- Table 72: South Africa Recyclable Plastic Food Packaging Volume (K) Forecast, by Application 2019 & 2032
- Table 73: Rest of Middle East & Africa Recyclable Plastic Food Packaging Revenue (million) Forecast, by Application 2019 & 2032
- Table 74: Rest of Middle East & Africa Recyclable Plastic Food Packaging Volume (K) Forecast, by Application 2019 & 2032
- Table 75: Global Recyclable Plastic Food Packaging Revenue million Forecast, by Application 2019 & 2032
- Table 76: Global Recyclable Plastic Food Packaging Volume K Forecast, by Application 2019 & 2032
- Table 77: Global Recyclable Plastic Food Packaging Revenue million Forecast, by Types 2019 & 2032
- Table 78: Global Recyclable Plastic Food Packaging Volume K Forecast, by Types 2019 & 2032
- Table 79: Global Recyclable Plastic Food Packaging Revenue million Forecast, by Country 2019 & 2032
- Table 80: Global Recyclable Plastic Food Packaging Volume K Forecast, by Country 2019 & 2032
- Table 81: China Recyclable Plastic Food Packaging Revenue (million) Forecast, by Application 2019 & 2032
- Table 82: China Recyclable Plastic Food Packaging Volume (K) Forecast, by Application 2019 & 2032
- Table 83: India Recyclable Plastic Food Packaging Revenue (million) Forecast, by Application 2019 & 2032
- Table 84: India Recyclable Plastic Food Packaging Volume (K) Forecast, by Application 2019 & 2032
- Table 85: Japan Recyclable Plastic Food Packaging Revenue (million) Forecast, by Application 2019 & 2032
- Table 86: Japan Recyclable Plastic Food Packaging Volume (K) Forecast, by Application 2019 & 2032
- Table 87: South Korea Recyclable Plastic Food Packaging Revenue (million) Forecast, by Application 2019 & 2032
- Table 88: South Korea Recyclable Plastic Food Packaging Volume (K) Forecast, by Application 2019 & 2032
- Table 89: ASEAN Recyclable Plastic Food Packaging Revenue (million) Forecast, by Application 2019 & 2032
- Table 90: ASEAN Recyclable Plastic Food Packaging Volume (K) Forecast, by Application 2019 & 2032
- Table 91: Oceania Recyclable Plastic Food Packaging Revenue (million) Forecast, by Application 2019 & 2032
- Table 92: Oceania Recyclable Plastic Food Packaging Volume (K) Forecast, by Application 2019 & 2032
- Table 93: Rest of Asia Pacific Recyclable Plastic Food Packaging Revenue (million) Forecast, by Application 2019 & 2032
- Table 94: Rest of Asia Pacific Recyclable Plastic Food Packaging Volume (K) Forecast, by Application 2019 & 2032
Frequently Asked Questions
1. What is the projected Compound Annual Growth Rate (CAGR) of the Recyclable Plastic Food Packaging?
The projected CAGR is approximately 6%.
2. Which companies are prominent players in the Recyclable Plastic Food Packaging?
Key companies in the market include Tetra Pak, Vegware, Plantic Technologies, TIPA, Uflex, DuPont, Innovia Films, Huhtamaki Group, Amcor, Mondi Group, Be Green Packaging, Biopak, Biomass Packaging, Eco-Products.
3. What are the main segments of the Recyclable Plastic Food Packaging?
The market segments include Application, Types.
4. Can you provide details about the market size?
The market size is estimated to be USD 983 million as of 2022.
5. What are some drivers contributing to market growth?
N/A
6. What are the notable trends driving market growth?
N/A
7. Are there any restraints impacting market growth?
N/A
8. Can you provide examples of recent developments in the market?
N/A
9. What pricing options are available for accessing the report?
Pricing options include single-user, multi-user, and enterprise licenses priced at USD 4350.00, USD 6525.00, and USD 8700.00 respectively.
10. Is the market size provided in terms of value or volume?
The market size is provided in terms of value, measured in million and volume, measured in K.
11. Are there any specific market keywords associated with the report?
Yes, the market keyword associated with the report is "Recyclable Plastic Food Packaging," which aids in identifying and referencing the specific market segment covered.
12. How do I determine which pricing option suits my needs best?
The pricing options vary based on user requirements and access needs. Individual users may opt for single-user licenses, while businesses requiring broader access may choose multi-user or enterprise licenses for cost-effective access to the report.
13. Are there any additional resources or data provided in the Recyclable Plastic Food Packaging report?
While the report offers comprehensive insights, it's advisable to review the specific contents or supplementary materials provided to ascertain if additional resources or data are available.
14. How can I stay updated on further developments or reports in the Recyclable Plastic Food Packaging?
To stay informed about further developments, trends, and reports in the Recyclable Plastic Food Packaging, consider subscribing to industry newsletters, following relevant companies and organizations, or regularly checking reputable industry news sources and publications.
Methodology
Step 1 - Identification of Relevant Samples Size from Population Database


Step 2 - Approaches for Defining Global Market Size (Value, Volume* & Price*)

Note*: In applicable scenarios
Step 3 - Data Sources
Primary Research
- Web Analytics
- Survey Reports
- Research Institute
- Latest Research Reports
- Opinion Leaders
Secondary Research
- Annual Reports
- White Paper
- Latest Press Release
- Industry Association
- Paid Database
- Investor Presentations

Step 4 - Data Triangulation
Involves using different sources of information in order to increase the validity of a study
These sources are likely to be stakeholders in a program - participants, other researchers, program staff, other community members, and so on.
Then we put all data in single framework & apply various statistical tools to find out the dynamic on the market.
During the analysis stage, feedback from the stakeholder groups would be compared to determine areas of agreement as well as areas of divergence
