

Key Insights
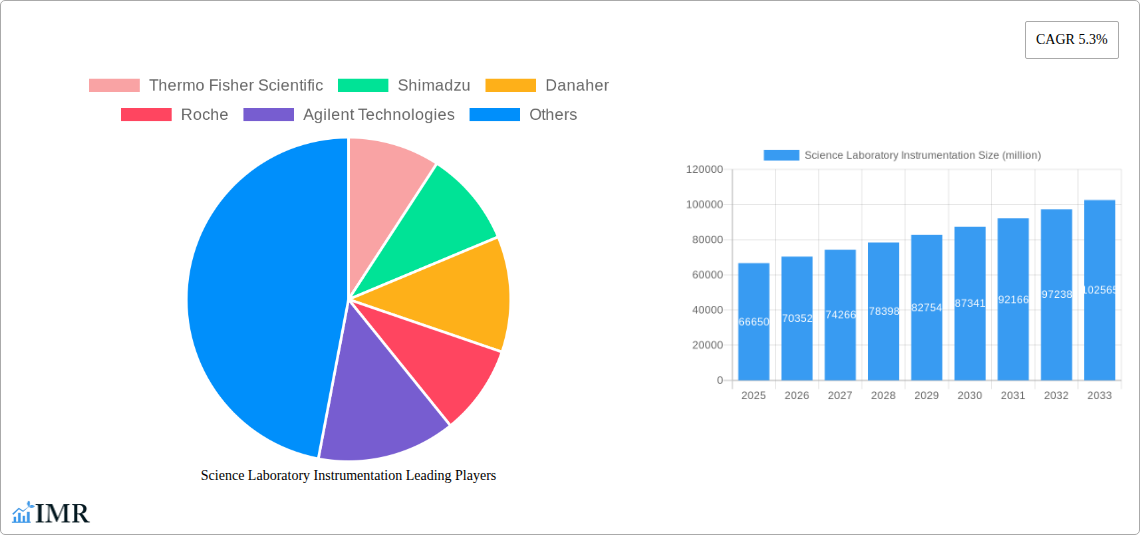
The global science laboratory instrumentation market, valued at $66,650 million in 2025, is projected to experience robust growth, driven by several key factors. The increasing prevalence of chronic diseases necessitates advanced diagnostic tools and research, fueling demand for sophisticated laboratory equipment. Furthermore, the burgeoning biotechnology and pharmaceutical industries, coupled with rising investments in R&D across various sectors, significantly contribute to market expansion. Technological advancements, such as miniaturization, automation, and improved analytical capabilities, are enhancing the efficiency and precision of laboratory instruments, further stimulating growth. Government initiatives promoting scientific research and infrastructure development in developing economies also play a crucial role. Competitive landscape analysis reveals the presence of established players like Thermo Fisher Scientific, Danaher, and Agilent Technologies, alongside emerging companies introducing innovative solutions. These companies are focusing on strategic partnerships, mergers and acquisitions, and product innovations to maintain their market share and expand their global reach. The market's growth, however, could face some headwinds due to factors such as high initial investment costs associated with advanced instrumentation and the stringent regulatory environment governing the manufacturing and usage of laboratory equipment.
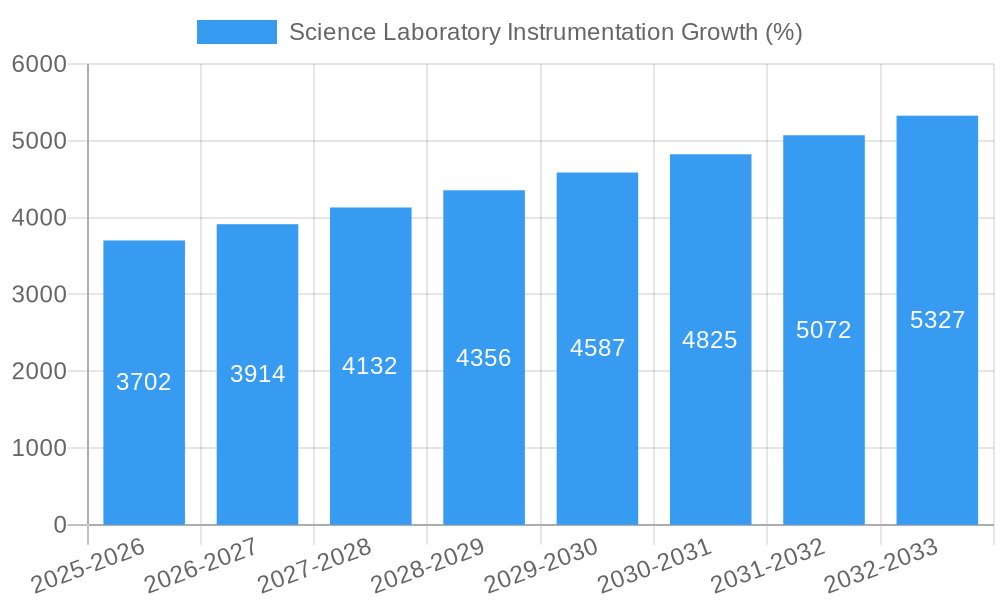
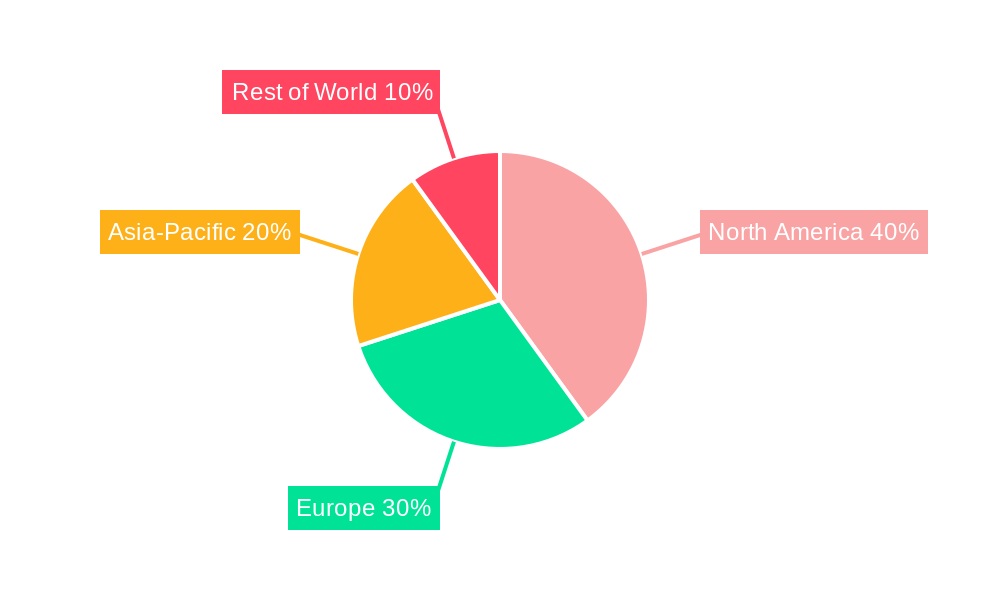
A compound annual growth rate (CAGR) of 5.3% from 2025 to 2033 suggests a substantial market expansion. Considering the historical period (2019-2024) and the projected growth rate, the market is expected to surpass $100 billion within the forecast period. This growth will be largely influenced by regional variations in healthcare infrastructure and research spending. North America and Europe are expected to retain significant market shares due to their robust healthcare sectors and advanced research capabilities. However, emerging markets in Asia-Pacific and Latin America are anticipated to exhibit faster growth rates due to increasing healthcare investments and rising awareness about the significance of laboratory testing. Segmentation analysis, while not explicitly provided, likely shows strong demand for specific instrument types like chromatography systems, mass spectrometers, and life science research tools, reflecting the diverse needs of various research applications. The competitive landscape requires continuous innovation and strategic adaptation to thrive in this dynamic market.
Science Laboratory Instrumentation Market Report: 2019-2033
This comprehensive report provides an in-depth analysis of the Science Laboratory Instrumentation market, encompassing market dynamics, growth trends, regional analysis, product landscape, key players, and future outlook. The study period spans from 2019 to 2033, with 2025 serving as the base and estimated year. The report forecasts market performance from 2025 to 2033, utilizing data from the historical period of 2019-2024. The market is segmented by instrument type (e.g., chromatography, spectroscopy, microscopy), application (e.g., pharmaceuticals, biotechnology, academia), and end-user (e.g., hospitals, research labs). The parent market is the broader scientific instrumentation industry, while the child market focuses specifically on laboratory-based equipment. The total market size in 2025 is estimated at xx million units.
Science Laboratory Instrumentation Market Dynamics & Structure
The Science Laboratory Instrumentation market is characterized by a moderately concentrated landscape, with key players like Thermo Fisher Scientific, Danaher, and Agilent Technologies holding significant market share (estimated collectively at 40% in 2025). Technological innovation, particularly in areas like automation, miniaturization, and high-throughput screening, is a major driver. Stringent regulatory frameworks governing laboratory equipment quality and safety influence market dynamics. Competitive product substitutes exist, primarily within specific instrument categories. The end-user demographic encompasses research institutions, pharmaceutical companies, biotech firms, hospitals, and academic labs, creating diverse demand patterns. A steady stream of M&A activity (estimated xx deals annually from 2019-2024) reflects industry consolidation and expansion strategies.
- Market Concentration: Oligopolistic, with top 10 players holding ~70% market share in 2025.
- Technological Innovation: Focus on AI integration, advanced sensors, and data analytics.
- Regulatory Framework: Stringent quality standards (e.g., FDA, ISO) impact product development and adoption.
- Competitive Substitutes: Presence of alternative technologies for specific analyses (e.g., different chromatography techniques).
- End-User Demographics: Diverse end-users with varying budgetary constraints and technological needs.
- M&A Trends: Consolidation through acquisitions aimed at expanding product portfolios and market reach.
Science Laboratory Instrumentation Growth Trends & Insights
The Science Laboratory Instrumentation market experienced robust growth during the historical period (2019-2024), with a CAGR of xx%. This growth is attributed to several factors, including increasing R&D spending across various industries, the expanding global biotechnology sector, and the growing adoption of advanced analytical techniques. The market is expected to maintain a healthy growth trajectory during the forecast period (2025-2033), driven by continued investment in scientific research, particularly in emerging economies. Technological advancements continue to shape the market, with a notable shift towards automation, miniaturization, and cloud-based data management solutions. Consumer behavior reflects a growing preference for integrated systems and enhanced data analytics capabilities. Market penetration within key segments (e.g., next-generation sequencing) remains relatively high but still shows significant room for growth.
Dominant Regions, Countries, or Segments in Science Laboratory Instrumentation
North America currently dominates the Science Laboratory Instrumentation market, driven by substantial R&D investment, a strong presence of key players, and robust healthcare infrastructure. Europe follows as a significant market, demonstrating consistent growth fueled by advancements in pharmaceutical and biotechnology sectors. The Asia-Pacific region shows the highest growth potential, spurred by increasing R&D investments from both domestic and foreign companies. Specific countries like the U.S., Germany, Japan, and China are major contributors due to their well-established scientific communities and supportive government policies.
- North America: Strong R&D spending, large established companies, and advanced healthcare infrastructure.
- Europe: High concentration of pharmaceutical and biotech firms, leading to significant demand for advanced analytical tools.
- Asia-Pacific: Rapid growth driven by increasing R&D investments, government support, and a burgeoning healthcare sector.
Science Laboratory Instrumentation Product Landscape
The Science Laboratory Instrumentation market offers a diverse range of products, including chromatography systems (HPLC, GC), mass spectrometers, spectrometers (UV-Vis, IR, NMR), microscopes (optical, electron), and various laboratory automation systems. Recent innovations focus on improving sensitivity, speed, and ease of use, along with enhanced data analysis capabilities and integration with laboratory information management systems (LIMS). Unique selling propositions often revolve around superior performance metrics like resolution, sensitivity, and throughput, often coupled with user-friendly software and comprehensive service support.
Key Drivers, Barriers & Challenges in Science Laboratory Instrumentation
Key Drivers:
- Rising R&D expenditure across various sectors.
- Growth of the pharmaceutical and biotechnology industries.
- Increasing demand for sophisticated analytical techniques.
- Technological advancements leading to improved instrument performance.
Challenges and Restraints:
- High initial investment costs for advanced instrumentation.
- Regulatory hurdles and compliance requirements.
- Intense competition and price pressures.
- Supply chain disruptions impacting instrument availability and pricing (estimated xx% impact on price increase in 2024).
Emerging Opportunities in Science Laboratory Instrumentation
- Growing demand for point-of-care diagnostics and personalized medicine drives development of portable and miniaturized instruments.
- Expansion into emerging markets with growing healthcare infrastructure and R&D investment.
- Integration of AI and machine learning for improved data analysis and automation.
Growth Accelerators in the Science Laboratory Instrumentation Industry
Strategic partnerships and collaborations between instrument manufacturers and software developers are driving innovation and expanding market access. Technological breakthroughs, such as advanced sensor technologies and novel analytical techniques, continuously improve instrument performance and open new application areas. Market expansion strategies targeting emerging markets and untapped applications further accelerate growth.
Key Players Shaping the Science Laboratory Instrumentation Market
- Thermo Fisher Scientific
- Shimadzu
- Danaher
- Roche
- Agilent Technologies
- Bruker
- Waters
- PerkinElmer
- Bio-Rad Laboratories
- Mettler Toledo
- Illumina
- Sartorius
- HORIBA
- MGI Tech
- JEOL
Notable Milestones in Science Laboratory Instrumentation Sector
- 2020: Thermo Fisher Scientific launched a new range of high-throughput screening instruments.
- 2021: Danaher acquired a leading provider of laboratory automation systems.
- 2022: Agilent Technologies introduced a novel mass spectrometer with enhanced sensitivity.
- 2023: Several companies announced collaborations focusing on AI-driven data analysis in laboratory settings.
In-Depth Science Laboratory Instrumentation Market Outlook
The Science Laboratory Instrumentation market is poised for continued growth, driven by ongoing technological advancements, increasing research funding, and expanding applications across various sectors. Strategic investments in R&D, acquisitions, and collaborations will shape the competitive landscape. Emerging technologies like AI and automation will be key differentiators, creating opportunities for companies to develop innovative solutions that enhance efficiency and accuracy in laboratory settings. The long-term outlook remains positive, with significant potential for market expansion in emerging economies and new application areas.
Science Laboratory Instrumentation Segmentation
-
1. Application
- 1.1. Pharma & Bio
- 1.2. Academic & Government
- 1.3. Healthcare
- 1.4. Industry
- 1.5. Other
-
2. Type
- 2.1. General Instrument
- 2.2. Analytical Instruments
- 2.3. Other
Science Laboratory Instrumentation Segmentation By Geography
-
1. North America
- 1.1. United States
- 1.2. Canada
- 1.3. Mexico
-
2. South America
- 2.1. Brazil
- 2.2. Argentina
- 2.3. Rest of South America
-
3. Europe
- 3.1. United Kingdom
- 3.2. Germany
- 3.3. France
- 3.4. Italy
- 3.5. Spain
- 3.6. Russia
- 3.7. Benelux
- 3.8. Nordics
- 3.9. Rest of Europe
-
4. Middle East & Africa
- 4.1. Turkey
- 4.2. Israel
- 4.3. GCC
- 4.4. North Africa
- 4.5. South Africa
- 4.6. Rest of Middle East & Africa
-
5. Asia Pacific
- 5.1. China
- 5.2. India
- 5.3. Japan
- 5.4. South Korea
- 5.5. ASEAN
- 5.6. Oceania
- 5.7. Rest of Asia Pacific
Science Laboratory Instrumentation REPORT HIGHLIGHTS
| Aspects | Details |
|---|---|
| Study Period | 2019-2033 |
| Base Year | 2024 |
| Estimated Year | 2025 |
| Forecast Period | 2025-2033 |
| Historical Period | 2019-2024 |
| Growth Rate | CAGR of 5.3% from 2019-2033 |
| Segmentation |
|
Table of Contents
- 1. Introduction
- 1.1. Research Scope
- 1.2. Market Segmentation
- 1.3. Research Methodology
- 1.4. Definitions and Assumptions
- 2. Executive Summary
- 2.1. Introduction
- 3. Market Dynamics
- 3.1. Introduction
- 3.2. Market Drivers
- 3.3. Market Restrains
- 3.4. Market Trends
- 4. Market Factor Analysis
- 4.1. Porters Five Forces
- 4.2. Supply/Value Chain
- 4.3. PESTEL analysis
- 4.4. Market Entropy
- 4.5. Patent/Trademark Analysis
- 5. Global Science Laboratory Instrumentation Analysis, Insights and Forecast, 2019-2031
- 5.1. Market Analysis, Insights and Forecast - by Application
- 5.1.1. Pharma & Bio
- 5.1.2. Academic & Government
- 5.1.3. Healthcare
- 5.1.4. Industry
- 5.1.5. Other
- 5.2. Market Analysis, Insights and Forecast - by Type
- 5.2.1. General Instrument
- 5.2.2. Analytical Instruments
- 5.2.3. Other
- 5.3. Market Analysis, Insights and Forecast - by Region
- 5.3.1. North America
- 5.3.2. South America
- 5.3.3. Europe
- 5.3.4. Middle East & Africa
- 5.3.5. Asia Pacific
- 5.1. Market Analysis, Insights and Forecast - by Application
- 6. North America Science Laboratory Instrumentation Analysis, Insights and Forecast, 2019-2031
- 6.1. Market Analysis, Insights and Forecast - by Application
- 6.1.1. Pharma & Bio
- 6.1.2. Academic & Government
- 6.1.3. Healthcare
- 6.1.4. Industry
- 6.1.5. Other
- 6.2. Market Analysis, Insights and Forecast - by Type
- 6.2.1. General Instrument
- 6.2.2. Analytical Instruments
- 6.2.3. Other
- 6.1. Market Analysis, Insights and Forecast - by Application
- 7. South America Science Laboratory Instrumentation Analysis, Insights and Forecast, 2019-2031
- 7.1. Market Analysis, Insights and Forecast - by Application
- 7.1.1. Pharma & Bio
- 7.1.2. Academic & Government
- 7.1.3. Healthcare
- 7.1.4. Industry
- 7.1.5. Other
- 7.2. Market Analysis, Insights and Forecast - by Type
- 7.2.1. General Instrument
- 7.2.2. Analytical Instruments
- 7.2.3. Other
- 7.1. Market Analysis, Insights and Forecast - by Application
- 8. Europe Science Laboratory Instrumentation Analysis, Insights and Forecast, 2019-2031
- 8.1. Market Analysis, Insights and Forecast - by Application
- 8.1.1. Pharma & Bio
- 8.1.2. Academic & Government
- 8.1.3. Healthcare
- 8.1.4. Industry
- 8.1.5. Other
- 8.2. Market Analysis, Insights and Forecast - by Type
- 8.2.1. General Instrument
- 8.2.2. Analytical Instruments
- 8.2.3. Other
- 8.1. Market Analysis, Insights and Forecast - by Application
- 9. Middle East & Africa Science Laboratory Instrumentation Analysis, Insights and Forecast, 2019-2031
- 9.1. Market Analysis, Insights and Forecast - by Application
- 9.1.1. Pharma & Bio
- 9.1.2. Academic & Government
- 9.1.3. Healthcare
- 9.1.4. Industry
- 9.1.5. Other
- 9.2. Market Analysis, Insights and Forecast - by Type
- 9.2.1. General Instrument
- 9.2.2. Analytical Instruments
- 9.2.3. Other
- 9.1. Market Analysis, Insights and Forecast - by Application
- 10. Asia Pacific Science Laboratory Instrumentation Analysis, Insights and Forecast, 2019-2031
- 10.1. Market Analysis, Insights and Forecast - by Application
- 10.1.1. Pharma & Bio
- 10.1.2. Academic & Government
- 10.1.3. Healthcare
- 10.1.4. Industry
- 10.1.5. Other
- 10.2. Market Analysis, Insights and Forecast - by Type
- 10.2.1. General Instrument
- 10.2.2. Analytical Instruments
- 10.2.3. Other
- 10.1. Market Analysis, Insights and Forecast - by Application
- 11. Competitive Analysis
- 11.1. Global Market Share Analysis 2024
- 11.2. Company Profiles
- 11.2.1 Thermo Fisher Scientific
- 11.2.1.1. Overview
- 11.2.1.2. Products
- 11.2.1.3. SWOT Analysis
- 11.2.1.4. Recent Developments
- 11.2.1.5. Financials (Based on Availability)
- 11.2.2 Shimadzu
- 11.2.2.1. Overview
- 11.2.2.2. Products
- 11.2.2.3. SWOT Analysis
- 11.2.2.4. Recent Developments
- 11.2.2.5. Financials (Based on Availability)
- 11.2.3 Danaher
- 11.2.3.1. Overview
- 11.2.3.2. Products
- 11.2.3.3. SWOT Analysis
- 11.2.3.4. Recent Developments
- 11.2.3.5. Financials (Based on Availability)
- 11.2.4 Roche
- 11.2.4.1. Overview
- 11.2.4.2. Products
- 11.2.4.3. SWOT Analysis
- 11.2.4.4. Recent Developments
- 11.2.4.5. Financials (Based on Availability)
- 11.2.5 Agilent Technologies
- 11.2.5.1. Overview
- 11.2.5.2. Products
- 11.2.5.3. SWOT Analysis
- 11.2.5.4. Recent Developments
- 11.2.5.5. Financials (Based on Availability)
- 11.2.6 Bruker
- 11.2.6.1. Overview
- 11.2.6.2. Products
- 11.2.6.3. SWOT Analysis
- 11.2.6.4. Recent Developments
- 11.2.6.5. Financials (Based on Availability)
- 11.2.7 Waters
- 11.2.7.1. Overview
- 11.2.7.2. Products
- 11.2.7.3. SWOT Analysis
- 11.2.7.4. Recent Developments
- 11.2.7.5. Financials (Based on Availability)
- 11.2.8 PerkinElmer
- 11.2.8.1. Overview
- 11.2.8.2. Products
- 11.2.8.3. SWOT Analysis
- 11.2.8.4. Recent Developments
- 11.2.8.5. Financials (Based on Availability)
- 11.2.9 Bio-Rad Laboratories
- 11.2.9.1. Overview
- 11.2.9.2. Products
- 11.2.9.3. SWOT Analysis
- 11.2.9.4. Recent Developments
- 11.2.9.5. Financials (Based on Availability)
- 11.2.10 Mettler Toledo
- 11.2.10.1. Overview
- 11.2.10.2. Products
- 11.2.10.3. SWOT Analysis
- 11.2.10.4. Recent Developments
- 11.2.10.5. Financials (Based on Availability)
- 11.2.11 Illumina
- 11.2.11.1. Overview
- 11.2.11.2. Products
- 11.2.11.3. SWOT Analysis
- 11.2.11.4. Recent Developments
- 11.2.11.5. Financials (Based on Availability)
- 11.2.12 Sartorius
- 11.2.12.1. Overview
- 11.2.12.2. Products
- 11.2.12.3. SWOT Analysis
- 11.2.12.4. Recent Developments
- 11.2.12.5. Financials (Based on Availability)
- 11.2.13 HORIBA
- 11.2.13.1. Overview
- 11.2.13.2. Products
- 11.2.13.3. SWOT Analysis
- 11.2.13.4. Recent Developments
- 11.2.13.5. Financials (Based on Availability)
- 11.2.14 MGI Tech
- 11.2.14.1. Overview
- 11.2.14.2. Products
- 11.2.14.3. SWOT Analysis
- 11.2.14.4. Recent Developments
- 11.2.14.5. Financials (Based on Availability)
- 11.2.15 JEOL
- 11.2.15.1. Overview
- 11.2.15.2. Products
- 11.2.15.3. SWOT Analysis
- 11.2.15.4. Recent Developments
- 11.2.15.5. Financials (Based on Availability)
- 11.2.1 Thermo Fisher Scientific
List of Figures
- Figure 1: Global Science Laboratory Instrumentation Revenue Breakdown (million, %) by Region 2024 & 2032
- Figure 2: North America Science Laboratory Instrumentation Revenue (million), by Application 2024 & 2032
- Figure 3: North America Science Laboratory Instrumentation Revenue Share (%), by Application 2024 & 2032
- Figure 4: North America Science Laboratory Instrumentation Revenue (million), by Type 2024 & 2032
- Figure 5: North America Science Laboratory Instrumentation Revenue Share (%), by Type 2024 & 2032
- Figure 6: North America Science Laboratory Instrumentation Revenue (million), by Country 2024 & 2032
- Figure 7: North America Science Laboratory Instrumentation Revenue Share (%), by Country 2024 & 2032
- Figure 8: South America Science Laboratory Instrumentation Revenue (million), by Application 2024 & 2032
- Figure 9: South America Science Laboratory Instrumentation Revenue Share (%), by Application 2024 & 2032
- Figure 10: South America Science Laboratory Instrumentation Revenue (million), by Type 2024 & 2032
- Figure 11: South America Science Laboratory Instrumentation Revenue Share (%), by Type 2024 & 2032
- Figure 12: South America Science Laboratory Instrumentation Revenue (million), by Country 2024 & 2032
- Figure 13: South America Science Laboratory Instrumentation Revenue Share (%), by Country 2024 & 2032
- Figure 14: Europe Science Laboratory Instrumentation Revenue (million), by Application 2024 & 2032
- Figure 15: Europe Science Laboratory Instrumentation Revenue Share (%), by Application 2024 & 2032
- Figure 16: Europe Science Laboratory Instrumentation Revenue (million), by Type 2024 & 2032
- Figure 17: Europe Science Laboratory Instrumentation Revenue Share (%), by Type 2024 & 2032
- Figure 18: Europe Science Laboratory Instrumentation Revenue (million), by Country 2024 & 2032
- Figure 19: Europe Science Laboratory Instrumentation Revenue Share (%), by Country 2024 & 2032
- Figure 20: Middle East & Africa Science Laboratory Instrumentation Revenue (million), by Application 2024 & 2032
- Figure 21: Middle East & Africa Science Laboratory Instrumentation Revenue Share (%), by Application 2024 & 2032
- Figure 22: Middle East & Africa Science Laboratory Instrumentation Revenue (million), by Type 2024 & 2032
- Figure 23: Middle East & Africa Science Laboratory Instrumentation Revenue Share (%), by Type 2024 & 2032
- Figure 24: Middle East & Africa Science Laboratory Instrumentation Revenue (million), by Country 2024 & 2032
- Figure 25: Middle East & Africa Science Laboratory Instrumentation Revenue Share (%), by Country 2024 & 2032
- Figure 26: Asia Pacific Science Laboratory Instrumentation Revenue (million), by Application 2024 & 2032
- Figure 27: Asia Pacific Science Laboratory Instrumentation Revenue Share (%), by Application 2024 & 2032
- Figure 28: Asia Pacific Science Laboratory Instrumentation Revenue (million), by Type 2024 & 2032
- Figure 29: Asia Pacific Science Laboratory Instrumentation Revenue Share (%), by Type 2024 & 2032
- Figure 30: Asia Pacific Science Laboratory Instrumentation Revenue (million), by Country 2024 & 2032
- Figure 31: Asia Pacific Science Laboratory Instrumentation Revenue Share (%), by Country 2024 & 2032
List of Tables
- Table 1: Global Science Laboratory Instrumentation Revenue million Forecast, by Region 2019 & 2032
- Table 2: Global Science Laboratory Instrumentation Revenue million Forecast, by Application 2019 & 2032
- Table 3: Global Science Laboratory Instrumentation Revenue million Forecast, by Type 2019 & 2032
- Table 4: Global Science Laboratory Instrumentation Revenue million Forecast, by Region 2019 & 2032
- Table 5: Global Science Laboratory Instrumentation Revenue million Forecast, by Application 2019 & 2032
- Table 6: Global Science Laboratory Instrumentation Revenue million Forecast, by Type 2019 & 2032
- Table 7: Global Science Laboratory Instrumentation Revenue million Forecast, by Country 2019 & 2032
- Table 8: United States Science Laboratory Instrumentation Revenue (million) Forecast, by Application 2019 & 2032
- Table 9: Canada Science Laboratory Instrumentation Revenue (million) Forecast, by Application 2019 & 2032
- Table 10: Mexico Science Laboratory Instrumentation Revenue (million) Forecast, by Application 2019 & 2032
- Table 11: Global Science Laboratory Instrumentation Revenue million Forecast, by Application 2019 & 2032
- Table 12: Global Science Laboratory Instrumentation Revenue million Forecast, by Type 2019 & 2032
- Table 13: Global Science Laboratory Instrumentation Revenue million Forecast, by Country 2019 & 2032
- Table 14: Brazil Science Laboratory Instrumentation Revenue (million) Forecast, by Application 2019 & 2032
- Table 15: Argentina Science Laboratory Instrumentation Revenue (million) Forecast, by Application 2019 & 2032
- Table 16: Rest of South America Science Laboratory Instrumentation Revenue (million) Forecast, by Application 2019 & 2032
- Table 17: Global Science Laboratory Instrumentation Revenue million Forecast, by Application 2019 & 2032
- Table 18: Global Science Laboratory Instrumentation Revenue million Forecast, by Type 2019 & 2032
- Table 19: Global Science Laboratory Instrumentation Revenue million Forecast, by Country 2019 & 2032
- Table 20: United Kingdom Science Laboratory Instrumentation Revenue (million) Forecast, by Application 2019 & 2032
- Table 21: Germany Science Laboratory Instrumentation Revenue (million) Forecast, by Application 2019 & 2032
- Table 22: France Science Laboratory Instrumentation Revenue (million) Forecast, by Application 2019 & 2032
- Table 23: Italy Science Laboratory Instrumentation Revenue (million) Forecast, by Application 2019 & 2032
- Table 24: Spain Science Laboratory Instrumentation Revenue (million) Forecast, by Application 2019 & 2032
- Table 25: Russia Science Laboratory Instrumentation Revenue (million) Forecast, by Application 2019 & 2032
- Table 26: Benelux Science Laboratory Instrumentation Revenue (million) Forecast, by Application 2019 & 2032
- Table 27: Nordics Science Laboratory Instrumentation Revenue (million) Forecast, by Application 2019 & 2032
- Table 28: Rest of Europe Science Laboratory Instrumentation Revenue (million) Forecast, by Application 2019 & 2032
- Table 29: Global Science Laboratory Instrumentation Revenue million Forecast, by Application 2019 & 2032
- Table 30: Global Science Laboratory Instrumentation Revenue million Forecast, by Type 2019 & 2032
- Table 31: Global Science Laboratory Instrumentation Revenue million Forecast, by Country 2019 & 2032
- Table 32: Turkey Science Laboratory Instrumentation Revenue (million) Forecast, by Application 2019 & 2032
- Table 33: Israel Science Laboratory Instrumentation Revenue (million) Forecast, by Application 2019 & 2032
- Table 34: GCC Science Laboratory Instrumentation Revenue (million) Forecast, by Application 2019 & 2032
- Table 35: North Africa Science Laboratory Instrumentation Revenue (million) Forecast, by Application 2019 & 2032
- Table 36: South Africa Science Laboratory Instrumentation Revenue (million) Forecast, by Application 2019 & 2032
- Table 37: Rest of Middle East & Africa Science Laboratory Instrumentation Revenue (million) Forecast, by Application 2019 & 2032
- Table 38: Global Science Laboratory Instrumentation Revenue million Forecast, by Application 2019 & 2032
- Table 39: Global Science Laboratory Instrumentation Revenue million Forecast, by Type 2019 & 2032
- Table 40: Global Science Laboratory Instrumentation Revenue million Forecast, by Country 2019 & 2032
- Table 41: China Science Laboratory Instrumentation Revenue (million) Forecast, by Application 2019 & 2032
- Table 42: India Science Laboratory Instrumentation Revenue (million) Forecast, by Application 2019 & 2032
- Table 43: Japan Science Laboratory Instrumentation Revenue (million) Forecast, by Application 2019 & 2032
- Table 44: South Korea Science Laboratory Instrumentation Revenue (million) Forecast, by Application 2019 & 2032
- Table 45: ASEAN Science Laboratory Instrumentation Revenue (million) Forecast, by Application 2019 & 2032
- Table 46: Oceania Science Laboratory Instrumentation Revenue (million) Forecast, by Application 2019 & 2032
- Table 47: Rest of Asia Pacific Science Laboratory Instrumentation Revenue (million) Forecast, by Application 2019 & 2032
Frequently Asked Questions
1. What is the projected Compound Annual Growth Rate (CAGR) of the Science Laboratory Instrumentation?
The projected CAGR is approximately 5.3%.
2. Which companies are prominent players in the Science Laboratory Instrumentation?
Key companies in the market include Thermo Fisher Scientific, Shimadzu, Danaher, Roche, Agilent Technologies, Bruker, Waters, PerkinElmer, Bio-Rad Laboratories, Mettler Toledo, Illumina, Sartorius, HORIBA, MGI Tech, JEOL.
3. What are the main segments of the Science Laboratory Instrumentation?
The market segments include Application, Type.
4. Can you provide details about the market size?
The market size is estimated to be USD 66650 million as of 2022.
5. What are some drivers contributing to market growth?
N/A
6. What are the notable trends driving market growth?
N/A
7. Are there any restraints impacting market growth?
N/A
8. Can you provide examples of recent developments in the market?
N/A
9. What pricing options are available for accessing the report?
Pricing options include single-user, multi-user, and enterprise licenses priced at USD 4250.00, USD 6375.00, and USD 8500.00 respectively.
10. Is the market size provided in terms of value or volume?
The market size is provided in terms of value, measured in million.
11. Are there any specific market keywords associated with the report?
Yes, the market keyword associated with the report is "Science Laboratory Instrumentation," which aids in identifying and referencing the specific market segment covered.
12. How do I determine which pricing option suits my needs best?
The pricing options vary based on user requirements and access needs. Individual users may opt for single-user licenses, while businesses requiring broader access may choose multi-user or enterprise licenses for cost-effective access to the report.
13. Are there any additional resources or data provided in the Science Laboratory Instrumentation report?
While the report offers comprehensive insights, it's advisable to review the specific contents or supplementary materials provided to ascertain if additional resources or data are available.
14. How can I stay updated on further developments or reports in the Science Laboratory Instrumentation?
To stay informed about further developments, trends, and reports in the Science Laboratory Instrumentation, consider subscribing to industry newsletters, following relevant companies and organizations, or regularly checking reputable industry news sources and publications.
Methodology
Step 1 - Identification of Relevant Samples Size from Population Database


Step 2 - Approaches for Defining Global Market Size (Value, Volume* & Price*)

Note*: In applicable scenarios
Step 3 - Data Sources
Primary Research
- Web Analytics
- Survey Reports
- Research Institute
- Latest Research Reports
- Opinion Leaders
Secondary Research
- Annual Reports
- White Paper
- Latest Press Release
- Industry Association
- Paid Database
- Investor Presentations

Step 4 - Data Triangulation
Involves using different sources of information in order to increase the validity of a study
These sources are likely to be stakeholders in a program - participants, other researchers, program staff, other community members, and so on.
Then we put all data in single framework & apply various statistical tools to find out the dynamic on the market.
During the analysis stage, feedback from the stakeholder groups would be compared to determine areas of agreement as well as areas of divergence
