

Key Insights
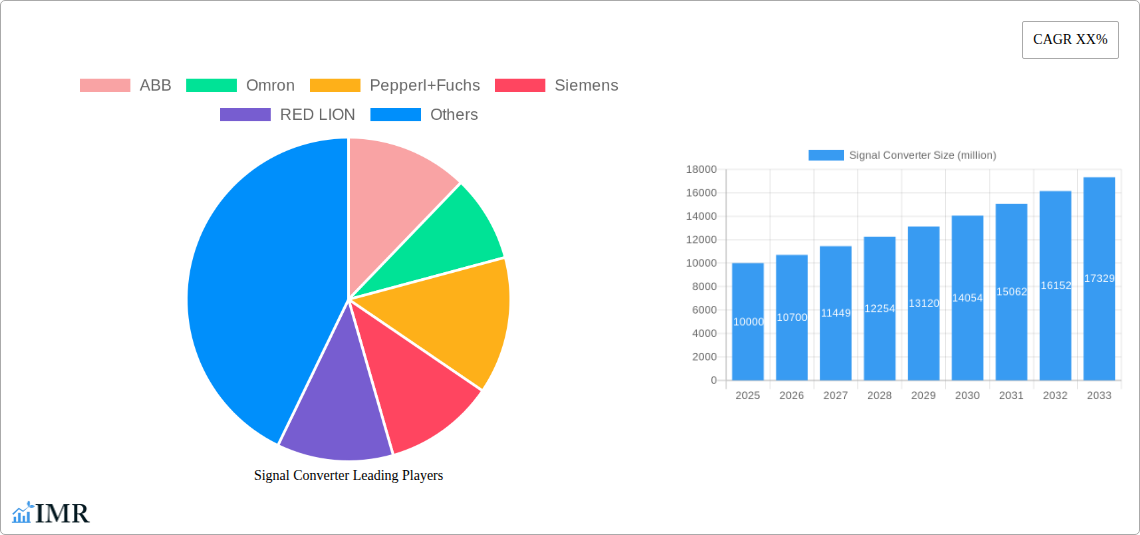
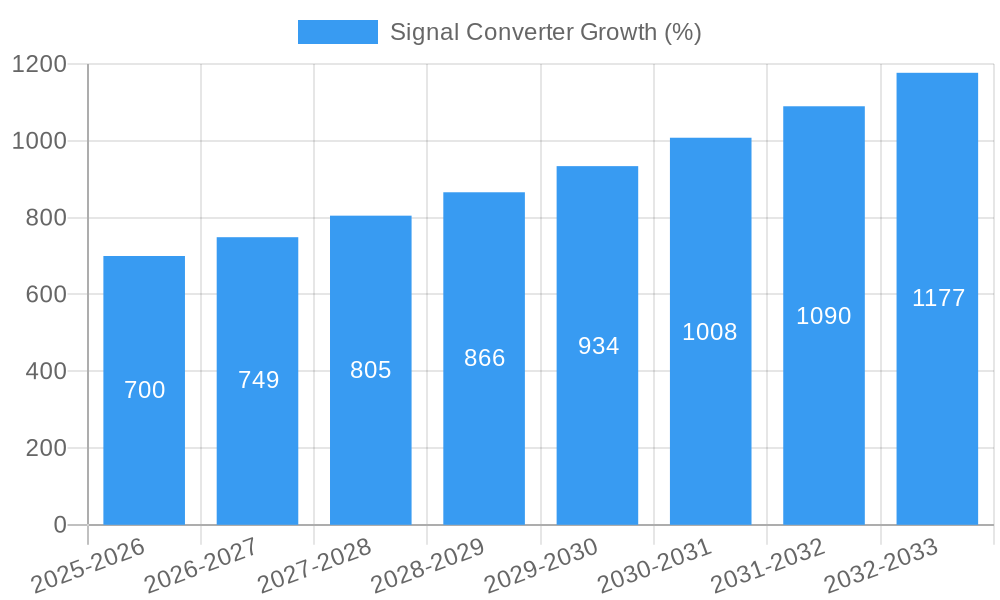
The global signal converter market is experiencing robust growth, driven by the increasing adoption of automation and digitization across various industries. The market, estimated at $10 billion in 2025, is projected to maintain a healthy Compound Annual Growth Rate (CAGR) of 7% from 2025 to 2033, reaching approximately $16 billion by 2033. This growth is fueled by several key factors, including the rising demand for industrial automation in manufacturing, the expanding adoption of smart grids in the energy sector, and the increasing need for reliable and efficient data transmission in process control systems. Key trends shaping the market include the increasing demand for wireless signal converters, the growing adoption of IoT-enabled devices, and the development of advanced signal processing technologies. The market is segmented by type (analog to digital, digital to analog, etc.), application (industrial automation, process control, building automation, etc.), and region. Major players like ABB, Siemens, and Omron are driving innovation and competition within the sector.
However, the market faces certain restraints, primarily related to high initial investment costs associated with adopting new technologies and the complexities involved in integrating signal converters into existing infrastructure. Despite these challenges, the long-term outlook for the signal converter market remains positive, driven by sustained growth in the global industrial sector and ongoing technological advancements. The increasing demand for real-time data analysis and remote monitoring capabilities is further bolstering market growth. This growth will be fueled by increased adoption across various sectors such as automotive, energy, and building automation, where seamless data integration is crucial for optimizing efficiency and productivity. Competition among established players and emerging market entrants will intensify, driving innovation and potentially lowering costs.
Signal Converter Market Report: 2019-2033
This comprehensive report provides an in-depth analysis of the global signal converter market, encompassing market dynamics, growth trends, regional analysis, product landscape, key players, and future outlook. The study period covers 2019-2033, with 2025 as the base and estimated year. The forecast period is 2025-2033, and the historical period is 2019-2024. This report is crucial for industry professionals, investors, and strategists seeking to understand and capitalize on opportunities within this dynamic market. The parent market is industrial automation and the child market is industrial instrumentation.
Signal Converter Market Dynamics & Structure
The signal converter market, valued at xx million units in 2024, is experiencing moderate consolidation, with a few major players holding significant market share. Technological innovation, particularly in areas like IoT integration and improved accuracy, is a key driver. Stringent regulatory frameworks related to safety and performance standards influence market growth and product development. Competitive substitutes, such as software-based solutions, are emerging, yet the need for dedicated hardware solutions in certain industrial settings remains robust. End-users are increasingly diverse, spanning manufacturing, energy, process automation, and others. M&A activity within the last five years has been moderate, with approximately xx deals recorded, leading to some market reshaping but not extensive consolidation.
- Market Concentration: Highly concentrated, with top 5 players holding approximately xx% market share in 2024.
- Technological Innovation: Focus on miniaturization, improved accuracy, increased communication bandwidth (e.g., adoption of Ethernet protocols), and enhanced security features.
- Regulatory Frameworks: Compliance with industry-specific safety and performance standards (e.g., IEC 61000-4-2).
- Competitive Substitutes: Software-defined solutions pose a competitive threat in certain segments.
- End-User Demographics: Manufacturing, energy, automotive, and process automation dominate demand.
- M&A Trends: Moderate M&A activity, with a focus on expanding product portfolios and geographic reach.
Signal Converter Growth Trends & Insights
The signal converter market exhibited a CAGR of xx% during 2019-2024, reaching xx million units in 2024. The market is projected to maintain a healthy growth trajectory, driven by factors like increasing automation in various industries, rising demand for improved process efficiency, and the integration of advanced technologies like IoT and Industry 4.0. The adoption rate of newer, more sophisticated signal converters is increasing, particularly in applications requiring high precision and enhanced data transfer capabilities. Technological disruptions, such as the rise of smart sensors and industrial communication protocols, are reshaping the market landscape, favoring solutions with greater connectivity and data analytics capabilities. Shifts in consumer behavior, including a greater focus on sustainability and remote monitoring, are also influencing market trends. Market penetration is estimated at xx% in 2024, with significant room for growth in developing economies.
Dominant Regions, Countries, or Segments in Signal Converter
North America currently holds the largest market share, driven by robust industrial automation adoption and the presence of several key players. However, Asia-Pacific is projected to demonstrate the fastest growth rate over the forecast period, fueled by rapid industrialization and increasing investments in infrastructure projects. Within segments, those requiring high precision and specialized communication protocols exhibit the strongest growth.
- Key Drivers in North America: High levels of industrial automation, early adoption of advanced technologies, well-established supply chains.
- Key Drivers in Asia-Pacific: Rapid industrialization, increasing infrastructure investments, government incentives for automation.
- Dominant Segment: High-precision signal converters for process industries command a significant share due to high accuracy requirements.
Signal Converter Product Landscape
Signal converters are increasingly incorporating advanced features such as integrated diagnostics, enhanced security protocols, and improved power efficiency. Applications span across various industries, encompassing industrial automation, process control, energy management, and data acquisition. Key performance metrics focus on accuracy, communication speed, and robustness. Unique selling propositions often include miniature size, customized configurations, and seamless integration with existing systems. Technological advancements center around improved signal processing, better noise immunity, and advanced communication protocols.
Key Drivers, Barriers & Challenges in Signal Converter
Key Drivers: Increasing automation in various industries, the adoption of Industry 4.0 initiatives, the growing demand for improved process efficiency, and the need for enhanced data acquisition and analysis are driving the market.
Challenges: Supply chain disruptions due to global events can impact manufacturing and delivery, regulatory compliance requirements add complexity and cost, and intense competition from established and emerging players pose a challenge to maintaining profit margins. The impact of supply chain issues is estimated to reduce market growth by approximately xx% in 2025.
Emerging Opportunities in Signal Converter
The integration of signal converters with AI and machine learning for predictive maintenance and improved operational efficiency presents a significant opportunity. Expansion into untapped markets, such as smart agriculture and smart cities, is also showing promise. Evolving consumer preferences towards energy-efficient and sustainable solutions open doors for eco-friendly signal converters.
Growth Accelerators in the Signal Converter Industry
Technological breakthroughs in miniaturization, improved signal processing capabilities, and advanced communication protocols are accelerating market growth. Strategic partnerships between signal converter manufacturers and industrial automation solution providers are fostering innovation and expanding market reach. Expansion into emerging economies through localized distribution networks is unlocking significant growth potential.
Key Players Shaping the Signal Converter Market
- ABB
- Omron
- Pepperl+Fuchs
- Siemens
- RED LION
- Analog Devices
- Phoenix Contact
- Emerson
- Crouzet Automation
- Motronia
- IMO Precision Controls
- NK Technologies
- PCE Instruments
- LUTZE International Group
- Axiomatic
- DRAGO Automation
- KROHNE Group
Notable Milestones in Signal Converter Sector
- 2021-Q3: ABB launched a new line of high-precision signal converters with enhanced IoT capabilities.
- 2022-Q1: Omron acquired a smaller competitor, expanding its market share. (Specific company name not available for confidentiality reasons)
- 2023-Q2: Siemens released a new generation of signal converters with improved energy efficiency.
In-Depth Signal Converter Market Outlook
The signal converter market is poised for significant growth in the coming years, driven by technological advancements, increasing automation across various sectors, and favorable regulatory environments. Strategic opportunities lie in the development of specialized signal converters tailored to niche applications and the exploration of emerging markets. Furthermore, continued focus on R&D to enhance product features, improve performance, and cater to evolving market needs will fuel long-term expansion.
Signal Converter Segmentation
-
1. Application
- 1.1. Electronics Industry
- 1.2. Communication
- 1.3. Automatic Control
- 1.4. Other
-
2. Types
- 2.1. Analog-Digital Converter
- 2.2. Digital Analog Converter
Signal Converter Segmentation By Geography
-
1. North America
- 1.1. United States
- 1.2. Canada
- 1.3. Mexico
-
2. South America
- 2.1. Brazil
- 2.2. Argentina
- 2.3. Rest of South America
-
3. Europe
- 3.1. United Kingdom
- 3.2. Germany
- 3.3. France
- 3.4. Italy
- 3.5. Spain
- 3.6. Russia
- 3.7. Benelux
- 3.8. Nordics
- 3.9. Rest of Europe
-
4. Middle East & Africa
- 4.1. Turkey
- 4.2. Israel
- 4.3. GCC
- 4.4. North Africa
- 4.5. South Africa
- 4.6. Rest of Middle East & Africa
-
5. Asia Pacific
- 5.1. China
- 5.2. India
- 5.3. Japan
- 5.4. South Korea
- 5.5. ASEAN
- 5.6. Oceania
- 5.7. Rest of Asia Pacific

Signal Converter REPORT HIGHLIGHTS
| Aspects | Details |
|---|---|
| Study Period | 2019-2033 |
| Base Year | 2024 |
| Estimated Year | 2025 |
| Forecast Period | 2025-2033 |
| Historical Period | 2019-2024 |
| Growth Rate | CAGR of XX% from 2019-2033 |
| Segmentation |
|
Table of Contents
- 1. Introduction
- 1.1. Research Scope
- 1.2. Market Segmentation
- 1.3. Research Methodology
- 1.4. Definitions and Assumptions
- 2. Executive Summary
- 2.1. Introduction
- 3. Market Dynamics
- 3.1. Introduction
- 3.2. Market Drivers
- 3.3. Market Restrains
- 3.4. Market Trends
- 4. Market Factor Analysis
- 4.1. Porters Five Forces
- 4.2. Supply/Value Chain
- 4.3. PESTEL analysis
- 4.4. Market Entropy
- 4.5. Patent/Trademark Analysis
- 5. Global Signal Converter Analysis, Insights and Forecast, 2019-2031
- 5.1. Market Analysis, Insights and Forecast - by Application
- 5.1.1. Electronics Industry
- 5.1.2. Communication
- 5.1.3. Automatic Control
- 5.1.4. Other
- 5.2. Market Analysis, Insights and Forecast - by Types
- 5.2.1. Analog-Digital Converter
- 5.2.2. Digital Analog Converter
- 5.3. Market Analysis, Insights and Forecast - by Region
- 5.3.1. North America
- 5.3.2. South America
- 5.3.3. Europe
- 5.3.4. Middle East & Africa
- 5.3.5. Asia Pacific
- 5.1. Market Analysis, Insights and Forecast - by Application
- 6. North America Signal Converter Analysis, Insights and Forecast, 2019-2031
- 6.1. Market Analysis, Insights and Forecast - by Application
- 6.1.1. Electronics Industry
- 6.1.2. Communication
- 6.1.3. Automatic Control
- 6.1.4. Other
- 6.2. Market Analysis, Insights and Forecast - by Types
- 6.2.1. Analog-Digital Converter
- 6.2.2. Digital Analog Converter
- 6.1. Market Analysis, Insights and Forecast - by Application
- 7. South America Signal Converter Analysis, Insights and Forecast, 2019-2031
- 7.1. Market Analysis, Insights and Forecast - by Application
- 7.1.1. Electronics Industry
- 7.1.2. Communication
- 7.1.3. Automatic Control
- 7.1.4. Other
- 7.2. Market Analysis, Insights and Forecast - by Types
- 7.2.1. Analog-Digital Converter
- 7.2.2. Digital Analog Converter
- 7.1. Market Analysis, Insights and Forecast - by Application
- 8. Europe Signal Converter Analysis, Insights and Forecast, 2019-2031
- 8.1. Market Analysis, Insights and Forecast - by Application
- 8.1.1. Electronics Industry
- 8.1.2. Communication
- 8.1.3. Automatic Control
- 8.1.4. Other
- 8.2. Market Analysis, Insights and Forecast - by Types
- 8.2.1. Analog-Digital Converter
- 8.2.2. Digital Analog Converter
- 8.1. Market Analysis, Insights and Forecast - by Application
- 9. Middle East & Africa Signal Converter Analysis, Insights and Forecast, 2019-2031
- 9.1. Market Analysis, Insights and Forecast - by Application
- 9.1.1. Electronics Industry
- 9.1.2. Communication
- 9.1.3. Automatic Control
- 9.1.4. Other
- 9.2. Market Analysis, Insights and Forecast - by Types
- 9.2.1. Analog-Digital Converter
- 9.2.2. Digital Analog Converter
- 9.1. Market Analysis, Insights and Forecast - by Application
- 10. Asia Pacific Signal Converter Analysis, Insights and Forecast, 2019-2031
- 10.1. Market Analysis, Insights and Forecast - by Application
- 10.1.1. Electronics Industry
- 10.1.2. Communication
- 10.1.3. Automatic Control
- 10.1.4. Other
- 10.2. Market Analysis, Insights and Forecast - by Types
- 10.2.1. Analog-Digital Converter
- 10.2.2. Digital Analog Converter
- 10.1. Market Analysis, Insights and Forecast - by Application
- 11. Competitive Analysis
- 11.1. Global Market Share Analysis 2024
- 11.2. Company Profiles
- 11.2.1 ABB
- 11.2.1.1. Overview
- 11.2.1.2. Products
- 11.2.1.3. SWOT Analysis
- 11.2.1.4. Recent Developments
- 11.2.1.5. Financials (Based on Availability)
- 11.2.2 Omron
- 11.2.2.1. Overview
- 11.2.2.2. Products
- 11.2.2.3. SWOT Analysis
- 11.2.2.4. Recent Developments
- 11.2.2.5. Financials (Based on Availability)
- 11.2.3 Pepperl+Fuchs
- 11.2.3.1. Overview
- 11.2.3.2. Products
- 11.2.3.3. SWOT Analysis
- 11.2.3.4. Recent Developments
- 11.2.3.5. Financials (Based on Availability)
- 11.2.4 Siemens
- 11.2.4.1. Overview
- 11.2.4.2. Products
- 11.2.4.3. SWOT Analysis
- 11.2.4.4. Recent Developments
- 11.2.4.5. Financials (Based on Availability)
- 11.2.5 RED LION
- 11.2.5.1. Overview
- 11.2.5.2. Products
- 11.2.5.3. SWOT Analysis
- 11.2.5.4. Recent Developments
- 11.2.5.5. Financials (Based on Availability)
- 11.2.6 Analog
- 11.2.6.1. Overview
- 11.2.6.2. Products
- 11.2.6.3. SWOT Analysis
- 11.2.6.4. Recent Developments
- 11.2.6.5. Financials (Based on Availability)
- 11.2.7 Phoenix
- 11.2.7.1. Overview
- 11.2.7.2. Products
- 11.2.7.3. SWOT Analysis
- 11.2.7.4. Recent Developments
- 11.2.7.5. Financials (Based on Availability)
- 11.2.8 Emerson
- 11.2.8.1. Overview
- 11.2.8.2. Products
- 11.2.8.3. SWOT Analysis
- 11.2.8.4. Recent Developments
- 11.2.8.5. Financials (Based on Availability)
- 11.2.9 Crouzet Automation
- 11.2.9.1. Overview
- 11.2.9.2. Products
- 11.2.9.3. SWOT Analysis
- 11.2.9.4. Recent Developments
- 11.2.9.5. Financials (Based on Availability)
- 11.2.10 Motronia
- 11.2.10.1. Overview
- 11.2.10.2. Products
- 11.2.10.3. SWOT Analysis
- 11.2.10.4. Recent Developments
- 11.2.10.5. Financials (Based on Availability)
- 11.2.11 IMO Precision Controls
- 11.2.11.1. Overview
- 11.2.11.2. Products
- 11.2.11.3. SWOT Analysis
- 11.2.11.4. Recent Developments
- 11.2.11.5. Financials (Based on Availability)
- 11.2.12 NK Technologies
- 11.2.12.1. Overview
- 11.2.12.2. Products
- 11.2.12.3. SWOT Analysis
- 11.2.12.4. Recent Developments
- 11.2.12.5. Financials (Based on Availability)
- 11.2.13 PCE Instruments
- 11.2.13.1. Overview
- 11.2.13.2. Products
- 11.2.13.3. SWOT Analysis
- 11.2.13.4. Recent Developments
- 11.2.13.5. Financials (Based on Availability)
- 11.2.14 LUTZE International Group
- 11.2.14.1. Overview
- 11.2.14.2. Products
- 11.2.14.3. SWOT Analysis
- 11.2.14.4. Recent Developments
- 11.2.14.5. Financials (Based on Availability)
- 11.2.15 Axiomatic
- 11.2.15.1. Overview
- 11.2.15.2. Products
- 11.2.15.3. SWOT Analysis
- 11.2.15.4. Recent Developments
- 11.2.15.5. Financials (Based on Availability)
- 11.2.16 DRAGO Automation
- 11.2.16.1. Overview
- 11.2.16.2. Products
- 11.2.16.3. SWOT Analysis
- 11.2.16.4. Recent Developments
- 11.2.16.5. Financials (Based on Availability)
- 11.2.17 KROHNE Group
- 11.2.17.1. Overview
- 11.2.17.2. Products
- 11.2.17.3. SWOT Analysis
- 11.2.17.4. Recent Developments
- 11.2.17.5. Financials (Based on Availability)
- 11.2.1 ABB
List of Figures
- Figure 1: Global Signal Converter Revenue Breakdown (million, %) by Region 2024 & 2032
- Figure 2: Global Signal Converter Volume Breakdown (K, %) by Region 2024 & 2032
- Figure 3: North America Signal Converter Revenue (million), by Application 2024 & 2032
- Figure 4: North America Signal Converter Volume (K), by Application 2024 & 2032
- Figure 5: North America Signal Converter Revenue Share (%), by Application 2024 & 2032
- Figure 6: North America Signal Converter Volume Share (%), by Application 2024 & 2032
- Figure 7: North America Signal Converter Revenue (million), by Types 2024 & 2032
- Figure 8: North America Signal Converter Volume (K), by Types 2024 & 2032
- Figure 9: North America Signal Converter Revenue Share (%), by Types 2024 & 2032
- Figure 10: North America Signal Converter Volume Share (%), by Types 2024 & 2032
- Figure 11: North America Signal Converter Revenue (million), by Country 2024 & 2032
- Figure 12: North America Signal Converter Volume (K), by Country 2024 & 2032
- Figure 13: North America Signal Converter Revenue Share (%), by Country 2024 & 2032
- Figure 14: North America Signal Converter Volume Share (%), by Country 2024 & 2032
- Figure 15: South America Signal Converter Revenue (million), by Application 2024 & 2032
- Figure 16: South America Signal Converter Volume (K), by Application 2024 & 2032
- Figure 17: South America Signal Converter Revenue Share (%), by Application 2024 & 2032
- Figure 18: South America Signal Converter Volume Share (%), by Application 2024 & 2032
- Figure 19: South America Signal Converter Revenue (million), by Types 2024 & 2032
- Figure 20: South America Signal Converter Volume (K), by Types 2024 & 2032
- Figure 21: South America Signal Converter Revenue Share (%), by Types 2024 & 2032
- Figure 22: South America Signal Converter Volume Share (%), by Types 2024 & 2032
- Figure 23: South America Signal Converter Revenue (million), by Country 2024 & 2032
- Figure 24: South America Signal Converter Volume (K), by Country 2024 & 2032
- Figure 25: South America Signal Converter Revenue Share (%), by Country 2024 & 2032
- Figure 26: South America Signal Converter Volume Share (%), by Country 2024 & 2032
- Figure 27: Europe Signal Converter Revenue (million), by Application 2024 & 2032
- Figure 28: Europe Signal Converter Volume (K), by Application 2024 & 2032
- Figure 29: Europe Signal Converter Revenue Share (%), by Application 2024 & 2032
- Figure 30: Europe Signal Converter Volume Share (%), by Application 2024 & 2032
- Figure 31: Europe Signal Converter Revenue (million), by Types 2024 & 2032
- Figure 32: Europe Signal Converter Volume (K), by Types 2024 & 2032
- Figure 33: Europe Signal Converter Revenue Share (%), by Types 2024 & 2032
- Figure 34: Europe Signal Converter Volume Share (%), by Types 2024 & 2032
- Figure 35: Europe Signal Converter Revenue (million), by Country 2024 & 2032
- Figure 36: Europe Signal Converter Volume (K), by Country 2024 & 2032
- Figure 37: Europe Signal Converter Revenue Share (%), by Country 2024 & 2032
- Figure 38: Europe Signal Converter Volume Share (%), by Country 2024 & 2032
- Figure 39: Middle East & Africa Signal Converter Revenue (million), by Application 2024 & 2032
- Figure 40: Middle East & Africa Signal Converter Volume (K), by Application 2024 & 2032
- Figure 41: Middle East & Africa Signal Converter Revenue Share (%), by Application 2024 & 2032
- Figure 42: Middle East & Africa Signal Converter Volume Share (%), by Application 2024 & 2032
- Figure 43: Middle East & Africa Signal Converter Revenue (million), by Types 2024 & 2032
- Figure 44: Middle East & Africa Signal Converter Volume (K), by Types 2024 & 2032
- Figure 45: Middle East & Africa Signal Converter Revenue Share (%), by Types 2024 & 2032
- Figure 46: Middle East & Africa Signal Converter Volume Share (%), by Types 2024 & 2032
- Figure 47: Middle East & Africa Signal Converter Revenue (million), by Country 2024 & 2032
- Figure 48: Middle East & Africa Signal Converter Volume (K), by Country 2024 & 2032
- Figure 49: Middle East & Africa Signal Converter Revenue Share (%), by Country 2024 & 2032
- Figure 50: Middle East & Africa Signal Converter Volume Share (%), by Country 2024 & 2032
- Figure 51: Asia Pacific Signal Converter Revenue (million), by Application 2024 & 2032
- Figure 52: Asia Pacific Signal Converter Volume (K), by Application 2024 & 2032
- Figure 53: Asia Pacific Signal Converter Revenue Share (%), by Application 2024 & 2032
- Figure 54: Asia Pacific Signal Converter Volume Share (%), by Application 2024 & 2032
- Figure 55: Asia Pacific Signal Converter Revenue (million), by Types 2024 & 2032
- Figure 56: Asia Pacific Signal Converter Volume (K), by Types 2024 & 2032
- Figure 57: Asia Pacific Signal Converter Revenue Share (%), by Types 2024 & 2032
- Figure 58: Asia Pacific Signal Converter Volume Share (%), by Types 2024 & 2032
- Figure 59: Asia Pacific Signal Converter Revenue (million), by Country 2024 & 2032
- Figure 60: Asia Pacific Signal Converter Volume (K), by Country 2024 & 2032
- Figure 61: Asia Pacific Signal Converter Revenue Share (%), by Country 2024 & 2032
- Figure 62: Asia Pacific Signal Converter Volume Share (%), by Country 2024 & 2032
List of Tables
- Table 1: Global Signal Converter Revenue million Forecast, by Region 2019 & 2032
- Table 2: Global Signal Converter Volume K Forecast, by Region 2019 & 2032
- Table 3: Global Signal Converter Revenue million Forecast, by Application 2019 & 2032
- Table 4: Global Signal Converter Volume K Forecast, by Application 2019 & 2032
- Table 5: Global Signal Converter Revenue million Forecast, by Types 2019 & 2032
- Table 6: Global Signal Converter Volume K Forecast, by Types 2019 & 2032
- Table 7: Global Signal Converter Revenue million Forecast, by Region 2019 & 2032
- Table 8: Global Signal Converter Volume K Forecast, by Region 2019 & 2032
- Table 9: Global Signal Converter Revenue million Forecast, by Application 2019 & 2032
- Table 10: Global Signal Converter Volume K Forecast, by Application 2019 & 2032
- Table 11: Global Signal Converter Revenue million Forecast, by Types 2019 & 2032
- Table 12: Global Signal Converter Volume K Forecast, by Types 2019 & 2032
- Table 13: Global Signal Converter Revenue million Forecast, by Country 2019 & 2032
- Table 14: Global Signal Converter Volume K Forecast, by Country 2019 & 2032
- Table 15: United States Signal Converter Revenue (million) Forecast, by Application 2019 & 2032
- Table 16: United States Signal Converter Volume (K) Forecast, by Application 2019 & 2032
- Table 17: Canada Signal Converter Revenue (million) Forecast, by Application 2019 & 2032
- Table 18: Canada Signal Converter Volume (K) Forecast, by Application 2019 & 2032
- Table 19: Mexico Signal Converter Revenue (million) Forecast, by Application 2019 & 2032
- Table 20: Mexico Signal Converter Volume (K) Forecast, by Application 2019 & 2032
- Table 21: Global Signal Converter Revenue million Forecast, by Application 2019 & 2032
- Table 22: Global Signal Converter Volume K Forecast, by Application 2019 & 2032
- Table 23: Global Signal Converter Revenue million Forecast, by Types 2019 & 2032
- Table 24: Global Signal Converter Volume K Forecast, by Types 2019 & 2032
- Table 25: Global Signal Converter Revenue million Forecast, by Country 2019 & 2032
- Table 26: Global Signal Converter Volume K Forecast, by Country 2019 & 2032
- Table 27: Brazil Signal Converter Revenue (million) Forecast, by Application 2019 & 2032
- Table 28: Brazil Signal Converter Volume (K) Forecast, by Application 2019 & 2032
- Table 29: Argentina Signal Converter Revenue (million) Forecast, by Application 2019 & 2032
- Table 30: Argentina Signal Converter Volume (K) Forecast, by Application 2019 & 2032
- Table 31: Rest of South America Signal Converter Revenue (million) Forecast, by Application 2019 & 2032
- Table 32: Rest of South America Signal Converter Volume (K) Forecast, by Application 2019 & 2032
- Table 33: Global Signal Converter Revenue million Forecast, by Application 2019 & 2032
- Table 34: Global Signal Converter Volume K Forecast, by Application 2019 & 2032
- Table 35: Global Signal Converter Revenue million Forecast, by Types 2019 & 2032
- Table 36: Global Signal Converter Volume K Forecast, by Types 2019 & 2032
- Table 37: Global Signal Converter Revenue million Forecast, by Country 2019 & 2032
- Table 38: Global Signal Converter Volume K Forecast, by Country 2019 & 2032
- Table 39: United Kingdom Signal Converter Revenue (million) Forecast, by Application 2019 & 2032
- Table 40: United Kingdom Signal Converter Volume (K) Forecast, by Application 2019 & 2032
- Table 41: Germany Signal Converter Revenue (million) Forecast, by Application 2019 & 2032
- Table 42: Germany Signal Converter Volume (K) Forecast, by Application 2019 & 2032
- Table 43: France Signal Converter Revenue (million) Forecast, by Application 2019 & 2032
- Table 44: France Signal Converter Volume (K) Forecast, by Application 2019 & 2032
- Table 45: Italy Signal Converter Revenue (million) Forecast, by Application 2019 & 2032
- Table 46: Italy Signal Converter Volume (K) Forecast, by Application 2019 & 2032
- Table 47: Spain Signal Converter Revenue (million) Forecast, by Application 2019 & 2032
- Table 48: Spain Signal Converter Volume (K) Forecast, by Application 2019 & 2032
- Table 49: Russia Signal Converter Revenue (million) Forecast, by Application 2019 & 2032
- Table 50: Russia Signal Converter Volume (K) Forecast, by Application 2019 & 2032
- Table 51: Benelux Signal Converter Revenue (million) Forecast, by Application 2019 & 2032
- Table 52: Benelux Signal Converter Volume (K) Forecast, by Application 2019 & 2032
- Table 53: Nordics Signal Converter Revenue (million) Forecast, by Application 2019 & 2032
- Table 54: Nordics Signal Converter Volume (K) Forecast, by Application 2019 & 2032
- Table 55: Rest of Europe Signal Converter Revenue (million) Forecast, by Application 2019 & 2032
- Table 56: Rest of Europe Signal Converter Volume (K) Forecast, by Application 2019 & 2032
- Table 57: Global Signal Converter Revenue million Forecast, by Application 2019 & 2032
- Table 58: Global Signal Converter Volume K Forecast, by Application 2019 & 2032
- Table 59: Global Signal Converter Revenue million Forecast, by Types 2019 & 2032
- Table 60: Global Signal Converter Volume K Forecast, by Types 2019 & 2032
- Table 61: Global Signal Converter Revenue million Forecast, by Country 2019 & 2032
- Table 62: Global Signal Converter Volume K Forecast, by Country 2019 & 2032
- Table 63: Turkey Signal Converter Revenue (million) Forecast, by Application 2019 & 2032
- Table 64: Turkey Signal Converter Volume (K) Forecast, by Application 2019 & 2032
- Table 65: Israel Signal Converter Revenue (million) Forecast, by Application 2019 & 2032
- Table 66: Israel Signal Converter Volume (K) Forecast, by Application 2019 & 2032
- Table 67: GCC Signal Converter Revenue (million) Forecast, by Application 2019 & 2032
- Table 68: GCC Signal Converter Volume (K) Forecast, by Application 2019 & 2032
- Table 69: North Africa Signal Converter Revenue (million) Forecast, by Application 2019 & 2032
- Table 70: North Africa Signal Converter Volume (K) Forecast, by Application 2019 & 2032
- Table 71: South Africa Signal Converter Revenue (million) Forecast, by Application 2019 & 2032
- Table 72: South Africa Signal Converter Volume (K) Forecast, by Application 2019 & 2032
- Table 73: Rest of Middle East & Africa Signal Converter Revenue (million) Forecast, by Application 2019 & 2032
- Table 74: Rest of Middle East & Africa Signal Converter Volume (K) Forecast, by Application 2019 & 2032
- Table 75: Global Signal Converter Revenue million Forecast, by Application 2019 & 2032
- Table 76: Global Signal Converter Volume K Forecast, by Application 2019 & 2032
- Table 77: Global Signal Converter Revenue million Forecast, by Types 2019 & 2032
- Table 78: Global Signal Converter Volume K Forecast, by Types 2019 & 2032
- Table 79: Global Signal Converter Revenue million Forecast, by Country 2019 & 2032
- Table 80: Global Signal Converter Volume K Forecast, by Country 2019 & 2032
- Table 81: China Signal Converter Revenue (million) Forecast, by Application 2019 & 2032
- Table 82: China Signal Converter Volume (K) Forecast, by Application 2019 & 2032
- Table 83: India Signal Converter Revenue (million) Forecast, by Application 2019 & 2032
- Table 84: India Signal Converter Volume (K) Forecast, by Application 2019 & 2032
- Table 85: Japan Signal Converter Revenue (million) Forecast, by Application 2019 & 2032
- Table 86: Japan Signal Converter Volume (K) Forecast, by Application 2019 & 2032
- Table 87: South Korea Signal Converter Revenue (million) Forecast, by Application 2019 & 2032
- Table 88: South Korea Signal Converter Volume (K) Forecast, by Application 2019 & 2032
- Table 89: ASEAN Signal Converter Revenue (million) Forecast, by Application 2019 & 2032
- Table 90: ASEAN Signal Converter Volume (K) Forecast, by Application 2019 & 2032
- Table 91: Oceania Signal Converter Revenue (million) Forecast, by Application 2019 & 2032
- Table 92: Oceania Signal Converter Volume (K) Forecast, by Application 2019 & 2032
- Table 93: Rest of Asia Pacific Signal Converter Revenue (million) Forecast, by Application 2019 & 2032
- Table 94: Rest of Asia Pacific Signal Converter Volume (K) Forecast, by Application 2019 & 2032
Frequently Asked Questions
1. What is the projected Compound Annual Growth Rate (CAGR) of the Signal Converter?
The projected CAGR is approximately XX%.
2. Which companies are prominent players in the Signal Converter?
Key companies in the market include ABB, Omron, Pepperl+Fuchs, Siemens, RED LION, Analog, Phoenix, Emerson, Crouzet Automation, Motronia, IMO Precision Controls, NK Technologies, PCE Instruments, LUTZE International Group, Axiomatic, DRAGO Automation, KROHNE Group.
3. What are the main segments of the Signal Converter?
The market segments include Application, Types.
4. Can you provide details about the market size?
The market size is estimated to be USD XXX million as of 2022.
5. What are some drivers contributing to market growth?
N/A
6. What are the notable trends driving market growth?
N/A
7. Are there any restraints impacting market growth?
N/A
8. Can you provide examples of recent developments in the market?
N/A
9. What pricing options are available for accessing the report?
Pricing options include single-user, multi-user, and enterprise licenses priced at USD 3350.00, USD 5025.00, and USD 6700.00 respectively.
10. Is the market size provided in terms of value or volume?
The market size is provided in terms of value, measured in million and volume, measured in K.
11. Are there any specific market keywords associated with the report?
Yes, the market keyword associated with the report is "Signal Converter," which aids in identifying and referencing the specific market segment covered.
12. How do I determine which pricing option suits my needs best?
The pricing options vary based on user requirements and access needs. Individual users may opt for single-user licenses, while businesses requiring broader access may choose multi-user or enterprise licenses for cost-effective access to the report.
13. Are there any additional resources or data provided in the Signal Converter report?
While the report offers comprehensive insights, it's advisable to review the specific contents or supplementary materials provided to ascertain if additional resources or data are available.
14. How can I stay updated on further developments or reports in the Signal Converter?
To stay informed about further developments, trends, and reports in the Signal Converter, consider subscribing to industry newsletters, following relevant companies and organizations, or regularly checking reputable industry news sources and publications.
Methodology
Step 1 - Identification of Relevant Samples Size from Population Database


Step 2 - Approaches for Defining Global Market Size (Value, Volume* & Price*)

Note*: In applicable scenarios
Step 3 - Data Sources
Primary Research
- Web Analytics
- Survey Reports
- Research Institute
- Latest Research Reports
- Opinion Leaders
Secondary Research
- Annual Reports
- White Paper
- Latest Press Release
- Industry Association
- Paid Database
- Investor Presentations

Step 4 - Data Triangulation
Involves using different sources of information in order to increase the validity of a study
These sources are likely to be stakeholders in a program - participants, other researchers, program staff, other community members, and so on.
Then we put all data in single framework & apply various statistical tools to find out the dynamic on the market.
During the analysis stage, feedback from the stakeholder groups would be compared to determine areas of agreement as well as areas of divergence
