

Key Insights into the Smart Manufacturing Industry
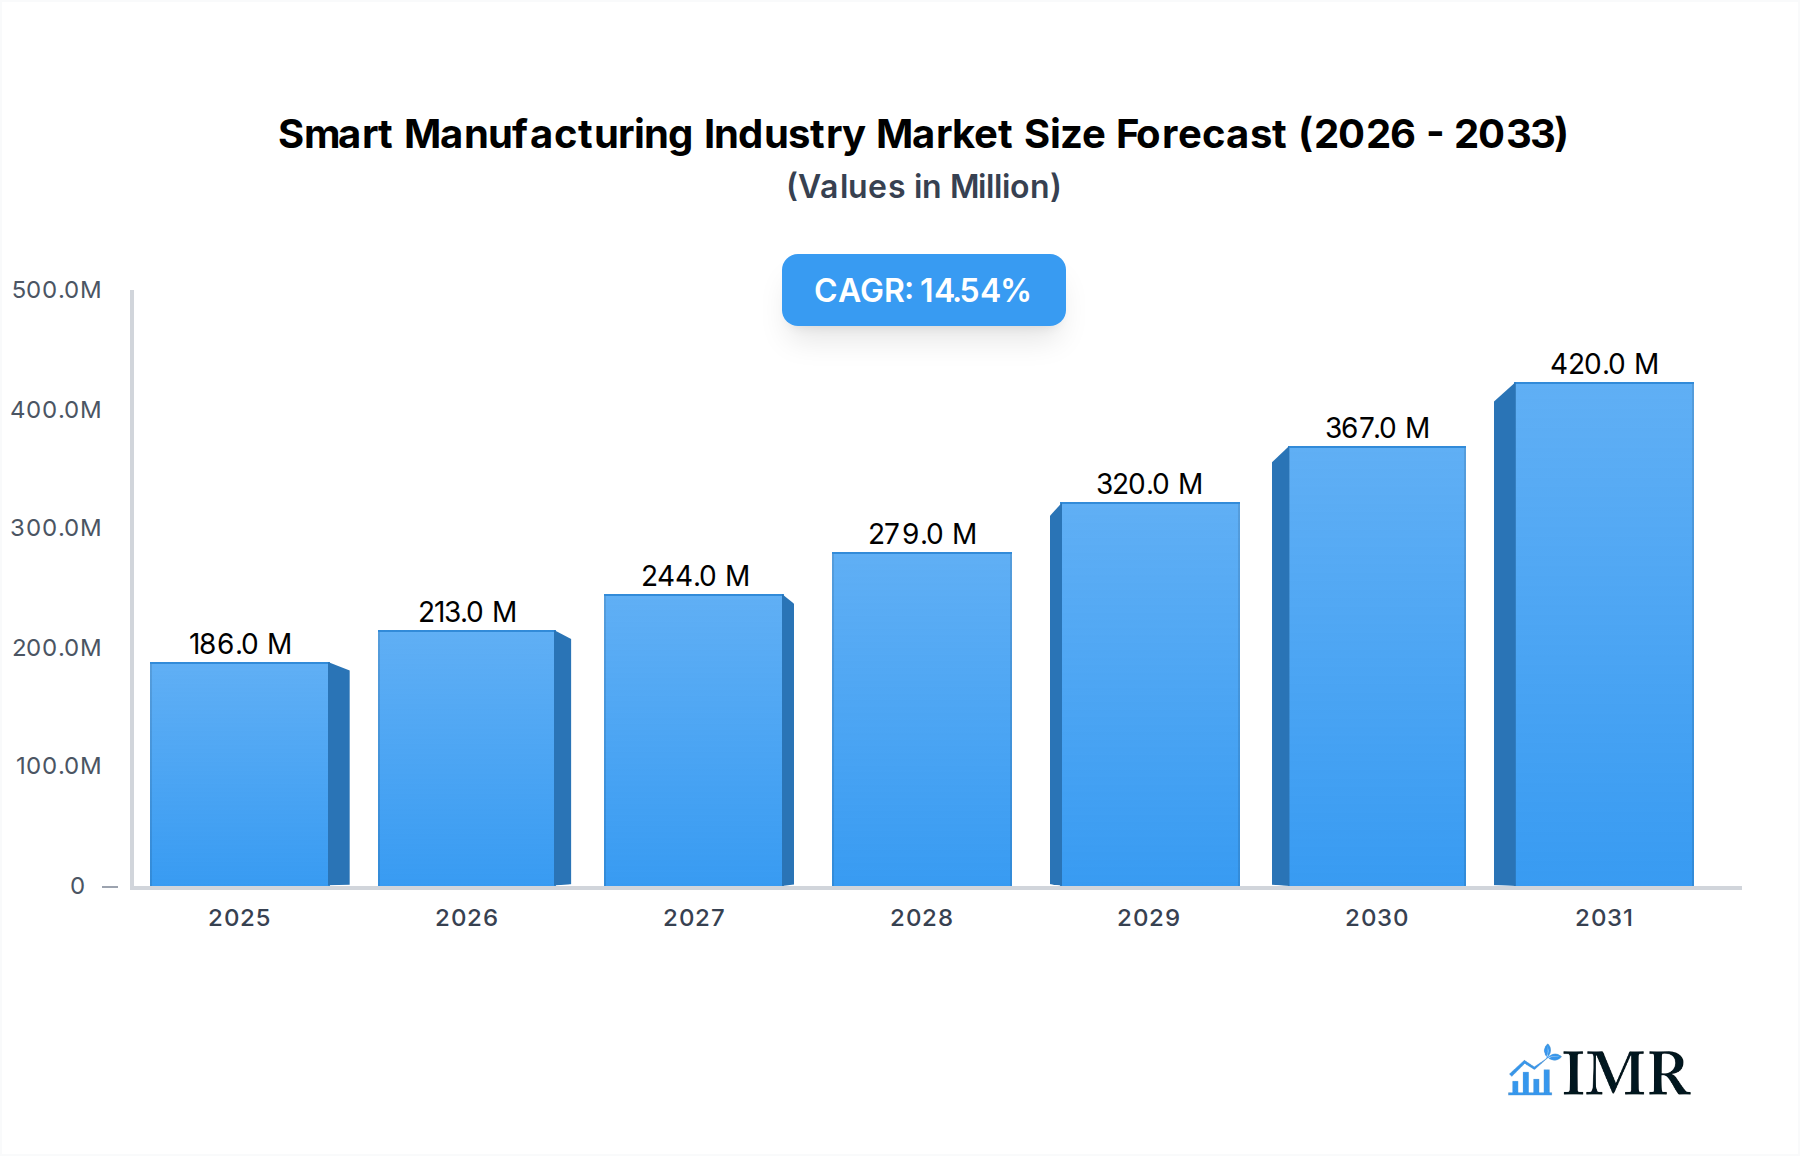
The Smart Manufacturing Industry Market is currently valued at $141.39 Million globally, poised for robust expansion with a projected Compound Annual Growth Rate (CAGR) of 14.58% over the forecast period. This growth trajectory is fundamentally driven by the escalating demand for automation, aiming to significantly enhance operational efficiency and product quality across diverse industrial sectors. The imperative for rigorous regulatory compliance, coupled with robust government support for digitization initiatives such as Industry 4.0, further catalyzes market acceleration. A pivotal macro tailwind is the pervasive proliferation of the Internet of Things (IoT), transforming traditional factory floors into interconnected, intelligent ecosystems where data flow facilitates real-time decision-making and optimization. Solutions within the Industrial Automation Market, encompassing everything from advanced control systems to sophisticated analytics platforms, are becoming indispensable.

Smart Manufacturing Industry Market Size (In Million)
However, the market's full potential is tempered by notable challenges. Foremost among these are the significant concerns regarding data security, necessitating robust Cybersecurity Market frameworks to protect sensitive operational and proprietary information. The substantial initial installation costs associated with integrating smart manufacturing technologies, alongside a persistent lack of a skilled workforce capable of managing and optimizing these advanced systems, pose considerable barriers to full-scale adoption, particularly for Small & Medium Enterprises (SMEs). Despite these hurdles, ongoing technological advancements in areas like the Industrial IoT Market and the Artificial Intelligence Market are continually lowering costs and improving accessibility, broadening the adoption base. The Automotive Manufacturing Market is highlighted as a primary growth driver, with its rigorous demands for precision, efficiency, and customized production pushing the boundaries of smart manufacturing capabilities. This necessitates sophisticated solutions, including advanced Robotics Market deployments and integrated Manufacturing Execution System Market platforms, to achieve hyper-efficient and flexible production lines. The industry’s outlook remains profoundly positive, characterized by continuous innovation and increasing convergence of operational technology (OT) and information technology (IT) to create more agile, resilient, and intelligent manufacturing environments globally." + "
Smart Manufacturing Industry Company Market Share
Discrete Manufacturing Process Segment in Smart Manufacturing Industry
Within the broader Smart Manufacturing Industry, the Discrete Manufacturing Process segment stands out as a dominant force, particularly in terms of adoption and revenue share. This segment encompasses industries characterized by the production of distinct, separate items, such as the Automotive Manufacturing Market, the Electronics Manufacturing Market, aerospace, machinery, and consumer goods. Its dominance is attributable to the inherent complexities of assembling multiple components, the stringent quality control requirements, and the persistent pressure for mass customization and rapid product cycles that define these sectors. The high volume and precision mandates in discrete manufacturing make it an ideal candidate for extensive digital transformation and automation, thereby driving significant investment in smart manufacturing solutions.
Key players in the Smart Manufacturing Industry, including Siemens AG, Rockwell Automation Inc, and Mitsubishi Electric Corporation, are heavily invested in developing sophisticated solutions tailored for discrete manufacturing. These offerings span advanced programmable logic controllers (PLCs), human-machine interfaces (HMIs), motion control systems, and enterprise-level Manufacturing Execution System Market platforms that integrate seamlessly with Enterprise Resource Planning (ERP) systems. The adoption of the Robotics Market within discrete manufacturing is exceptionally high, transforming assembly lines and logistics with increased speed, accuracy, and safety. Furthermore, the proliferation of the Industrial IoT Market plays a crucial role, connecting machines, tools, and sensors across the factory floor to generate vast quantities of data. This data, when analyzed with tools from the Artificial Intelligence Market, enables predictive maintenance, real-time quality control, and optimized production scheduling, directly addressing the core challenges of discrete manufacturers.
The Discrete Manufacturing Process segment's market share is not merely consolidating but continues to expand due to ongoing innovation and the expanding scope of what smart factories can achieve. As industries like automotive and electronics continue to push for greater efficiency, reduced waste, and faster time-to-market, their reliance on advanced smart manufacturing solutions intensifies. The demand for highly integrated and flexible production systems, capable of adapting to fluctuating market demands and producing diverse product variations, reinforces the leading position of the Discrete Manufacturing Process segment in driving the overall growth and technological evolution of the Smart Manufacturing Industry." + "
Key Market Drivers and Constraints in Smart Manufacturing Industry
The Smart Manufacturing Industry's trajectory is shaped by a confluence of powerful drivers and significant restraints. A primary driver is the increasing demand for automation to achieve efficiency and quality. Industries worldwide are under immense pressure to reduce operational costs, minimize waste, and produce goods with higher consistency and fewer defects. For instance, the implementation of advanced process controls and real-time monitoring through technologies like the Industrial IoT Market can lead to a 15-20% reduction in energy consumption and a 10-12% decrease in material waste in typical manufacturing operations. Similarly, automated quality inspection systems, leveraging high-resolution Sensor Market technology, can detect defects at a much higher rate and earlier stage than manual processes, often improving first-pass yield by 5-10%.
Another significant driver is the need for compliance and government support for digitization. Governments globally are launching initiatives like Germany's Industry 4.0, China's Made in China 2025, and various national digital transformation strategies to bolster industrial competitiveness. These programs often include financial incentives, subsidies, and regulatory frameworks that encourage manufacturers to invest in smart technologies. Such support can significantly de-risk initial investments for companies looking to adopt a Manufacturing Execution System Market or implement Robotics Market solutions.
Conversely, a major restraint is concerns regarding data security. As manufacturing processes become increasingly interconnected and reliant on data exchange, the attack surface for cyber threats expands. High-profile incidents of intellectual property theft, production disruption due to ransomware, or data breaches can erode trust and lead to substantial financial losses. Consequently, the need for robust Cybersecurity Market solutions and protocols becomes paramount, often adding complexity and cost to smart manufacturing implementations. Another significant impediment is high initial installation costs and lack of a skilled workforce. Implementing smart manufacturing systems requires substantial upfront capital expenditure for new hardware, software, and infrastructure. For many Small & Medium Enterprises (SMEs), these costs are prohibitive. Moreover, the specialized skills required to operate, maintain, and troubleshoot advanced systems, from data scientists for the Artificial Intelligence Market to automation engineers for complex robotic cells, are in short supply, creating a talent gap that delays adoption and impacts operational effectiveness." + "
Competitive Ecosystem of Smart Manufacturing Industry
The Smart Manufacturing Industry features a diverse and highly competitive landscape, characterized by both global conglomerates offering comprehensive solutions and specialized technology providers. Key players leverage their expertise in automation, software, and industrial hardware to drive innovation and capture market share:
- Honeywell International Inc: A multinational conglomerate known for its diverse portfolio, Honeywell provides advanced automation control systems, software solutions, and services for industrial processes, focusing on enhancing operational reliability and cybersecurity within smart factories.
- ABB Ltd: A leader in power grids, electrification products, industrial automation, and robotics, ABB is pivotal in equipping manufacturers with integrated solutions that optimize energy efficiency and production throughput.
- Mitsubishi Electric Corporation: Specializing in factory automation, Mitsubishi Electric offers a wide array of products including PLCs, motion controllers, and industrial robots, alongside comprehensive digital manufacturing solutions that facilitate seamless production.
- Siemens AG: A technology powerhouse, Siemens delivers a broad spectrum of digital enterprise solutions, including process automation, industrial software, and advanced analytics, enabling the digital transformation of manufacturing operations.
- Schneider Electric SE: Focused on digital transformation of energy management and automation, Schneider Electric provides integrated solutions for smart factories, emphasizing efficiency, sustainability, and connectivity through its EcoStruxure platform.
- Fanuc Corporation: A global leader in factory automation, Fanuc is renowned for its industrial robots, CNC systems, and ROBOMACHINEs, which are critical components for high-precision, automated manufacturing processes.
- Robert Bosch GmbH: Through its Industrial Technology division, Bosch offers connected industry solutions, including software platforms, Sensor Market technology, and assembly systems, supporting the development of intelligent manufacturing environments.
- Texas Instruments Incorporated: As a leading semiconductor company, Texas Instruments provides essential embedded processing and analog chips that form the backbone of industrial control systems, smart sensors, and connectivity modules used in smart manufacturing.
- Rockwell Automation Inc: Specializing in industrial automation and digital transformation, Rockwell Automation offers control systems, software, and services that help manufacturers improve productivity and sustainability across their operations.
- Yokogawa Electric Corporation: A prominent provider of industrial automation and control solutions, Yokogawa focuses on process optimization, asset management, and operational efficiency through its integrated platforms.
- General Electric Company: With its GE Digital division, General Electric offers industrial software, services, and cybersecurity solutions, including a cloud-based Manufacturing Execution System Market, to enhance asset performance and operational insights.
- Emerson Electric Company: A diversified global technology and engineering company, Emerson provides automation solutions and software for process, hybrid, and discrete industries, focusing on improving production uptime and operational excellence."
- "
Recent Developments & Milestones in Smart Manufacturing Industry
Recent strategic alliances, product enhancements, and investments underscore the rapid evolution and growing significance of the Smart Manufacturing Industry:
- December 2023: TeamViewer announced strategic investments in Sight Machine and Cybus, two pioneering companies in smart factory solutions. This initiative aims to strengthen TeamViewer's commitment to digitalizing industrial workplaces and integrating IT and OT, positioning the company as a leading provider of enterprise software linking manufacturing infrastructure, IT systems, and data analytics.
- February 2023: General Electric Company unveiled new enhancements to its cloud-based Manufacturing Execution System Market (MES). The improved software offers cost-effective and configurable Overall Equipment Effectiveness (OEE), production, and quality control capabilities for manufacturers of all sizes. This development allows discrete, process, and mixed environment manufacturers to reduce costs and maintenance while increasing security with a comprehensive cloud MES.
- July 2022: ABB and SKF entered into a Memorandum of Understanding (MoU) to explore collaboration opportunities in the automation of manufacturing processes. This partnership aims to evaluate and identify solutions that can significantly improve manufacturing capabilities and support clients in achieving increased production efficiency, particularly in the realm of advanced Industrial Automation Market solutions."
- "
Regional Market Breakdown for Smart Manufacturing Industry
The Smart Manufacturing Industry exhibits distinct regional dynamics, influenced by varying levels of industrialization, technological adoption rates, and government support. While specific regional CAGRs and revenue shares are not provided in the current data, general trends indicate significant regional contributions.
Asia Pacific is widely considered the fastest-growing region in the Smart Manufacturing Industry. Countries like China, India, and Japan are heavily investing in industrial digitization and automation, driven by large manufacturing bases, favorable government policies (e.g., Made in China 2025), and the imperative to enhance global competitiveness. The rapid expansion of the Automotive Manufacturing Market and Electronics Manufacturing Market in this region, coupled with the adoption of advanced Robotics Market and Industrial IoT Market solutions, serves as a primary demand driver. Manufacturers here are increasingly integrating Artificial Intelligence Market capabilities to optimize production and supply chain efficiencies.
North America, encompassing the United States and Canada, represents a mature yet continually expanding market. This region benefits from a robust technology infrastructure, early adoption of advanced manufacturing practices, and significant R&D investments. The focus here is on increasing productivity, supply chain resilience, and leveraging data analytics to drive operational excellence. Demand is largely fueled by the aerospace & defense, automotive, and high-tech electronics sectors, with a strong emphasis on cybersecurity measures to protect increasingly connected environments.
Europe, including industrial powerhouses like Germany, the United Kingdom, and France, is a significant contributor to the Smart Manufacturing Industry. Driven by strong Industry 4.0 initiatives and a focus on high-quality, precision engineering, European manufacturers are leading in the adoption of advanced automation, Sensor Market technologies, and sophisticated Manufacturing Execution System Market platforms. The region prioritizes sustainability and regulatory compliance, integrating smart solutions to reduce environmental impact and meet stringent production standards.
Latin America (Brazil, Mexico) and the Middle East and Africa are emerging markets. While currently smaller in market share, they are experiencing increasing adoption rates as industrialization progresses and governments push for economic diversification and modernization. The demand in these regions is primarily driven by the need to improve manufacturing capabilities, reduce reliance on manual labor, and enhance product quality to compete on a global scale. Investments in basic automation and digital infrastructure are foundational, paving the way for more sophisticated smart manufacturing deployments in the coming years." + "
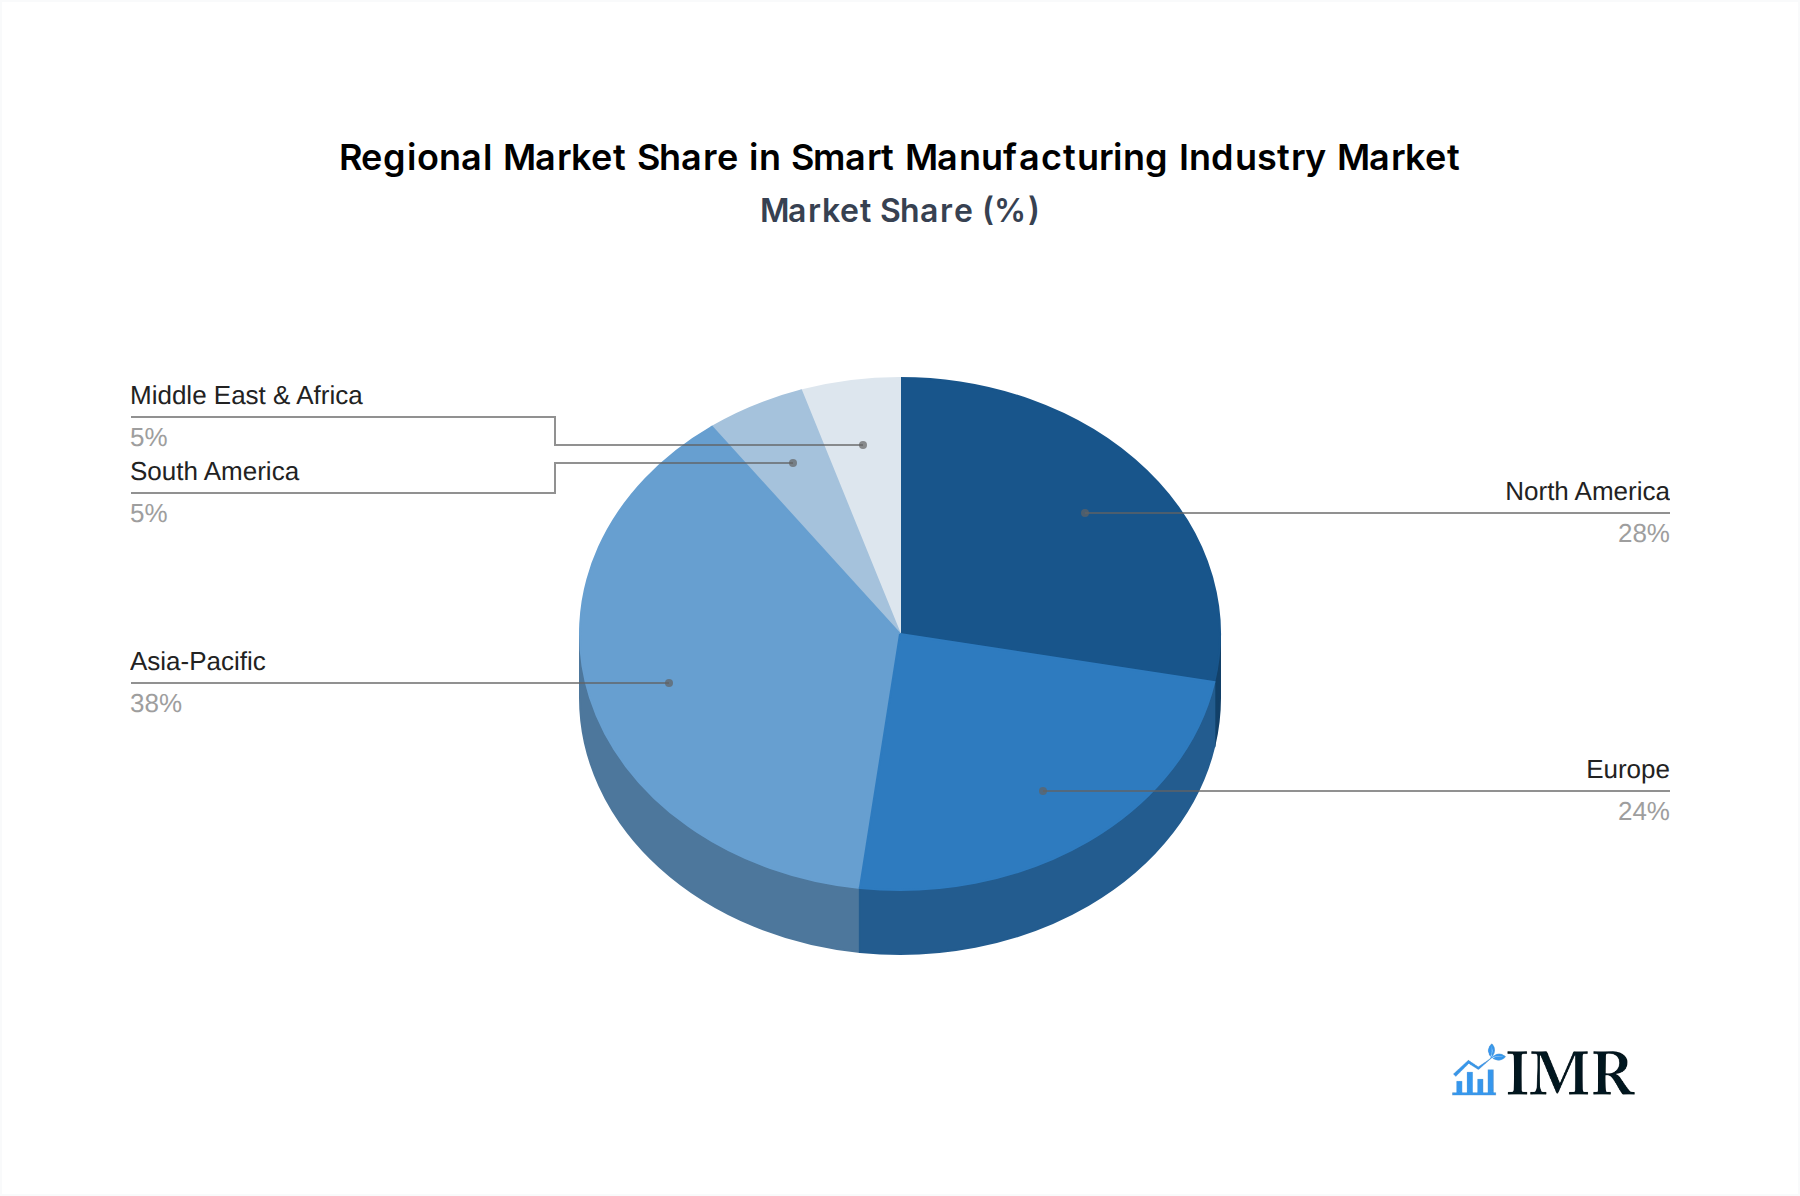
Smart Manufacturing Industry Regional Market Share
Sustainability & ESG Pressures on Smart Manufacturing Industry
Sustainability and Environmental, Social, and Governance (ESG) pressures are profoundly reshaping the Smart Manufacturing Industry. Manufacturers are increasingly facing stringent environmental regulations, ambitious carbon reduction targets, and mandates for circular economy practices. This pushes companies to rethink product development, operational processes, and procurement strategies. Smart manufacturing solutions offer a powerful lever for addressing these challenges. For instance, predictive analytics powered by the Artificial Intelligence Market can optimize energy consumption by identifying inefficiencies in machinery and processes, leading to significant reductions in carbon footprint. The adoption of Industrial IoT Market platforms allows for real-time monitoring of resource usage, enabling precise control over raw materials, water, and energy, thereby minimizing waste. Furthermore, smart factories facilitate the implementation of circular economy principles by enabling better traceability of materials, optimizing recycling processes, and designing products for easier disassembly and reuse. ESG investor criteria are also playing a crucial role, as investors increasingly favor companies demonstrating strong environmental stewardship, ethical labor practices, and transparent governance. This creates a financial incentive for manufacturers to invest in smart technologies that not only improve efficiency and profitability but also enhance their ESG profile, attracting capital and fostering long-term resilience. The push for sustainable and ethical supply chains further drives the demand for transparency and data integration across the value chain, which is inherently supported by smart manufacturing principles." + "
Customer Segmentation & Buying Behavior in Smart Manufacturing Industry
Customer segmentation in the Smart Manufacturing Industry is diverse, primarily bifurcated by enterprise size and end-user industry. Large Enterprises, particularly those in the Automotive Manufacturing Market, Electronics Manufacturing Market, and Aerospace & Defense, represent the largest segment by adoption volume and investment. Their purchasing criteria are centered on comprehensive, scalable, and highly integrated solutions that promise significant ROI through enhanced efficiency, quality, and reduced downtime. They prioritize vendor experience, proven track records, and robust global support infrastructure, often engaging directly with leading technology providers in the Industrial Automation Market for bespoke solutions.
Small & Medium Enterprises (SMEs), while a burgeoning segment, exhibit higher price sensitivity and prioritize ease of implementation, modularity, and rapid ROI. Their purchasing decisions are heavily influenced by upfront cost, the availability of user-friendly interfaces, and accessibility to local support. SMEs often favor cloud-based solutions, such as the cloud-based Manufacturing Execution System Market, to reduce infrastructure investment and leverage subscription models. They frequently procure through system integrators or value-added resellers who can provide tailored packages and implementation services.
Across both segments, key purchasing criteria include data security (given rising Cybersecurity Market threats), system interoperability with existing legacy equipment, and the ability to scale solutions as needs evolve. There's a notable shift in buying behavior towards outcome-based procurement, where manufacturers seek partners who can demonstrate tangible improvements in OEE, production yield, or cost savings, rather than just selling standalone hardware or software. The proliferation of the Industrial IoT Market has also increased the demand for platforms that offer real-time data analytics and predictive capabilities, leveraging Sensor Market data to enable proactive decision-making. Buyers are increasingly looking for integrated solutions that combine various technologies, from the Robotics Market to Artificial Intelligence Market, to achieve holistic operational transformation, moving away from siloed point solutions.
Smart Manufacturing Industry Segmentation
-
1. Component
- 1.1. Hardware
- 1.2. Software
- 1.3. Services
-
2. Manufacturing Process
- 2.1. Discrete Manufacturing
- 2.2. Process Manufacturing
- 2.3. Hybrid Manufacturing
-
3. Enterprise Size
- 3.1. Large Enterprises
- 3.2. Small & Medium Enterprises (SMEs)
-
4. End User Industry
- 4.1. Automotive
- 4.2. Electronics & Semiconductors
- 4.3. Machinery & Industrial Equipment
- 4.4. Aerospace & Defense
- 4.5. Chemicals & Petrochemicals
- 4.6. Pharmaceuticals & Biotechnology
- 4.7. Food & Beverage
- 4.8. Metals & Mining
- 4.9. Energy & Power
- 4.10. Textiles & Apparel
- 4.11. Consumer Goods
- 4.12. Others
Smart Manufacturing Industry Segmentation By Geography
-
1. North America
- 1.1. United States
- 1.2. Canada
-
2. Europe
- 2.1. Germany
- 2.2. United Kingdom
- 2.3. France
- 2.4. Rest of Europe
-
3. Asia Pacific
- 3.1. China
- 3.2. India
- 3.3. Japan
- 3.4. Rest of Asia Pacific
-
4. Latin America
- 4.1. Brazil
- 4.2. Mexico
- 4.3. Rest of Latin America
- 5. Middle East and Africa
Smart Manufacturing Industry Regional Market Share
Geographic Coverage of Smart Manufacturing Industry
Smart Manufacturing Industry REPORT HIGHLIGHTS
| Aspects | Details |
|---|---|
| Study Period | 2020-2034 |
| Base Year | 2025 |
| Estimated Year | 2026 |
| Forecast Period | 2026-2034 |
| Historical Period | 2020-2025 |
| Growth Rate | CAGR of 14.58% from 2020-2034 |
| Segmentation |
|
Table of Contents
- 1. Introduction
- 1.1. Research Scope
- 1.2. Market Segmentation
- 1.3. Research Objective
- 1.4. Definitions and Assumptions
- 2. Executive Summary
- 2.1. Market Snapshot
- 3. Market Dynamics
- 3.1. Market Drivers
- 3.2. Market Restrains
- 3.3. Market Trends
- 3.4. Market Opportunities
- 4. Market Factor Analysis
- 4.1. Porters Five Forces
- 4.1.1. Bargaining Power of Suppliers
- 4.1.2. Bargaining Power of Buyers
- 4.1.3. Threat of New Entrants
- 4.1.4. Threat of Substitutes
- 4.1.5. Competitive Rivalry
- 4.2. PESTEL analysis
- 4.3. BCG Analysis
- 4.3.1. Stars (High Growth, High Market Share)
- 4.3.2. Cash Cows (Low Growth, High Market Share)
- 4.3.3. Question Mark (High Growth, Low Market Share)
- 4.3.4. Dogs (Low Growth, Low Market Share)
- 4.4. Ansoff Matrix Analysis
- 4.5. Supply Chain Analysis
- 4.6. Regulatory Landscape
- 4.7. Current Market Potential and Opportunity Assessment (TAM–SAM–SOM Framework)
- 4.8. IMR Analyst Note
- 4.1. Porters Five Forces
- 5. Market Analysis, Insights and Forecast 2021-2033
- 5.1. Market Analysis, Insights and Forecast - by Component
- 5.1.1. Hardware
- 5.1.2. Software
- 5.1.3. Services
- 5.2. Market Analysis, Insights and Forecast - by Manufacturing Process
- 5.2.1. Discrete Manufacturing
- 5.2.2. Process Manufacturing
- 5.2.3. Hybrid Manufacturing
- 5.3. Market Analysis, Insights and Forecast - by Enterprise Size
- 5.3.1. Large Enterprises
- 5.3.2. Small & Medium Enterprises (SMEs)
- 5.4. Market Analysis, Insights and Forecast - by End User Industry
- 5.4.1. Automotive
- 5.4.2. Electronics & Semiconductors
- 5.4.3. Machinery & Industrial Equipment
- 5.4.4. Aerospace & Defense
- 5.4.5. Chemicals & Petrochemicals
- 5.4.6. Pharmaceuticals & Biotechnology
- 5.4.7. Food & Beverage
- 5.4.8. Metals & Mining
- 5.4.9. Energy & Power
- 5.4.10. Textiles & Apparel
- 5.4.11. Consumer Goods
- 5.4.12. Others
- 5.5. Market Analysis, Insights and Forecast - by Region
- 5.5.1. North America
- 5.5.2. Europe
- 5.5.3. Asia Pacific
- 5.5.4. Latin America
- 5.5.5. Middle East and Africa
- 5.1. Market Analysis, Insights and Forecast - by Component
- 6. Global Smart Manufacturing Industry Analysis, Insights and Forecast, 2021-2033
- 6.1. Market Analysis, Insights and Forecast - by Component
- 6.1.1. Hardware
- 6.1.2. Software
- 6.1.3. Services
- 6.2. Market Analysis, Insights and Forecast - by Manufacturing Process
- 6.2.1. Discrete Manufacturing
- 6.2.2. Process Manufacturing
- 6.2.3. Hybrid Manufacturing
- 6.3. Market Analysis, Insights and Forecast - by Enterprise Size
- 6.3.1. Large Enterprises
- 6.3.2. Small & Medium Enterprises (SMEs)
- 6.4. Market Analysis, Insights and Forecast - by End User Industry
- 6.4.1. Automotive
- 6.4.2. Electronics & Semiconductors
- 6.4.3. Machinery & Industrial Equipment
- 6.4.4. Aerospace & Defense
- 6.4.5. Chemicals & Petrochemicals
- 6.4.6. Pharmaceuticals & Biotechnology
- 6.4.7. Food & Beverage
- 6.4.8. Metals & Mining
- 6.4.9. Energy & Power
- 6.4.10. Textiles & Apparel
- 6.4.11. Consumer Goods
- 6.4.12. Others
- 6.1. Market Analysis, Insights and Forecast - by Component
- 7. North America Smart Manufacturing Industry Analysis, Insights and Forecast, 2020-2032
- 7.1. Market Analysis, Insights and Forecast - by Component
- 7.1.1. Hardware
- 7.1.2. Software
- 7.1.3. Services
- 7.2. Market Analysis, Insights and Forecast - by Manufacturing Process
- 7.2.1. Discrete Manufacturing
- 7.2.2. Process Manufacturing
- 7.2.3. Hybrid Manufacturing
- 7.3. Market Analysis, Insights and Forecast - by Enterprise Size
- 7.3.1. Large Enterprises
- 7.3.2. Small & Medium Enterprises (SMEs)
- 7.4. Market Analysis, Insights and Forecast - by End User Industry
- 7.4.1. Automotive
- 7.4.2. Electronics & Semiconductors
- 7.4.3. Machinery & Industrial Equipment
- 7.4.4. Aerospace & Defense
- 7.4.5. Chemicals & Petrochemicals
- 7.4.6. Pharmaceuticals & Biotechnology
- 7.4.7. Food & Beverage
- 7.4.8. Metals & Mining
- 7.4.9. Energy & Power
- 7.4.10. Textiles & Apparel
- 7.4.11. Consumer Goods
- 7.4.12. Others
- 7.1. Market Analysis, Insights and Forecast - by Component
- 8. Europe Smart Manufacturing Industry Analysis, Insights and Forecast, 2020-2032
- 8.1. Market Analysis, Insights and Forecast - by Component
- 8.1.1. Hardware
- 8.1.2. Software
- 8.1.3. Services
- 8.2. Market Analysis, Insights and Forecast - by Manufacturing Process
- 8.2.1. Discrete Manufacturing
- 8.2.2. Process Manufacturing
- 8.2.3. Hybrid Manufacturing
- 8.3. Market Analysis, Insights and Forecast - by Enterprise Size
- 8.3.1. Large Enterprises
- 8.3.2. Small & Medium Enterprises (SMEs)
- 8.4. Market Analysis, Insights and Forecast - by End User Industry
- 8.4.1. Automotive
- 8.4.2. Electronics & Semiconductors
- 8.4.3. Machinery & Industrial Equipment
- 8.4.4. Aerospace & Defense
- 8.4.5. Chemicals & Petrochemicals
- 8.4.6. Pharmaceuticals & Biotechnology
- 8.4.7. Food & Beverage
- 8.4.8. Metals & Mining
- 8.4.9. Energy & Power
- 8.4.10. Textiles & Apparel
- 8.4.11. Consumer Goods
- 8.4.12. Others
- 8.1. Market Analysis, Insights and Forecast - by Component
- 9. Asia Pacific Smart Manufacturing Industry Analysis, Insights and Forecast, 2020-2032
- 9.1. Market Analysis, Insights and Forecast - by Component
- 9.1.1. Hardware
- 9.1.2. Software
- 9.1.3. Services
- 9.2. Market Analysis, Insights and Forecast - by Manufacturing Process
- 9.2.1. Discrete Manufacturing
- 9.2.2. Process Manufacturing
- 9.2.3. Hybrid Manufacturing
- 9.3. Market Analysis, Insights and Forecast - by Enterprise Size
- 9.3.1. Large Enterprises
- 9.3.2. Small & Medium Enterprises (SMEs)
- 9.4. Market Analysis, Insights and Forecast - by End User Industry
- 9.4.1. Automotive
- 9.4.2. Electronics & Semiconductors
- 9.4.3. Machinery & Industrial Equipment
- 9.4.4. Aerospace & Defense
- 9.4.5. Chemicals & Petrochemicals
- 9.4.6. Pharmaceuticals & Biotechnology
- 9.4.7. Food & Beverage
- 9.4.8. Metals & Mining
- 9.4.9. Energy & Power
- 9.4.10. Textiles & Apparel
- 9.4.11. Consumer Goods
- 9.4.12. Others
- 9.1. Market Analysis, Insights and Forecast - by Component
- 10. Latin America Smart Manufacturing Industry Analysis, Insights and Forecast, 2020-2032
- 10.1. Market Analysis, Insights and Forecast - by Component
- 10.1.1. Hardware
- 10.1.2. Software
- 10.1.3. Services
- 10.2. Market Analysis, Insights and Forecast - by Manufacturing Process
- 10.2.1. Discrete Manufacturing
- 10.2.2. Process Manufacturing
- 10.2.3. Hybrid Manufacturing
- 10.3. Market Analysis, Insights and Forecast - by Enterprise Size
- 10.3.1. Large Enterprises
- 10.3.2. Small & Medium Enterprises (SMEs)
- 10.4. Market Analysis, Insights and Forecast - by End User Industry
- 10.4.1. Automotive
- 10.4.2. Electronics & Semiconductors
- 10.4.3. Machinery & Industrial Equipment
- 10.4.4. Aerospace & Defense
- 10.4.5. Chemicals & Petrochemicals
- 10.4.6. Pharmaceuticals & Biotechnology
- 10.4.7. Food & Beverage
- 10.4.8. Metals & Mining
- 10.4.9. Energy & Power
- 10.4.10. Textiles & Apparel
- 10.4.11. Consumer Goods
- 10.4.12. Others
- 10.1. Market Analysis, Insights and Forecast - by Component
- 11. Middle East and Africa Smart Manufacturing Industry Analysis, Insights and Forecast, 2020-2032
- 11.1. Market Analysis, Insights and Forecast - by Component
- 11.1.1. Hardware
- 11.1.2. Software
- 11.1.3. Services
- 11.2. Market Analysis, Insights and Forecast - by Manufacturing Process
- 11.2.1. Discrete Manufacturing
- 11.2.2. Process Manufacturing
- 11.2.3. Hybrid Manufacturing
- 11.3. Market Analysis, Insights and Forecast - by Enterprise Size
- 11.3.1. Large Enterprises
- 11.3.2. Small & Medium Enterprises (SMEs)
- 11.4. Market Analysis, Insights and Forecast - by End User Industry
- 11.4.1. Automotive
- 11.4.2. Electronics & Semiconductors
- 11.4.3. Machinery & Industrial Equipment
- 11.4.4. Aerospace & Defense
- 11.4.5. Chemicals & Petrochemicals
- 11.4.6. Pharmaceuticals & Biotechnology
- 11.4.7. Food & Beverage
- 11.4.8. Metals & Mining
- 11.4.9. Energy & Power
- 11.4.10. Textiles & Apparel
- 11.4.11. Consumer Goods
- 11.4.12. Others
- 11.1. Market Analysis, Insights and Forecast - by Component
- 12. Competitive Analysis
- 12.1. Company Profiles
- 12.1.1 Honeywell International Inc
- 12.1.1.1. Company Overview
- 12.1.1.2. Products
- 12.1.1.3. Company Financials
- 12.1.1.4. SWOT Analysis
- 12.1.2 ABB Ltd
- 12.1.2.1. Company Overview
- 12.1.2.2. Products
- 12.1.2.3. Company Financials
- 12.1.2.4. SWOT Analysis
- 12.1.3 Mitsubishi Electric Corporation
- 12.1.3.1. Company Overview
- 12.1.3.2. Products
- 12.1.3.3. Company Financials
- 12.1.3.4. SWOT Analysis
- 12.1.4 Siemens AG
- 12.1.4.1. Company Overview
- 12.1.4.2. Products
- 12.1.4.3. Company Financials
- 12.1.4.4. SWOT Analysis
- 12.1.5 Schneider Electric SE
- 12.1.5.1. Company Overview
- 12.1.5.2. Products
- 12.1.5.3. Company Financials
- 12.1.5.4. SWOT Analysis
- 12.1.6 Fanuc Corporation
- 12.1.6.1. Company Overview
- 12.1.6.2. Products
- 12.1.6.3. Company Financials
- 12.1.6.4. SWOT Analysis
- 12.1.7 Robert Bosch GmbH
- 12.1.7.1. Company Overview
- 12.1.7.2. Products
- 12.1.7.3. Company Financials
- 12.1.7.4. SWOT Analysis
- 12.1.8 Texas Instruments Incorporated
- 12.1.8.1. Company Overview
- 12.1.8.2. Products
- 12.1.8.3. Company Financials
- 12.1.8.4. SWOT Analysis
- 12.1.9 Rockwell Automation Inc
- 12.1.9.1. Company Overview
- 12.1.9.2. Products
- 12.1.9.3. Company Financials
- 12.1.9.4. SWOT Analysis
- 12.1.10 Yokogawa Electric Corporation
- 12.1.10.1. Company Overview
- 12.1.10.2. Products
- 12.1.10.3. Company Financials
- 12.1.10.4. SWOT Analysis
- 12.1.11 General Electric Company
- 12.1.11.1. Company Overview
- 12.1.11.2. Products
- 12.1.11.3. Company Financials
- 12.1.11.4. SWOT Analysis
- 12.1.12 Emerson Electric Company
- 12.1.12.1. Company Overview
- 12.1.12.2. Products
- 12.1.12.3. Company Financials
- 12.1.12.4. SWOT Analysis
- 12.1.1 Honeywell International Inc
- 12.2. Market Entropy
- 12.2.1 Company's Key Areas Served
- 12.2.2 Recent Developments
- 12.3. Company Market Share Analysis 2025
- 12.3.1 Top 5 Companies Market Share Analysis
- 12.3.2 Top 3 Companies Market Share Analysis
- 12.4. List of Potential Customers
- 13. Research Methodology
List of Figures
- Figure 1: Global Smart Manufacturing Industry Revenue Breakdown (Million, %) by Region 2025 & 2033
- Figure 2: North America Smart Manufacturing Industry Revenue (Million), by Component 2025 & 2033
- Figure 3: North America Smart Manufacturing Industry Revenue Share (%), by Component 2025 & 2033
- Figure 4: North America Smart Manufacturing Industry Revenue (Million), by Manufacturing Process 2025 & 2033
- Figure 5: North America Smart Manufacturing Industry Revenue Share (%), by Manufacturing Process 2025 & 2033
- Figure 6: North America Smart Manufacturing Industry Revenue (Million), by Enterprise Size 2025 & 2033
- Figure 7: North America Smart Manufacturing Industry Revenue Share (%), by Enterprise Size 2025 & 2033
- Figure 8: North America Smart Manufacturing Industry Revenue (Million), by End User Industry 2025 & 2033
- Figure 9: North America Smart Manufacturing Industry Revenue Share (%), by End User Industry 2025 & 2033
- Figure 10: North America Smart Manufacturing Industry Revenue (Million), by Country 2025 & 2033
- Figure 11: North America Smart Manufacturing Industry Revenue Share (%), by Country 2025 & 2033
- Figure 12: Europe Smart Manufacturing Industry Revenue (Million), by Component 2025 & 2033
- Figure 13: Europe Smart Manufacturing Industry Revenue Share (%), by Component 2025 & 2033
- Figure 14: Europe Smart Manufacturing Industry Revenue (Million), by Manufacturing Process 2025 & 2033
- Figure 15: Europe Smart Manufacturing Industry Revenue Share (%), by Manufacturing Process 2025 & 2033
- Figure 16: Europe Smart Manufacturing Industry Revenue (Million), by Enterprise Size 2025 & 2033
- Figure 17: Europe Smart Manufacturing Industry Revenue Share (%), by Enterprise Size 2025 & 2033
- Figure 18: Europe Smart Manufacturing Industry Revenue (Million), by End User Industry 2025 & 2033
- Figure 19: Europe Smart Manufacturing Industry Revenue Share (%), by End User Industry 2025 & 2033
- Figure 20: Europe Smart Manufacturing Industry Revenue (Million), by Country 2025 & 2033
- Figure 21: Europe Smart Manufacturing Industry Revenue Share (%), by Country 2025 & 2033
- Figure 22: Asia Pacific Smart Manufacturing Industry Revenue (Million), by Component 2025 & 2033
- Figure 23: Asia Pacific Smart Manufacturing Industry Revenue Share (%), by Component 2025 & 2033
- Figure 24: Asia Pacific Smart Manufacturing Industry Revenue (Million), by Manufacturing Process 2025 & 2033
- Figure 25: Asia Pacific Smart Manufacturing Industry Revenue Share (%), by Manufacturing Process 2025 & 2033
- Figure 26: Asia Pacific Smart Manufacturing Industry Revenue (Million), by Enterprise Size 2025 & 2033
- Figure 27: Asia Pacific Smart Manufacturing Industry Revenue Share (%), by Enterprise Size 2025 & 2033
- Figure 28: Asia Pacific Smart Manufacturing Industry Revenue (Million), by End User Industry 2025 & 2033
- Figure 29: Asia Pacific Smart Manufacturing Industry Revenue Share (%), by End User Industry 2025 & 2033
- Figure 30: Asia Pacific Smart Manufacturing Industry Revenue (Million), by Country 2025 & 2033
- Figure 31: Asia Pacific Smart Manufacturing Industry Revenue Share (%), by Country 2025 & 2033
- Figure 32: Latin America Smart Manufacturing Industry Revenue (Million), by Component 2025 & 2033
- Figure 33: Latin America Smart Manufacturing Industry Revenue Share (%), by Component 2025 & 2033
- Figure 34: Latin America Smart Manufacturing Industry Revenue (Million), by Manufacturing Process 2025 & 2033
- Figure 35: Latin America Smart Manufacturing Industry Revenue Share (%), by Manufacturing Process 2025 & 2033
- Figure 36: Latin America Smart Manufacturing Industry Revenue (Million), by Enterprise Size 2025 & 2033
- Figure 37: Latin America Smart Manufacturing Industry Revenue Share (%), by Enterprise Size 2025 & 2033
- Figure 38: Latin America Smart Manufacturing Industry Revenue (Million), by End User Industry 2025 & 2033
- Figure 39: Latin America Smart Manufacturing Industry Revenue Share (%), by End User Industry 2025 & 2033
- Figure 40: Latin America Smart Manufacturing Industry Revenue (Million), by Country 2025 & 2033
- Figure 41: Latin America Smart Manufacturing Industry Revenue Share (%), by Country 2025 & 2033
- Figure 42: Middle East and Africa Smart Manufacturing Industry Revenue (Million), by Component 2025 & 2033
- Figure 43: Middle East and Africa Smart Manufacturing Industry Revenue Share (%), by Component 2025 & 2033
- Figure 44: Middle East and Africa Smart Manufacturing Industry Revenue (Million), by Manufacturing Process 2025 & 2033
- Figure 45: Middle East and Africa Smart Manufacturing Industry Revenue Share (%), by Manufacturing Process 2025 & 2033
- Figure 46: Middle East and Africa Smart Manufacturing Industry Revenue (Million), by Enterprise Size 2025 & 2033
- Figure 47: Middle East and Africa Smart Manufacturing Industry Revenue Share (%), by Enterprise Size 2025 & 2033
- Figure 48: Middle East and Africa Smart Manufacturing Industry Revenue (Million), by End User Industry 2025 & 2033
- Figure 49: Middle East and Africa Smart Manufacturing Industry Revenue Share (%), by End User Industry 2025 & 2033
- Figure 50: Middle East and Africa Smart Manufacturing Industry Revenue (Million), by Country 2025 & 2033
- Figure 51: Middle East and Africa Smart Manufacturing Industry Revenue Share (%), by Country 2025 & 2033
List of Tables
- Table 1: Global Smart Manufacturing Industry Revenue Million Forecast, by Component 2020 & 2033
- Table 2: Global Smart Manufacturing Industry Revenue Million Forecast, by Manufacturing Process 2020 & 2033
- Table 3: Global Smart Manufacturing Industry Revenue Million Forecast, by Enterprise Size 2020 & 2033
- Table 4: Global Smart Manufacturing Industry Revenue Million Forecast, by End User Industry 2020 & 2033
- Table 5: Global Smart Manufacturing Industry Revenue Million Forecast, by Region 2020 & 2033
- Table 6: Global Smart Manufacturing Industry Revenue Million Forecast, by Component 2020 & 2033
- Table 7: Global Smart Manufacturing Industry Revenue Million Forecast, by Manufacturing Process 2020 & 2033
- Table 8: Global Smart Manufacturing Industry Revenue Million Forecast, by Enterprise Size 2020 & 2033
- Table 9: Global Smart Manufacturing Industry Revenue Million Forecast, by End User Industry 2020 & 2033
- Table 10: Global Smart Manufacturing Industry Revenue Million Forecast, by Country 2020 & 2033
- Table 11: United States Smart Manufacturing Industry Revenue (Million) Forecast, by Application 2020 & 2033
- Table 12: Canada Smart Manufacturing Industry Revenue (Million) Forecast, by Application 2020 & 2033
- Table 13: Global Smart Manufacturing Industry Revenue Million Forecast, by Component 2020 & 2033
- Table 14: Global Smart Manufacturing Industry Revenue Million Forecast, by Manufacturing Process 2020 & 2033
- Table 15: Global Smart Manufacturing Industry Revenue Million Forecast, by Enterprise Size 2020 & 2033
- Table 16: Global Smart Manufacturing Industry Revenue Million Forecast, by End User Industry 2020 & 2033
- Table 17: Global Smart Manufacturing Industry Revenue Million Forecast, by Country 2020 & 2033
- Table 18: Germany Smart Manufacturing Industry Revenue (Million) Forecast, by Application 2020 & 2033
- Table 19: United Kingdom Smart Manufacturing Industry Revenue (Million) Forecast, by Application 2020 & 2033
- Table 20: France Smart Manufacturing Industry Revenue (Million) Forecast, by Application 2020 & 2033
- Table 21: Rest of Europe Smart Manufacturing Industry Revenue (Million) Forecast, by Application 2020 & 2033
- Table 22: Global Smart Manufacturing Industry Revenue Million Forecast, by Component 2020 & 2033
- Table 23: Global Smart Manufacturing Industry Revenue Million Forecast, by Manufacturing Process 2020 & 2033
- Table 24: Global Smart Manufacturing Industry Revenue Million Forecast, by Enterprise Size 2020 & 2033
- Table 25: Global Smart Manufacturing Industry Revenue Million Forecast, by End User Industry 2020 & 2033
- Table 26: Global Smart Manufacturing Industry Revenue Million Forecast, by Country 2020 & 2033
- Table 27: China Smart Manufacturing Industry Revenue (Million) Forecast, by Application 2020 & 2033
- Table 28: India Smart Manufacturing Industry Revenue (Million) Forecast, by Application 2020 & 2033
- Table 29: Japan Smart Manufacturing Industry Revenue (Million) Forecast, by Application 2020 & 2033
- Table 30: Rest of Asia Pacific Smart Manufacturing Industry Revenue (Million) Forecast, by Application 2020 & 2033
- Table 31: Global Smart Manufacturing Industry Revenue Million Forecast, by Component 2020 & 2033
- Table 32: Global Smart Manufacturing Industry Revenue Million Forecast, by Manufacturing Process 2020 & 2033
- Table 33: Global Smart Manufacturing Industry Revenue Million Forecast, by Enterprise Size 2020 & 2033
- Table 34: Global Smart Manufacturing Industry Revenue Million Forecast, by End User Industry 2020 & 2033
- Table 35: Global Smart Manufacturing Industry Revenue Million Forecast, by Country 2020 & 2033
- Table 36: Brazil Smart Manufacturing Industry Revenue (Million) Forecast, by Application 2020 & 2033
- Table 37: Mexico Smart Manufacturing Industry Revenue (Million) Forecast, by Application 2020 & 2033
- Table 38: Rest of Latin America Smart Manufacturing Industry Revenue (Million) Forecast, by Application 2020 & 2033
- Table 39: Global Smart Manufacturing Industry Revenue Million Forecast, by Component 2020 & 2033
- Table 40: Global Smart Manufacturing Industry Revenue Million Forecast, by Manufacturing Process 2020 & 2033
- Table 41: Global Smart Manufacturing Industry Revenue Million Forecast, by Enterprise Size 2020 & 2033
- Table 42: Global Smart Manufacturing Industry Revenue Million Forecast, by End User Industry 2020 & 2033
- Table 43: Global Smart Manufacturing Industry Revenue Million Forecast, by Country 2020 & 2033
Frequently Asked Questions
1. What is the projected Compound Annual Growth Rate (CAGR) of the Smart Manufacturing Industry?
The projected CAGR is approximately 14.58%.
2. Which companies are prominent players in the Smart Manufacturing Industry?
Key companies in the market include Honeywell International Inc, ABB Ltd, Mitsubishi Electric Corporation, Siemens AG, Schneider Electric SE, Fanuc Corporation, Robert Bosch GmbH, Texas Instruments Incorporated, Rockwell Automation Inc, Yokogawa Electric Corporation, General Electric Company, Emerson Electric Company.
3. What are the main segments of the Smart Manufacturing Industry?
The market segments include Component, Manufacturing Process, Enterprise Size, End User Industry.
4. Can you provide details about the market size?
The market size is estimated to be USD 141.39 Million as of 2022.
5. What are some drivers contributing to market growth?
Increasing Demand for Automation to Achieve Efficiency and Quality; Need for Compliance and Government Support for Digitization; Proliferation of Internet of Things.
6. What are the notable trends driving market growth?
Automotive Industry is Expected to Drive the Market Growth.
7. Are there any restraints impacting market growth?
Concerns Regarding Data Security; High Initial Installation Costs and Lack of Skilled Workforce Preventing Enterprises from Full-scale Adoption.
8. Can you provide examples of recent developments in the market?
Dec 2023: TeamViewer announced strategic investments in two pioneering companies for smart factory solutions: Sight Machine and Cybus. This initiative strengthens TeamViewer's dedication to digitalizing industrial workplaces and merging IT & OT. Also, these investments pave the way for TeamViewer to become a top provider of enterprise software, linking manufacturing infrastructure, IT systems, and data analytics.
9. What pricing options are available for accessing the report?
Pricing options include single-user, multi-user, and enterprise licenses priced at USD 4750, USD 5250, and USD 8750 respectively.
10. Is the market size provided in terms of value or volume?
The market size is provided in terms of value, measured in Million.
11. Are there any specific market keywords associated with the report?
Yes, the market keyword associated with the report is "Smart Manufacturing Industry," which aids in identifying and referencing the specific market segment covered.
12. How do I determine which pricing option suits my needs best?
The pricing options vary based on user requirements and access needs. Individual users may opt for single-user licenses, while businesses requiring broader access may choose multi-user or enterprise licenses for cost-effective access to the report.
13. Are there any additional resources or data provided in the Smart Manufacturing Industry report?
While the report offers comprehensive insights, it's advisable to review the specific contents or supplementary materials provided to ascertain if additional resources or data are available.
14. How can I stay updated on further developments or reports in the Smart Manufacturing Industry?
To stay informed about further developments, trends, and reports in the Smart Manufacturing Industry, consider subscribing to industry newsletters, following relevant companies and organizations, or regularly checking reputable industry news sources and publications.
Methodology
Step 1 - Identification of Relevant Samples Size from Population Database


Step 2 - Approaches for Defining Global Market Size (Value, Volume* & Price*)

Note*: In applicable scenarios
Step 3 - Data Sources
Primary Research
- Web Analytics
- Survey Reports
- Research Institute
- Latest Research Reports
- Opinion Leaders
Secondary Research
- Annual Reports
- White Paper
- Latest Press Release
- Industry Association
- Paid Database
- Investor Presentations

Step 4 - Data Triangulation
Involves using different sources of information in order to increase the validity of a study
These sources are likely to be stakeholders in a program - participants, other researchers, program staff, other community members, and so on.
Then we put all data in single framework & apply various statistical tools to find out the dynamic on the market.
During the analysis stage, feedback from the stakeholder groups would be compared to determine areas of agreement as well as areas of divergence