

Key Insights
The global sports analytics platform market is experiencing robust growth, driven by the increasing adoption of data-driven strategies by sports teams, leagues, and organizations to enhance performance, improve decision-making, and create engaging fan experiences. The market's expansion is fueled by several key factors: the rising availability of sophisticated data capture technologies (wearables, video analytics), advancements in artificial intelligence (AI) and machine learning (ML) algorithms for data analysis, and a growing understanding of the value of data-driven insights for competitive advantage. Major players like IBM, SAP, and SAS Institute are leading the market, offering comprehensive solutions encompassing data collection, analysis, visualization, and predictive modeling. The market segmentation is likely diverse, including solutions tailored for specific sports (e.g., baseball, basketball, football), team levels (professional, collegiate), and specific analytical needs (performance analysis, scouting, fan engagement). We project a significant increase in market value over the next decade, with specific segments, such as AI-powered predictive analytics, experiencing even faster growth.
The competitive landscape is dynamic, with established technology giants alongside specialized sports analytics companies vying for market share. Strategic partnerships, acquisitions, and the development of innovative analytics capabilities are key competitive strategies. While the high cost of implementation and the need for specialized expertise pose some challenges to broader adoption, the demonstrable return on investment (ROI) in terms of improved performance and enhanced fan engagement is overcoming these barriers. Future growth will be significantly influenced by the increasing affordability of advanced analytics technologies, the integration of data from multiple sources, and the development of more user-friendly interfaces for accessing and interpreting complex data. The market’s trajectory suggests a continued upward trend, making it an attractive sector for investment and innovation.
Sports Analytic Platform Market Report: 2019-2033
This comprehensive report provides an in-depth analysis of the global Sports Analytic Platform market, offering invaluable insights for industry professionals, investors, and strategic decision-makers. The study covers the period 2019-2033, with a base year of 2025 and a forecast period of 2025-2033. The market is segmented by parent market (Sports Technology) and child markets (Performance Analysis, Team Management, Scouting, Fan Engagement). The report’s detailed analysis and precise market sizing (in millions of units) are crucial for understanding the current landscape and future trajectory of this rapidly evolving sector.
Sports Analytic Platform Market Dynamics & Structure
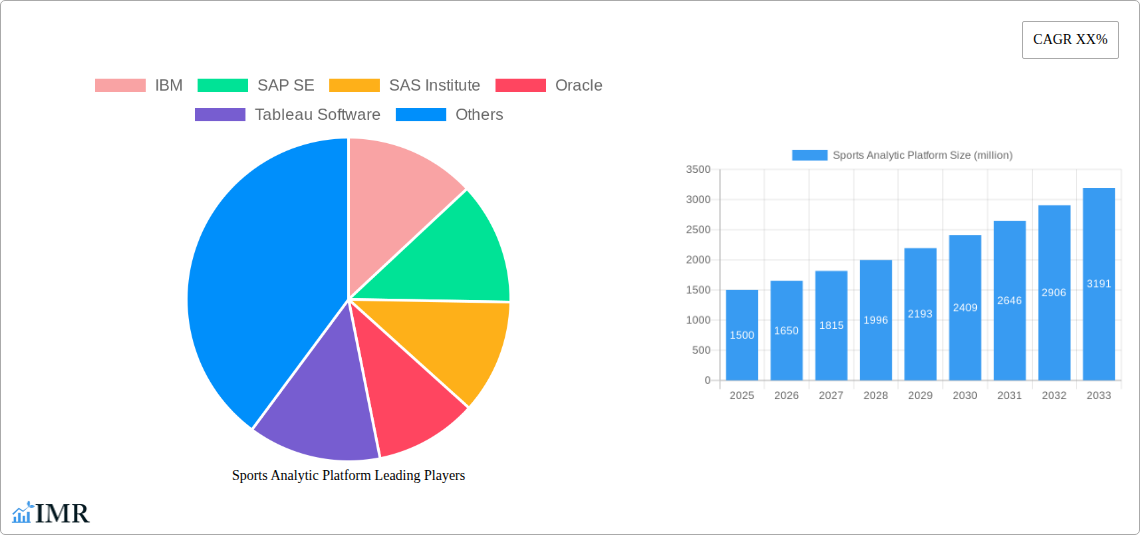
The global Sports Analytic Platform market, valued at $xx million in 2025, is experiencing significant growth driven by technological advancements and increasing adoption across various sports. Market concentration is moderate, with key players like IBM, SAP SE, and SAS Institute holding significant shares, but a competitive landscape exists with numerous specialized providers. The market structure is characterized by a mix of established technology giants and niche players catering to specific sports and analytical needs.
- Market Concentration: Moderate, with top 5 players holding approximately xx% market share in 2025.
- Technological Innovation Drivers: AI, Machine Learning, Big Data analytics, IoT sensor integration.
- Regulatory Frameworks: Vary by region and sport, impacting data privacy and usage.
- Competitive Product Substitutes: Limited direct substitutes, but competition arises from general-purpose data analytics platforms.
- End-User Demographics: Professional sports teams, leagues, federations, broadcasters, individual athletes, and sports science institutions.
- M&A Trends: A moderate number of M&A deals (xx) were observed during 2019-2024, mainly focused on consolidating technologies and expanding market reach. The forecast for 2025-2033 anticipates a similar trend, but with an increase in deals focusing on specialized AI and Machine Learning capabilities.
Sports Analytic Platform Growth Trends & Insights
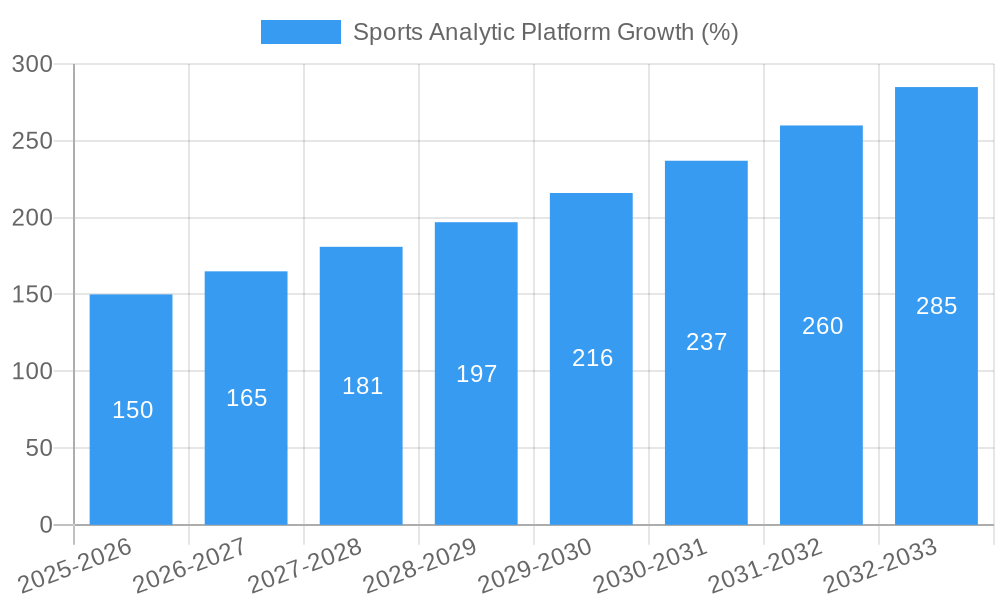
The Sports Analytic Platform market demonstrates robust growth, with a Compound Annual Growth Rate (CAGR) of xx% projected from 2025 to 2033. This growth is fueled by the increasing recognition of the value of data-driven insights in enhancing performance, improving decision-making, and engaging fans. Market penetration is currently at xx% in major leagues but shows potential for significant expansion in emerging markets and amateur sports. Technological disruptions, including the integration of advanced analytics and AI-powered tools, are driving adoption. Consumer behavior shifts towards personalized experiences and sophisticated content delivery further accelerate growth. The report provides detailed analysis of market size evolution, adoption rates across various sports and regions, and impacts of technological and behavioral shifts, including the influence of factors such as the increasing sophistication of broadcast technology and consumer demand for real-time data and statistics.
Dominant Regions, Countries, or Segments in Sports Analytic Platform
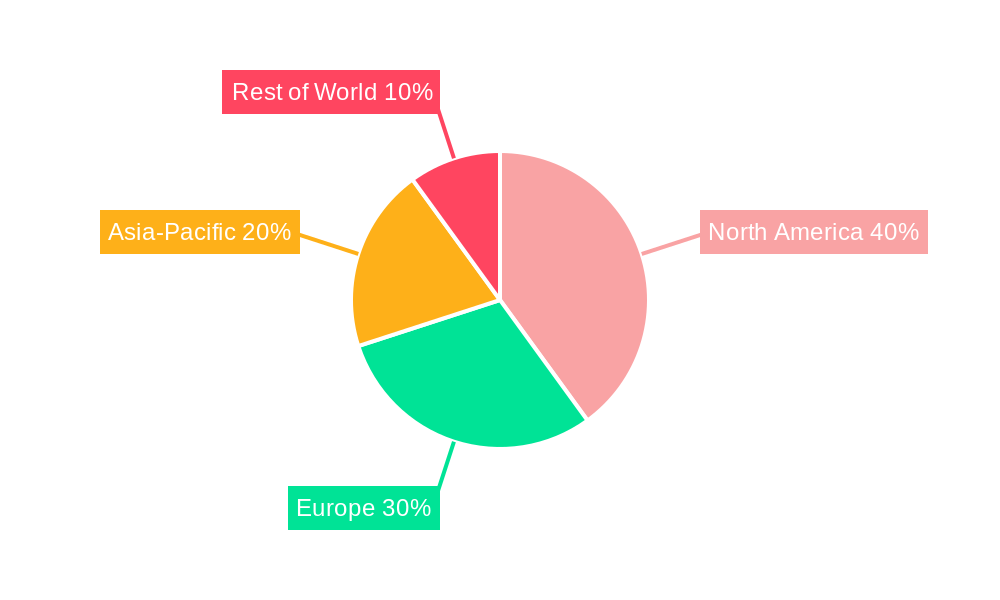
North America currently dominates the Sports Analytic Platform market, holding a market share of approximately xx% in 2025, followed by Europe and Asia-Pacific. This dominance is attributed to the high concentration of professional sports leagues and teams, advanced technological infrastructure, and substantial investments in sports analytics.
- Key Drivers in North America: Strong professional sports culture, early adoption of advanced technologies, substantial investment in R&D.
- Key Drivers in Europe: Growing interest in data-driven decision-making across various sports, investments in sports infrastructure and technology.
- Key Drivers in Asia-Pacific: Rapid growth of professional leagues, increasing media coverage, growing digital connectivity.
The report further analyzes the market dynamics within these regions and identifies key countries within each region showcasing significant growth potential, based on factors like market size, technological maturity, government policies, and sporting culture.
Sports Analytic Platform Product Landscape
The market offers a diverse range of products, from comprehensive platforms integrating data acquisition, analysis, and visualization tools to specialized solutions focusing on specific aspects like performance analysis, injury prevention, or talent scouting. These platforms utilize diverse technologies including machine learning algorithms, predictive modeling, and advanced visualizations to extract actionable insights from large datasets. Key innovations include AI-powered video analysis, real-time performance tracking, and personalized player development tools. Unique selling propositions often include seamless integration with existing workflows, user-friendly interfaces, and advanced visualization capabilities.
Key Drivers, Barriers & Challenges in Sports Analytic Platform
Key Drivers:
- Increased focus on data-driven decision-making: Teams and leagues are increasingly relying on data to optimize performance and strategy.
- Technological advancements: AI, machine learning, and big data analytics are driving innovation and improving the capabilities of analytic platforms.
- Growing investment in sports technology: Venture capital and private equity investment is fueling innovation and market growth.
Key Barriers and Challenges:
- High initial investment costs: Implementing and maintaining advanced analytics platforms can be expensive for smaller teams and leagues.
- Data security and privacy concerns: Protecting sensitive athlete data is a critical concern.
- Lack of skilled personnel: A shortage of data scientists and analysts capable of effectively utilizing these advanced platforms poses a significant challenge. This shortage is estimated to impact adoption rates by xx% in 2025.
Emerging Opportunities in Sports Analytic Platform
- Expansion into amateur and youth sports: There's significant untapped potential in providing affordable and accessible analytics tools to youth and amateur sports organizations.
- Development of specialized solutions for emerging sports: Opportunities exist for catering to the unique needs of sports with limited existing analytics infrastructure.
- Integration with wearable technology and IoT sensors: Real-time data acquisition and analysis offers potential for enhanced performance tracking and injury prevention.
Growth Accelerators in the Sports Analytic Platform Industry
Strategic partnerships between technology providers and sports organizations are accelerating market growth. This includes collaborations focused on the development of custom analytics solutions and the integration of platforms with existing team infrastructure. Further technological breakthroughs, particularly in AI and machine learning, will continue to expand the capabilities of these platforms, improving accuracy and providing more sophisticated insights. Finally, the expansion of the market into new geographical regions and sporting disciplines will further contribute to long-term growth.
Key Players Shaping the Sports Analytic Platform Market
- IBM
- SAP SE
- SAS Institute
- Oracle
- Tableau Software
- Stats Perform
- Kitman Labs
- Opta Sports
- Deltatre
- Trumedia Networks
- Agile Sports Analytics
- Chetu
- Catapult
- Synergy Sports (Sportradar)
- Exasol
- SportsSource Analytics
- DataArt
- Orreco
- Quant4sport
- Genius Sports Group
- Qualitas Global
- iSportsAnalysis
- ICEBERG Sports Analytics
- Nacsport
- Performa Sports
- Experfy Inc.
Notable Milestones in Sports Analytic Platform Sector
- 2020: Increased adoption of cloud-based platforms driven by the COVID-19 pandemic.
- 2021: Significant investments in AI-powered video analysis solutions.
- 2022: Several key mergers and acquisitions reshaping the competitive landscape.
- 2023: Launch of several new platforms integrating wearable sensor data with performance analytics.
- 2024: Growing focus on personalized player development programs powered by analytics.
In-Depth Sports Analytic Platform Market Outlook
The Sports Analytic Platform market is poised for continued strong growth, driven by ongoing technological advancements, increasing data availability, and expanding adoption across various sports and regions. Strategic investments in AI and machine learning will further enhance the capabilities of these platforms, providing more sophisticated insights and fueling market expansion. The emergence of new business models and partnerships, along with the growing integration with wearable technologies, offers significant opportunities for growth and innovation throughout the forecast period. The market is expected to reach $xx million by 2033, presenting significant opportunities for businesses to capitalize on the growing demand for data-driven solutions in the sports industry.
Sports Analytic Platform Segmentation
-
1. Application
- 1.1. Basketball
- 1.2. Football
- 1.3. Tennis
- 1.4. Badminton
- 1.5. Volleyball
- 1.6. Baseball
- 1.7. Others
-
2. Types
- 2.1. Cloud Based
- 2.2. On Premises
Sports Analytic Platform Segmentation By Geography
-
1. North America
- 1.1. United States
- 1.2. Canada
- 1.3. Mexico
-
2. South America
- 2.1. Brazil
- 2.2. Argentina
- 2.3. Rest of South America
-
3. Europe
- 3.1. United Kingdom
- 3.2. Germany
- 3.3. France
- 3.4. Italy
- 3.5. Spain
- 3.6. Russia
- 3.7. Benelux
- 3.8. Nordics
- 3.9. Rest of Europe
-
4. Middle East & Africa
- 4.1. Turkey
- 4.2. Israel
- 4.3. GCC
- 4.4. North Africa
- 4.5. South Africa
- 4.6. Rest of Middle East & Africa
-
5. Asia Pacific
- 5.1. China
- 5.2. India
- 5.3. Japan
- 5.4. South Korea
- 5.5. ASEAN
- 5.6. Oceania
- 5.7. Rest of Asia Pacific
Sports Analytic Platform REPORT HIGHLIGHTS
| Aspects | Details |
|---|---|
| Study Period | 2019-2033 |
| Base Year | 2024 |
| Estimated Year | 2025 |
| Forecast Period | 2025-2033 |
| Historical Period | 2019-2024 |
| Growth Rate | CAGR of XX% from 2019-2033 |
| Segmentation |
|
Table of Contents
- 1. Introduction
- 1.1. Research Scope
- 1.2. Market Segmentation
- 1.3. Research Methodology
- 1.4. Definitions and Assumptions
- 2. Executive Summary
- 2.1. Introduction
- 3. Market Dynamics
- 3.1. Introduction
- 3.2. Market Drivers
- 3.3. Market Restrains
- 3.4. Market Trends
- 4. Market Factor Analysis
- 4.1. Porters Five Forces
- 4.2. Supply/Value Chain
- 4.3. PESTEL analysis
- 4.4. Market Entropy
- 4.5. Patent/Trademark Analysis
- 5. Global Sports Analytic Platform Analysis, Insights and Forecast, 2019-2031
- 5.1. Market Analysis, Insights and Forecast - by Application
- 5.1.1. Basketball
- 5.1.2. Football
- 5.1.3. Tennis
- 5.1.4. Badminton
- 5.1.5. Volleyball
- 5.1.6. Baseball
- 5.1.7. Others
- 5.2. Market Analysis, Insights and Forecast - by Types
- 5.2.1. Cloud Based
- 5.2.2. On Premises
- 5.3. Market Analysis, Insights and Forecast - by Region
- 5.3.1. North America
- 5.3.2. South America
- 5.3.3. Europe
- 5.3.4. Middle East & Africa
- 5.3.5. Asia Pacific
- 5.1. Market Analysis, Insights and Forecast - by Application
- 6. North America Sports Analytic Platform Analysis, Insights and Forecast, 2019-2031
- 6.1. Market Analysis, Insights and Forecast - by Application
- 6.1.1. Basketball
- 6.1.2. Football
- 6.1.3. Tennis
- 6.1.4. Badminton
- 6.1.5. Volleyball
- 6.1.6. Baseball
- 6.1.7. Others
- 6.2. Market Analysis, Insights and Forecast - by Types
- 6.2.1. Cloud Based
- 6.2.2. On Premises
- 6.1. Market Analysis, Insights and Forecast - by Application
- 7. South America Sports Analytic Platform Analysis, Insights and Forecast, 2019-2031
- 7.1. Market Analysis, Insights and Forecast - by Application
- 7.1.1. Basketball
- 7.1.2. Football
- 7.1.3. Tennis
- 7.1.4. Badminton
- 7.1.5. Volleyball
- 7.1.6. Baseball
- 7.1.7. Others
- 7.2. Market Analysis, Insights and Forecast - by Types
- 7.2.1. Cloud Based
- 7.2.2. On Premises
- 7.1. Market Analysis, Insights and Forecast - by Application
- 8. Europe Sports Analytic Platform Analysis, Insights and Forecast, 2019-2031
- 8.1. Market Analysis, Insights and Forecast - by Application
- 8.1.1. Basketball
- 8.1.2. Football
- 8.1.3. Tennis
- 8.1.4. Badminton
- 8.1.5. Volleyball
- 8.1.6. Baseball
- 8.1.7. Others
- 8.2. Market Analysis, Insights and Forecast - by Types
- 8.2.1. Cloud Based
- 8.2.2. On Premises
- 8.1. Market Analysis, Insights and Forecast - by Application
- 9. Middle East & Africa Sports Analytic Platform Analysis, Insights and Forecast, 2019-2031
- 9.1. Market Analysis, Insights and Forecast - by Application
- 9.1.1. Basketball
- 9.1.2. Football
- 9.1.3. Tennis
- 9.1.4. Badminton
- 9.1.5. Volleyball
- 9.1.6. Baseball
- 9.1.7. Others
- 9.2. Market Analysis, Insights and Forecast - by Types
- 9.2.1. Cloud Based
- 9.2.2. On Premises
- 9.1. Market Analysis, Insights and Forecast - by Application
- 10. Asia Pacific Sports Analytic Platform Analysis, Insights and Forecast, 2019-2031
- 10.1. Market Analysis, Insights and Forecast - by Application
- 10.1.1. Basketball
- 10.1.2. Football
- 10.1.3. Tennis
- 10.1.4. Badminton
- 10.1.5. Volleyball
- 10.1.6. Baseball
- 10.1.7. Others
- 10.2. Market Analysis, Insights and Forecast - by Types
- 10.2.1. Cloud Based
- 10.2.2. On Premises
- 10.1. Market Analysis, Insights and Forecast - by Application
- 11. Competitive Analysis
- 11.1. Global Market Share Analysis 2024
- 11.2. Company Profiles
- 11.2.1 IBM
- 11.2.1.1. Overview
- 11.2.1.2. Products
- 11.2.1.3. SWOT Analysis
- 11.2.1.4. Recent Developments
- 11.2.1.5. Financials (Based on Availability)
- 11.2.2 SAP SE
- 11.2.2.1. Overview
- 11.2.2.2. Products
- 11.2.2.3. SWOT Analysis
- 11.2.2.4. Recent Developments
- 11.2.2.5. Financials (Based on Availability)
- 11.2.3 SAS Institute
- 11.2.3.1. Overview
- 11.2.3.2. Products
- 11.2.3.3. SWOT Analysis
- 11.2.3.4. Recent Developments
- 11.2.3.5. Financials (Based on Availability)
- 11.2.4 Oracle
- 11.2.4.1. Overview
- 11.2.4.2. Products
- 11.2.4.3. SWOT Analysis
- 11.2.4.4. Recent Developments
- 11.2.4.5. Financials (Based on Availability)
- 11.2.5 Tableau Software
- 11.2.5.1. Overview
- 11.2.5.2. Products
- 11.2.5.3. SWOT Analysis
- 11.2.5.4. Recent Developments
- 11.2.5.5. Financials (Based on Availability)
- 11.2.6 Stats Perform
- 11.2.6.1. Overview
- 11.2.6.2. Products
- 11.2.6.3. SWOT Analysis
- 11.2.6.4. Recent Developments
- 11.2.6.5. Financials (Based on Availability)
- 11.2.7 Kitman Labs
- 11.2.7.1. Overview
- 11.2.7.2. Products
- 11.2.7.3. SWOT Analysis
- 11.2.7.4. Recent Developments
- 11.2.7.5. Financials (Based on Availability)
- 11.2.8 Opta Sports
- 11.2.8.1. Overview
- 11.2.8.2. Products
- 11.2.8.3. SWOT Analysis
- 11.2.8.4. Recent Developments
- 11.2.8.5. Financials (Based on Availability)
- 11.2.9 Deltatre
- 11.2.9.1. Overview
- 11.2.9.2. Products
- 11.2.9.3. SWOT Analysis
- 11.2.9.4. Recent Developments
- 11.2.9.5. Financials (Based on Availability)
- 11.2.10 Trumedia Networks
- 11.2.10.1. Overview
- 11.2.10.2. Products
- 11.2.10.3. SWOT Analysis
- 11.2.10.4. Recent Developments
- 11.2.10.5. Financials (Based on Availability)
- 11.2.11 Agile Sports Analytics
- 11.2.11.1. Overview
- 11.2.11.2. Products
- 11.2.11.3. SWOT Analysis
- 11.2.11.4. Recent Developments
- 11.2.11.5. Financials (Based on Availability)
- 11.2.12 Chetu
- 11.2.12.1. Overview
- 11.2.12.2. Products
- 11.2.12.3. SWOT Analysis
- 11.2.12.4. Recent Developments
- 11.2.12.5. Financials (Based on Availability)
- 11.2.13 Catapult
- 11.2.13.1. Overview
- 11.2.13.2. Products
- 11.2.13.3. SWOT Analysis
- 11.2.13.4. Recent Developments
- 11.2.13.5. Financials (Based on Availability)
- 11.2.14 Synergy Sports (Sportradar
- 11.2.14.1. Overview
- 11.2.14.2. Products
- 11.2.14.3. SWOT Analysis
- 11.2.14.4. Recent Developments
- 11.2.14.5. Financials (Based on Availability)
- 11.2.15 Exasol
- 11.2.15.1. Overview
- 11.2.15.2. Products
- 11.2.15.3. SWOT Analysis
- 11.2.15.4. Recent Developments
- 11.2.15.5. Financials (Based on Availability)
- 11.2.16 SportsSource Analytics
- 11.2.16.1. Overview
- 11.2.16.2. Products
- 11.2.16.3. SWOT Analysis
- 11.2.16.4. Recent Developments
- 11.2.16.5. Financials (Based on Availability)
- 11.2.17 DataArt
- 11.2.17.1. Overview
- 11.2.17.2. Products
- 11.2.17.3. SWOT Analysis
- 11.2.17.4. Recent Developments
- 11.2.17.5. Financials (Based on Availability)
- 11.2.18 Orreco
- 11.2.18.1. Overview
- 11.2.18.2. Products
- 11.2.18.3. SWOT Analysis
- 11.2.18.4. Recent Developments
- 11.2.18.5. Financials (Based on Availability)
- 11.2.19 Quant4sport
- 11.2.19.1. Overview
- 11.2.19.2. Products
- 11.2.19.3. SWOT Analysis
- 11.2.19.4. Recent Developments
- 11.2.19.5. Financials (Based on Availability)
- 11.2.20 Genius Sports Group
- 11.2.20.1. Overview
- 11.2.20.2. Products
- 11.2.20.3. SWOT Analysis
- 11.2.20.4. Recent Developments
- 11.2.20.5. Financials (Based on Availability)
- 11.2.21 Qualitas Global
- 11.2.21.1. Overview
- 11.2.21.2. Products
- 11.2.21.3. SWOT Analysis
- 11.2.21.4. Recent Developments
- 11.2.21.5. Financials (Based on Availability)
- 11.2.22 iSportsAnalysis
- 11.2.22.1. Overview
- 11.2.22.2. Products
- 11.2.22.3. SWOT Analysis
- 11.2.22.4. Recent Developments
- 11.2.22.5. Financials (Based on Availability)
- 11.2.23 ICEBERG Sports Analytics
- 11.2.23.1. Overview
- 11.2.23.2. Products
- 11.2.23.3. SWOT Analysis
- 11.2.23.4. Recent Developments
- 11.2.23.5. Financials (Based on Availability)
- 11.2.24 Nacsport
- 11.2.24.1. Overview
- 11.2.24.2. Products
- 11.2.24.3. SWOT Analysis
- 11.2.24.4. Recent Developments
- 11.2.24.5. Financials (Based on Availability)
- 11.2.25 Performa Sports
- 11.2.25.1. Overview
- 11.2.25.2. Products
- 11.2.25.3. SWOT Analysis
- 11.2.25.4. Recent Developments
- 11.2.25.5. Financials (Based on Availability)
- 11.2.26 Experfy Inc.
- 11.2.26.1. Overview
- 11.2.26.2. Products
- 11.2.26.3. SWOT Analysis
- 11.2.26.4. Recent Developments
- 11.2.26.5. Financials (Based on Availability)
- 11.2.1 IBM
List of Figures
- Figure 1: Global Sports Analytic Platform Revenue Breakdown (million, %) by Region 2024 & 2032
- Figure 2: North America Sports Analytic Platform Revenue (million), by Application 2024 & 2032
- Figure 3: North America Sports Analytic Platform Revenue Share (%), by Application 2024 & 2032
- Figure 4: North America Sports Analytic Platform Revenue (million), by Types 2024 & 2032
- Figure 5: North America Sports Analytic Platform Revenue Share (%), by Types 2024 & 2032
- Figure 6: North America Sports Analytic Platform Revenue (million), by Country 2024 & 2032
- Figure 7: North America Sports Analytic Platform Revenue Share (%), by Country 2024 & 2032
- Figure 8: South America Sports Analytic Platform Revenue (million), by Application 2024 & 2032
- Figure 9: South America Sports Analytic Platform Revenue Share (%), by Application 2024 & 2032
- Figure 10: South America Sports Analytic Platform Revenue (million), by Types 2024 & 2032
- Figure 11: South America Sports Analytic Platform Revenue Share (%), by Types 2024 & 2032
- Figure 12: South America Sports Analytic Platform Revenue (million), by Country 2024 & 2032
- Figure 13: South America Sports Analytic Platform Revenue Share (%), by Country 2024 & 2032
- Figure 14: Europe Sports Analytic Platform Revenue (million), by Application 2024 & 2032
- Figure 15: Europe Sports Analytic Platform Revenue Share (%), by Application 2024 & 2032
- Figure 16: Europe Sports Analytic Platform Revenue (million), by Types 2024 & 2032
- Figure 17: Europe Sports Analytic Platform Revenue Share (%), by Types 2024 & 2032
- Figure 18: Europe Sports Analytic Platform Revenue (million), by Country 2024 & 2032
- Figure 19: Europe Sports Analytic Platform Revenue Share (%), by Country 2024 & 2032
- Figure 20: Middle East & Africa Sports Analytic Platform Revenue (million), by Application 2024 & 2032
- Figure 21: Middle East & Africa Sports Analytic Platform Revenue Share (%), by Application 2024 & 2032
- Figure 22: Middle East & Africa Sports Analytic Platform Revenue (million), by Types 2024 & 2032
- Figure 23: Middle East & Africa Sports Analytic Platform Revenue Share (%), by Types 2024 & 2032
- Figure 24: Middle East & Africa Sports Analytic Platform Revenue (million), by Country 2024 & 2032
- Figure 25: Middle East & Africa Sports Analytic Platform Revenue Share (%), by Country 2024 & 2032
- Figure 26: Asia Pacific Sports Analytic Platform Revenue (million), by Application 2024 & 2032
- Figure 27: Asia Pacific Sports Analytic Platform Revenue Share (%), by Application 2024 & 2032
- Figure 28: Asia Pacific Sports Analytic Platform Revenue (million), by Types 2024 & 2032
- Figure 29: Asia Pacific Sports Analytic Platform Revenue Share (%), by Types 2024 & 2032
- Figure 30: Asia Pacific Sports Analytic Platform Revenue (million), by Country 2024 & 2032
- Figure 31: Asia Pacific Sports Analytic Platform Revenue Share (%), by Country 2024 & 2032
List of Tables
- Table 1: Global Sports Analytic Platform Revenue million Forecast, by Region 2019 & 2032
- Table 2: Global Sports Analytic Platform Revenue million Forecast, by Application 2019 & 2032
- Table 3: Global Sports Analytic Platform Revenue million Forecast, by Types 2019 & 2032
- Table 4: Global Sports Analytic Platform Revenue million Forecast, by Region 2019 & 2032
- Table 5: Global Sports Analytic Platform Revenue million Forecast, by Application 2019 & 2032
- Table 6: Global Sports Analytic Platform Revenue million Forecast, by Types 2019 & 2032
- Table 7: Global Sports Analytic Platform Revenue million Forecast, by Country 2019 & 2032
- Table 8: United States Sports Analytic Platform Revenue (million) Forecast, by Application 2019 & 2032
- Table 9: Canada Sports Analytic Platform Revenue (million) Forecast, by Application 2019 & 2032
- Table 10: Mexico Sports Analytic Platform Revenue (million) Forecast, by Application 2019 & 2032
- Table 11: Global Sports Analytic Platform Revenue million Forecast, by Application 2019 & 2032
- Table 12: Global Sports Analytic Platform Revenue million Forecast, by Types 2019 & 2032
- Table 13: Global Sports Analytic Platform Revenue million Forecast, by Country 2019 & 2032
- Table 14: Brazil Sports Analytic Platform Revenue (million) Forecast, by Application 2019 & 2032
- Table 15: Argentina Sports Analytic Platform Revenue (million) Forecast, by Application 2019 & 2032
- Table 16: Rest of South America Sports Analytic Platform Revenue (million) Forecast, by Application 2019 & 2032
- Table 17: Global Sports Analytic Platform Revenue million Forecast, by Application 2019 & 2032
- Table 18: Global Sports Analytic Platform Revenue million Forecast, by Types 2019 & 2032
- Table 19: Global Sports Analytic Platform Revenue million Forecast, by Country 2019 & 2032
- Table 20: United Kingdom Sports Analytic Platform Revenue (million) Forecast, by Application 2019 & 2032
- Table 21: Germany Sports Analytic Platform Revenue (million) Forecast, by Application 2019 & 2032
- Table 22: France Sports Analytic Platform Revenue (million) Forecast, by Application 2019 & 2032
- Table 23: Italy Sports Analytic Platform Revenue (million) Forecast, by Application 2019 & 2032
- Table 24: Spain Sports Analytic Platform Revenue (million) Forecast, by Application 2019 & 2032
- Table 25: Russia Sports Analytic Platform Revenue (million) Forecast, by Application 2019 & 2032
- Table 26: Benelux Sports Analytic Platform Revenue (million) Forecast, by Application 2019 & 2032
- Table 27: Nordics Sports Analytic Platform Revenue (million) Forecast, by Application 2019 & 2032
- Table 28: Rest of Europe Sports Analytic Platform Revenue (million) Forecast, by Application 2019 & 2032
- Table 29: Global Sports Analytic Platform Revenue million Forecast, by Application 2019 & 2032
- Table 30: Global Sports Analytic Platform Revenue million Forecast, by Types 2019 & 2032
- Table 31: Global Sports Analytic Platform Revenue million Forecast, by Country 2019 & 2032
- Table 32: Turkey Sports Analytic Platform Revenue (million) Forecast, by Application 2019 & 2032
- Table 33: Israel Sports Analytic Platform Revenue (million) Forecast, by Application 2019 & 2032
- Table 34: GCC Sports Analytic Platform Revenue (million) Forecast, by Application 2019 & 2032
- Table 35: North Africa Sports Analytic Platform Revenue (million) Forecast, by Application 2019 & 2032
- Table 36: South Africa Sports Analytic Platform Revenue (million) Forecast, by Application 2019 & 2032
- Table 37: Rest of Middle East & Africa Sports Analytic Platform Revenue (million) Forecast, by Application 2019 & 2032
- Table 38: Global Sports Analytic Platform Revenue million Forecast, by Application 2019 & 2032
- Table 39: Global Sports Analytic Platform Revenue million Forecast, by Types 2019 & 2032
- Table 40: Global Sports Analytic Platform Revenue million Forecast, by Country 2019 & 2032
- Table 41: China Sports Analytic Platform Revenue (million) Forecast, by Application 2019 & 2032
- Table 42: India Sports Analytic Platform Revenue (million) Forecast, by Application 2019 & 2032
- Table 43: Japan Sports Analytic Platform Revenue (million) Forecast, by Application 2019 & 2032
- Table 44: South Korea Sports Analytic Platform Revenue (million) Forecast, by Application 2019 & 2032
- Table 45: ASEAN Sports Analytic Platform Revenue (million) Forecast, by Application 2019 & 2032
- Table 46: Oceania Sports Analytic Platform Revenue (million) Forecast, by Application 2019 & 2032
- Table 47: Rest of Asia Pacific Sports Analytic Platform Revenue (million) Forecast, by Application 2019 & 2032
Frequently Asked Questions
1. What is the projected Compound Annual Growth Rate (CAGR) of the Sports Analytic Platform?
The projected CAGR is approximately XX%.
2. Which companies are prominent players in the Sports Analytic Platform?
Key companies in the market include IBM, SAP SE, SAS Institute, Oracle, Tableau Software, Stats Perform, Kitman Labs, Opta Sports, Deltatre, Trumedia Networks, Agile Sports Analytics, Chetu, Catapult, Synergy Sports (Sportradar, Exasol, SportsSource Analytics, DataArt, Orreco, Quant4sport, Genius Sports Group, Qualitas Global, iSportsAnalysis, ICEBERG Sports Analytics, Nacsport, Performa Sports, Experfy Inc..
3. What are the main segments of the Sports Analytic Platform?
The market segments include Application, Types.
4. Can you provide details about the market size?
The market size is estimated to be USD XXX million as of 2022.
5. What are some drivers contributing to market growth?
N/A
6. What are the notable trends driving market growth?
N/A
7. Are there any restraints impacting market growth?
N/A
8. Can you provide examples of recent developments in the market?
N/A
9. What pricing options are available for accessing the report?
Pricing options include single-user, multi-user, and enterprise licenses priced at USD 4900.00, USD 7350.00, and USD 9800.00 respectively.
10. Is the market size provided in terms of value or volume?
The market size is provided in terms of value, measured in million.
11. Are there any specific market keywords associated with the report?
Yes, the market keyword associated with the report is "Sports Analytic Platform," which aids in identifying and referencing the specific market segment covered.
12. How do I determine which pricing option suits my needs best?
The pricing options vary based on user requirements and access needs. Individual users may opt for single-user licenses, while businesses requiring broader access may choose multi-user or enterprise licenses for cost-effective access to the report.
13. Are there any additional resources or data provided in the Sports Analytic Platform report?
While the report offers comprehensive insights, it's advisable to review the specific contents or supplementary materials provided to ascertain if additional resources or data are available.
14. How can I stay updated on further developments or reports in the Sports Analytic Platform?
To stay informed about further developments, trends, and reports in the Sports Analytic Platform, consider subscribing to industry newsletters, following relevant companies and organizations, or regularly checking reputable industry news sources and publications.
Methodology
Step 1 - Identification of Relevant Samples Size from Population Database


Step 2 - Approaches for Defining Global Market Size (Value, Volume* & Price*)

Note*: In applicable scenarios
Step 3 - Data Sources
Primary Research
- Web Analytics
- Survey Reports
- Research Institute
- Latest Research Reports
- Opinion Leaders
Secondary Research
- Annual Reports
- White Paper
- Latest Press Release
- Industry Association
- Paid Database
- Investor Presentations

Step 4 - Data Triangulation
Involves using different sources of information in order to increase the validity of a study
These sources are likely to be stakeholders in a program - participants, other researchers, program staff, other community members, and so on.
Then we put all data in single framework & apply various statistical tools to find out the dynamic on the market.
During the analysis stage, feedback from the stakeholder groups would be compared to determine areas of agreement as well as areas of divergence
