

Key Insights
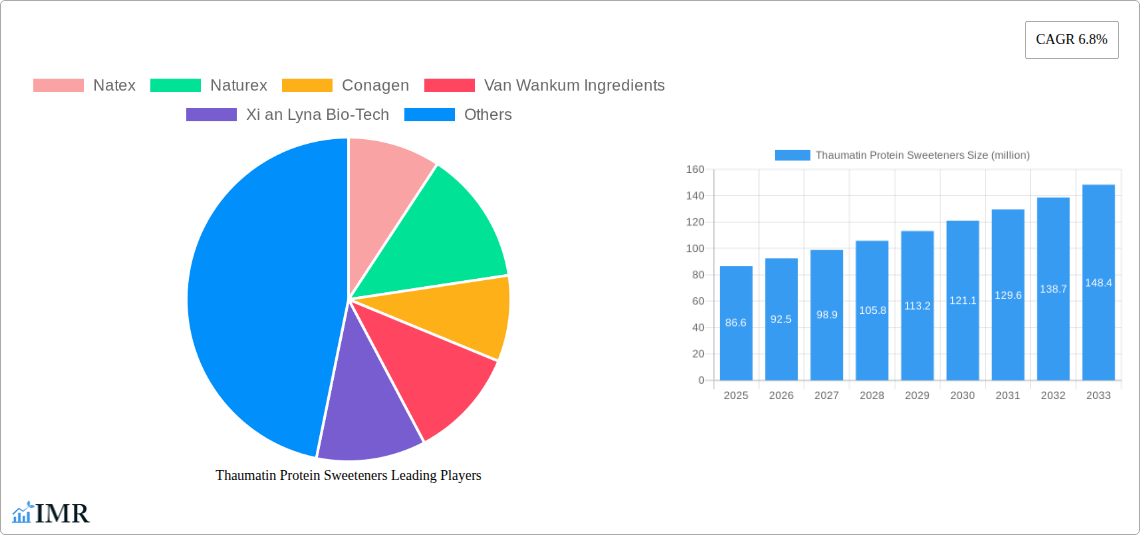
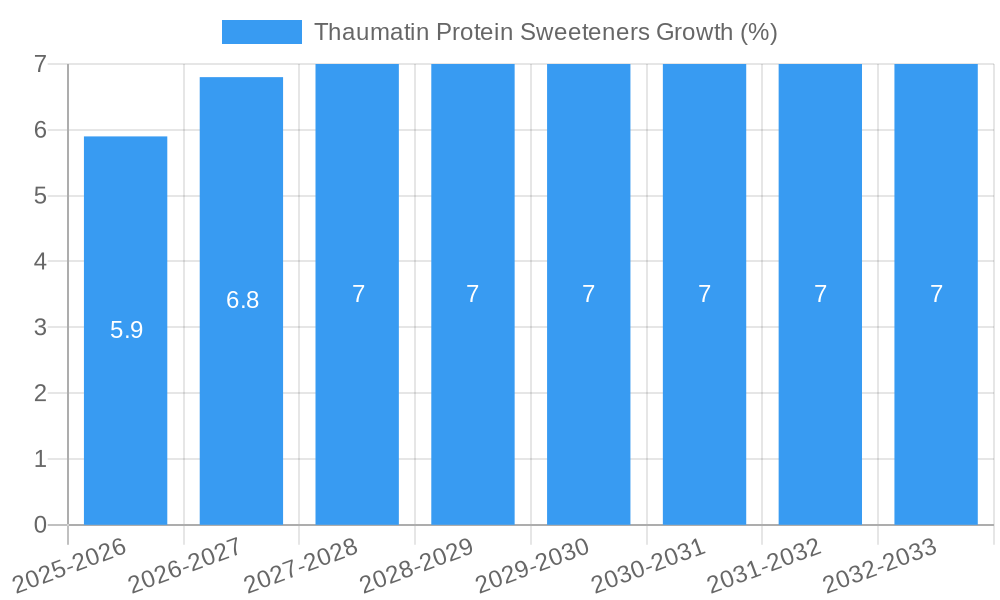
The global Thaumatin protein sweeteners market is poised for significant growth, exhibiting a robust Compound Annual Growth Rate (CAGR) of 6.8% from 2019 to 2033. With a market size of $86.6 million in 2025, the market is driven by the increasing demand for natural and low-calorie sweeteners in the food and beverage industry. Consumers are increasingly health-conscious, seeking alternatives to artificial sweeteners, which fuels the adoption of Thaumatin, a high-intensity sweetener extracted from the fruit of the Thaumatococcus daniellii plant. Growing applications in confectionery, baked goods, and beverages, coupled with the rising prevalence of diabetes and obesity, further propel market expansion. Key players like Natex, Naturex, Conagen, Van Wankum Ingredients, and Xi'an Lyna Bio-Tech are actively contributing to market growth through innovation and expansion. While challenges exist, such as the relatively high cost of production compared to artificial sweeteners, ongoing research and development efforts to improve extraction and production processes are expected to mitigate these limitations and drive market penetration in the coming years.
The forecast period (2025-2033) promises continued expansion driven by several factors. The rising popularity of functional foods and beverages that incorporate natural ingredients is a primary driver. Furthermore, regulatory approvals and increased awareness of Thaumatin's health benefits, particularly its potential prebiotic effects, are expected to drive demand. Geographic expansion into emerging markets with significant growth potential in the food and beverage sectors will also be a key factor shaping market dynamics. While challenges related to supply chain complexities and fluctuations in raw material prices may influence overall growth, the inherent advantages of Thaumatin as a natural, high-intensity sweetener are expected to outweigh these challenges, ensuring a sustained positive outlook for the market.
Thaumatin Protein Sweeteners Market Report: 2019-2033
This comprehensive report provides an in-depth analysis of the global Thaumatin Protein Sweeteners market, offering valuable insights for industry professionals, investors, and strategic decision-makers. The study covers the period 2019-2033, with a focus on the forecast period 2025-2033, using 2025 as the base year. We analyze market dynamics, growth trends, key players (including Natex, Naturex, Conagen, Van Wankum Ingredients, and Xi'an Lyna Bio-Tech), and emerging opportunities within the parent market of high-intensity sweeteners and the child market of natural sweeteners.
Thaumatin Protein Sweeteners Market Dynamics & Structure
This section delves into the competitive landscape of the Thaumatin Protein Sweeteners market, examining market concentration, technological innovation, regulatory frameworks, competitive substitutes (e.g., stevia, monk fruit), end-user demographics (food & beverage, pharmaceuticals), and M&A activities. We provide a quantitative analysis of market share distribution amongst key players and qualitative insights into innovation barriers and market entry challenges.
- Market Concentration: The market is moderately concentrated, with the top 5 players holding approximately xx% of the global market share in 2025.
- Technological Innovation: Ongoing R&D focuses on enhancing Thaumatin's stability and cost-effectiveness for wider applications.
- Regulatory Landscape: Stringent food safety regulations influence market dynamics and vary across regions.
- Competitive Substitutes: Stevia and monk fruit pose significant competition, driving innovation in Thaumatin's formulation and application.
- M&A Activity: The historical period (2019-2024) witnessed xx M&A deals, primarily focused on expanding product portfolios and geographical reach. The forecast period anticipates xx additional deals, driven by the consolidation within the natural sweetener sector.
- End-User Demographics: The food and beverage industry represents the largest end-use segment, accounting for xx% of the total market value in 2025.
Thaumatin Protein Sweeteners Growth Trends & Insights
This section analyzes the historical and projected growth trajectory of the Thaumatin Protein Sweeteners market, exploring factors influencing market size evolution, adoption rates, and consumer preferences. The analysis leverages both quantitative metrics (CAGR, market penetration) and qualitative factors to provide a holistic understanding of market trends. The global market size is estimated at $xx million in 2025 and is projected to reach $xx million by 2033, exhibiting a CAGR of xx% during the forecast period. Growth is driven by increasing consumer demand for natural and clean-label products, expanding applications across various food and beverage categories, and ongoing technological advancements. Specific trends, such as the increasing adoption in functional foods and beverages and the expanding presence in emerging economies will be detailed.
Dominant Regions, Countries, or Segments in Thaumatin Protein Sweeteners
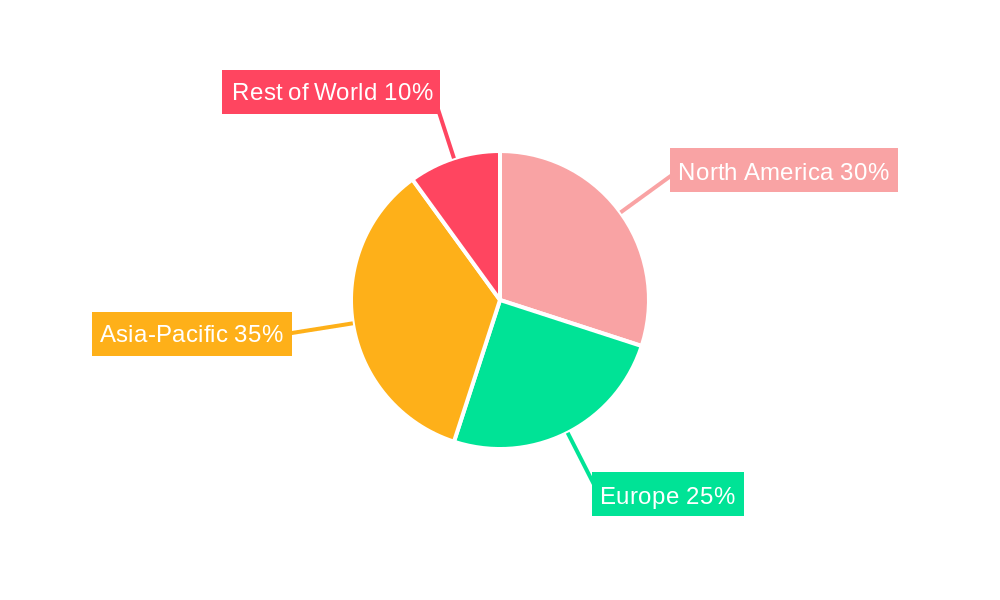
This section pinpoints the leading geographical regions and market segments driving Thaumatin Protein Sweeteners market growth. We examine factors such as economic conditions, consumer preferences, regulatory landscapes, and infrastructure development contributing to regional dominance. The North American market is projected to hold a significant market share in 2025, followed by Europe and Asia-Pacific, with strong growth anticipated in emerging economies in Asia-Pacific due to rising disposable incomes and health consciousness.
- North America: Strong demand for natural sweeteners and established food processing infrastructure contribute to market dominance.
- Europe: Stringent regulations and high consumer awareness of natural food ingredients drive growth.
- Asia-Pacific: Rising disposable incomes, increasing health consciousness, and expanding food processing capacity fuel growth potential.
Thaumatin Protein Sweeteners Product Landscape
Thaumatin protein sweeteners are offered in various forms, including powders and liquids, tailored to different applications. Recent product innovations focus on improving solubility, stability, and taste profiles to enhance consumer acceptance. Unique selling propositions emphasize its natural origin, high sweetness intensity, and clean label attributes. Technological advancements aim to reduce production costs and enhance scalability.
Key Drivers, Barriers & Challenges in Thaumatin Protein Sweeteners
Key Drivers:
- Increasing consumer preference for natural and clean-label food products.
- Growing health consciousness and demand for sugar substitutes.
- Expanding applications in various food and beverage sectors.
Challenges & Restraints:
- High production costs compared to synthetic sweeteners limit widespread adoption.
- Supply chain limitations impacting consistent product availability.
- Stringent regulatory approvals in certain regions delay market entry.
Emerging Opportunities in Thaumatin Protein Sweeteners
Untapped markets in developing economies present significant growth opportunities. Innovative applications in functional foods, beverages, and pharmaceuticals offer new avenues for expansion. Evolving consumer preferences for natural and healthier alternatives continue to fuel market expansion.
Growth Accelerators in the Thaumatin Protein Sweeteners Industry
Technological breakthroughs in production processes to reduce costs and enhance scalability are pivotal growth catalysts. Strategic partnerships between manufacturers and food & beverage companies accelerate market penetration. Expansion into new geographical markets with rising consumer demand for natural sweeteners further accelerates growth.
Key Players Shaping the Thaumatin Protein Sweeteners Market
Notable Milestones in Thaumatin Protein Sweeteners Sector
- 2020: Conagen announced a significant investment in expanding Thaumatin production capacity.
- 2022: New regulatory approvals in key markets expanded market access for Thaumatin-based products.
- 2023: A major food & beverage company launched a new product line incorporating Thaumatin as a natural sweetener. (Further milestones can be added based on available data).
In-Depth Thaumatin Protein Sweeteners Market Outlook
The future market potential for Thaumatin protein sweeteners is substantial, driven by the increasing global demand for natural sweeteners. Strategic opportunities lie in technological advancements to reduce production costs, expansion into new markets, and strategic partnerships to secure distribution channels. The market is poised for continued growth, driven by health-conscious consumers and the expanding applications of natural and clean-label ingredients in diverse industries.
Thaumatin Protein Sweeteners Segmentation
-
1. Application
- 1.1. Food and Beverages
- 1.2. Health Foods
- 1.3. Others
-
2. Type
- 2.1. Content ≥90%
- 2.2. Content ≥95%
- 2.3. Content ≥99%
Thaumatin Protein Sweeteners Segmentation By Geography
-
1. North America
- 1.1. United States
- 1.2. Canada
- 1.3. Mexico
-
2. South America
- 2.1. Brazil
- 2.2. Argentina
- 2.3. Rest of South America
-
3. Europe
- 3.1. United Kingdom
- 3.2. Germany
- 3.3. France
- 3.4. Italy
- 3.5. Spain
- 3.6. Russia
- 3.7. Benelux
- 3.8. Nordics
- 3.9. Rest of Europe
-
4. Middle East & Africa
- 4.1. Turkey
- 4.2. Israel
- 4.3. GCC
- 4.4. North Africa
- 4.5. South Africa
- 4.6. Rest of Middle East & Africa
-
5. Asia Pacific
- 5.1. China
- 5.2. India
- 5.3. Japan
- 5.4. South Korea
- 5.5. ASEAN
- 5.6. Oceania
- 5.7. Rest of Asia Pacific
Thaumatin Protein Sweeteners REPORT HIGHLIGHTS
| Aspects | Details |
|---|---|
| Study Period | 2019-2033 |
| Base Year | 2024 |
| Estimated Year | 2025 |
| Forecast Period | 2025-2033 |
| Historical Period | 2019-2024 |
| Growth Rate | CAGR of 6.8% from 2019-2033 |
| Segmentation |
|
Table of Contents
- 1. Introduction
- 1.1. Research Scope
- 1.2. Market Segmentation
- 1.3. Research Methodology
- 1.4. Definitions and Assumptions
- 2. Executive Summary
- 2.1. Introduction
- 3. Market Dynamics
- 3.1. Introduction
- 3.2. Market Drivers
- 3.3. Market Restrains
- 3.4. Market Trends
- 4. Market Factor Analysis
- 4.1. Porters Five Forces
- 4.2. Supply/Value Chain
- 4.3. PESTEL analysis
- 4.4. Market Entropy
- 4.5. Patent/Trademark Analysis
- 5. Global Thaumatin Protein Sweeteners Analysis, Insights and Forecast, 2019-2031
- 5.1. Market Analysis, Insights and Forecast - by Application
- 5.1.1. Food and Beverages
- 5.1.2. Health Foods
- 5.1.3. Others
- 5.2. Market Analysis, Insights and Forecast - by Type
- 5.2.1. Content ≥90%
- 5.2.2. Content ≥95%
- 5.2.3. Content ≥99%
- 5.3. Market Analysis, Insights and Forecast - by Region
- 5.3.1. North America
- 5.3.2. South America
- 5.3.3. Europe
- 5.3.4. Middle East & Africa
- 5.3.5. Asia Pacific
- 5.1. Market Analysis, Insights and Forecast - by Application
- 6. North America Thaumatin Protein Sweeteners Analysis, Insights and Forecast, 2019-2031
- 6.1. Market Analysis, Insights and Forecast - by Application
- 6.1.1. Food and Beverages
- 6.1.2. Health Foods
- 6.1.3. Others
- 6.2. Market Analysis, Insights and Forecast - by Type
- 6.2.1. Content ≥90%
- 6.2.2. Content ≥95%
- 6.2.3. Content ≥99%
- 6.1. Market Analysis, Insights and Forecast - by Application
- 7. South America Thaumatin Protein Sweeteners Analysis, Insights and Forecast, 2019-2031
- 7.1. Market Analysis, Insights and Forecast - by Application
- 7.1.1. Food and Beverages
- 7.1.2. Health Foods
- 7.1.3. Others
- 7.2. Market Analysis, Insights and Forecast - by Type
- 7.2.1. Content ≥90%
- 7.2.2. Content ≥95%
- 7.2.3. Content ≥99%
- 7.1. Market Analysis, Insights and Forecast - by Application
- 8. Europe Thaumatin Protein Sweeteners Analysis, Insights and Forecast, 2019-2031
- 8.1. Market Analysis, Insights and Forecast - by Application
- 8.1.1. Food and Beverages
- 8.1.2. Health Foods
- 8.1.3. Others
- 8.2. Market Analysis, Insights and Forecast - by Type
- 8.2.1. Content ≥90%
- 8.2.2. Content ≥95%
- 8.2.3. Content ≥99%
- 8.1. Market Analysis, Insights and Forecast - by Application
- 9. Middle East & Africa Thaumatin Protein Sweeteners Analysis, Insights and Forecast, 2019-2031
- 9.1. Market Analysis, Insights and Forecast - by Application
- 9.1.1. Food and Beverages
- 9.1.2. Health Foods
- 9.1.3. Others
- 9.2. Market Analysis, Insights and Forecast - by Type
- 9.2.1. Content ≥90%
- 9.2.2. Content ≥95%
- 9.2.3. Content ≥99%
- 9.1. Market Analysis, Insights and Forecast - by Application
- 10. Asia Pacific Thaumatin Protein Sweeteners Analysis, Insights and Forecast, 2019-2031
- 10.1. Market Analysis, Insights and Forecast - by Application
- 10.1.1. Food and Beverages
- 10.1.2. Health Foods
- 10.1.3. Others
- 10.2. Market Analysis, Insights and Forecast - by Type
- 10.2.1. Content ≥90%
- 10.2.2. Content ≥95%
- 10.2.3. Content ≥99%
- 10.1. Market Analysis, Insights and Forecast - by Application
- 11. Competitive Analysis
- 11.1. Global Market Share Analysis 2024
- 11.2. Company Profiles
- 11.2.1 Natex
- 11.2.1.1. Overview
- 11.2.1.2. Products
- 11.2.1.3. SWOT Analysis
- 11.2.1.4. Recent Developments
- 11.2.1.5. Financials (Based on Availability)
- 11.2.2 Naturex
- 11.2.2.1. Overview
- 11.2.2.2. Products
- 11.2.2.3. SWOT Analysis
- 11.2.2.4. Recent Developments
- 11.2.2.5. Financials (Based on Availability)
- 11.2.3 Conagen
- 11.2.3.1. Overview
- 11.2.3.2. Products
- 11.2.3.3. SWOT Analysis
- 11.2.3.4. Recent Developments
- 11.2.3.5. Financials (Based on Availability)
- 11.2.4 Van Wankum Ingredients
- 11.2.4.1. Overview
- 11.2.4.2. Products
- 11.2.4.3. SWOT Analysis
- 11.2.4.4. Recent Developments
- 11.2.4.5. Financials (Based on Availability)
- 11.2.5 Xi an Lyna Bio-Tech
- 11.2.5.1. Overview
- 11.2.5.2. Products
- 11.2.5.3. SWOT Analysis
- 11.2.5.4. Recent Developments
- 11.2.5.5. Financials (Based on Availability)
- 11.2.1 Natex
List of Figures
- Figure 1: Global Thaumatin Protein Sweeteners Revenue Breakdown (million, %) by Region 2024 & 2032
- Figure 2: North America Thaumatin Protein Sweeteners Revenue (million), by Application 2024 & 2032
- Figure 3: North America Thaumatin Protein Sweeteners Revenue Share (%), by Application 2024 & 2032
- Figure 4: North America Thaumatin Protein Sweeteners Revenue (million), by Type 2024 & 2032
- Figure 5: North America Thaumatin Protein Sweeteners Revenue Share (%), by Type 2024 & 2032
- Figure 6: North America Thaumatin Protein Sweeteners Revenue (million), by Country 2024 & 2032
- Figure 7: North America Thaumatin Protein Sweeteners Revenue Share (%), by Country 2024 & 2032
- Figure 8: South America Thaumatin Protein Sweeteners Revenue (million), by Application 2024 & 2032
- Figure 9: South America Thaumatin Protein Sweeteners Revenue Share (%), by Application 2024 & 2032
- Figure 10: South America Thaumatin Protein Sweeteners Revenue (million), by Type 2024 & 2032
- Figure 11: South America Thaumatin Protein Sweeteners Revenue Share (%), by Type 2024 & 2032
- Figure 12: South America Thaumatin Protein Sweeteners Revenue (million), by Country 2024 & 2032
- Figure 13: South America Thaumatin Protein Sweeteners Revenue Share (%), by Country 2024 & 2032
- Figure 14: Europe Thaumatin Protein Sweeteners Revenue (million), by Application 2024 & 2032
- Figure 15: Europe Thaumatin Protein Sweeteners Revenue Share (%), by Application 2024 & 2032
- Figure 16: Europe Thaumatin Protein Sweeteners Revenue (million), by Type 2024 & 2032
- Figure 17: Europe Thaumatin Protein Sweeteners Revenue Share (%), by Type 2024 & 2032
- Figure 18: Europe Thaumatin Protein Sweeteners Revenue (million), by Country 2024 & 2032
- Figure 19: Europe Thaumatin Protein Sweeteners Revenue Share (%), by Country 2024 & 2032
- Figure 20: Middle East & Africa Thaumatin Protein Sweeteners Revenue (million), by Application 2024 & 2032
- Figure 21: Middle East & Africa Thaumatin Protein Sweeteners Revenue Share (%), by Application 2024 & 2032
- Figure 22: Middle East & Africa Thaumatin Protein Sweeteners Revenue (million), by Type 2024 & 2032
- Figure 23: Middle East & Africa Thaumatin Protein Sweeteners Revenue Share (%), by Type 2024 & 2032
- Figure 24: Middle East & Africa Thaumatin Protein Sweeteners Revenue (million), by Country 2024 & 2032
- Figure 25: Middle East & Africa Thaumatin Protein Sweeteners Revenue Share (%), by Country 2024 & 2032
- Figure 26: Asia Pacific Thaumatin Protein Sweeteners Revenue (million), by Application 2024 & 2032
- Figure 27: Asia Pacific Thaumatin Protein Sweeteners Revenue Share (%), by Application 2024 & 2032
- Figure 28: Asia Pacific Thaumatin Protein Sweeteners Revenue (million), by Type 2024 & 2032
- Figure 29: Asia Pacific Thaumatin Protein Sweeteners Revenue Share (%), by Type 2024 & 2032
- Figure 30: Asia Pacific Thaumatin Protein Sweeteners Revenue (million), by Country 2024 & 2032
- Figure 31: Asia Pacific Thaumatin Protein Sweeteners Revenue Share (%), by Country 2024 & 2032
List of Tables
- Table 1: Global Thaumatin Protein Sweeteners Revenue million Forecast, by Region 2019 & 2032
- Table 2: Global Thaumatin Protein Sweeteners Revenue million Forecast, by Application 2019 & 2032
- Table 3: Global Thaumatin Protein Sweeteners Revenue million Forecast, by Type 2019 & 2032
- Table 4: Global Thaumatin Protein Sweeteners Revenue million Forecast, by Region 2019 & 2032
- Table 5: Global Thaumatin Protein Sweeteners Revenue million Forecast, by Application 2019 & 2032
- Table 6: Global Thaumatin Protein Sweeteners Revenue million Forecast, by Type 2019 & 2032
- Table 7: Global Thaumatin Protein Sweeteners Revenue million Forecast, by Country 2019 & 2032
- Table 8: United States Thaumatin Protein Sweeteners Revenue (million) Forecast, by Application 2019 & 2032
- Table 9: Canada Thaumatin Protein Sweeteners Revenue (million) Forecast, by Application 2019 & 2032
- Table 10: Mexico Thaumatin Protein Sweeteners Revenue (million) Forecast, by Application 2019 & 2032
- Table 11: Global Thaumatin Protein Sweeteners Revenue million Forecast, by Application 2019 & 2032
- Table 12: Global Thaumatin Protein Sweeteners Revenue million Forecast, by Type 2019 & 2032
- Table 13: Global Thaumatin Protein Sweeteners Revenue million Forecast, by Country 2019 & 2032
- Table 14: Brazil Thaumatin Protein Sweeteners Revenue (million) Forecast, by Application 2019 & 2032
- Table 15: Argentina Thaumatin Protein Sweeteners Revenue (million) Forecast, by Application 2019 & 2032
- Table 16: Rest of South America Thaumatin Protein Sweeteners Revenue (million) Forecast, by Application 2019 & 2032
- Table 17: Global Thaumatin Protein Sweeteners Revenue million Forecast, by Application 2019 & 2032
- Table 18: Global Thaumatin Protein Sweeteners Revenue million Forecast, by Type 2019 & 2032
- Table 19: Global Thaumatin Protein Sweeteners Revenue million Forecast, by Country 2019 & 2032
- Table 20: United Kingdom Thaumatin Protein Sweeteners Revenue (million) Forecast, by Application 2019 & 2032
- Table 21: Germany Thaumatin Protein Sweeteners Revenue (million) Forecast, by Application 2019 & 2032
- Table 22: France Thaumatin Protein Sweeteners Revenue (million) Forecast, by Application 2019 & 2032
- Table 23: Italy Thaumatin Protein Sweeteners Revenue (million) Forecast, by Application 2019 & 2032
- Table 24: Spain Thaumatin Protein Sweeteners Revenue (million) Forecast, by Application 2019 & 2032
- Table 25: Russia Thaumatin Protein Sweeteners Revenue (million) Forecast, by Application 2019 & 2032
- Table 26: Benelux Thaumatin Protein Sweeteners Revenue (million) Forecast, by Application 2019 & 2032
- Table 27: Nordics Thaumatin Protein Sweeteners Revenue (million) Forecast, by Application 2019 & 2032
- Table 28: Rest of Europe Thaumatin Protein Sweeteners Revenue (million) Forecast, by Application 2019 & 2032
- Table 29: Global Thaumatin Protein Sweeteners Revenue million Forecast, by Application 2019 & 2032
- Table 30: Global Thaumatin Protein Sweeteners Revenue million Forecast, by Type 2019 & 2032
- Table 31: Global Thaumatin Protein Sweeteners Revenue million Forecast, by Country 2019 & 2032
- Table 32: Turkey Thaumatin Protein Sweeteners Revenue (million) Forecast, by Application 2019 & 2032
- Table 33: Israel Thaumatin Protein Sweeteners Revenue (million) Forecast, by Application 2019 & 2032
- Table 34: GCC Thaumatin Protein Sweeteners Revenue (million) Forecast, by Application 2019 & 2032
- Table 35: North Africa Thaumatin Protein Sweeteners Revenue (million) Forecast, by Application 2019 & 2032
- Table 36: South Africa Thaumatin Protein Sweeteners Revenue (million) Forecast, by Application 2019 & 2032
- Table 37: Rest of Middle East & Africa Thaumatin Protein Sweeteners Revenue (million) Forecast, by Application 2019 & 2032
- Table 38: Global Thaumatin Protein Sweeteners Revenue million Forecast, by Application 2019 & 2032
- Table 39: Global Thaumatin Protein Sweeteners Revenue million Forecast, by Type 2019 & 2032
- Table 40: Global Thaumatin Protein Sweeteners Revenue million Forecast, by Country 2019 & 2032
- Table 41: China Thaumatin Protein Sweeteners Revenue (million) Forecast, by Application 2019 & 2032
- Table 42: India Thaumatin Protein Sweeteners Revenue (million) Forecast, by Application 2019 & 2032
- Table 43: Japan Thaumatin Protein Sweeteners Revenue (million) Forecast, by Application 2019 & 2032
- Table 44: South Korea Thaumatin Protein Sweeteners Revenue (million) Forecast, by Application 2019 & 2032
- Table 45: ASEAN Thaumatin Protein Sweeteners Revenue (million) Forecast, by Application 2019 & 2032
- Table 46: Oceania Thaumatin Protein Sweeteners Revenue (million) Forecast, by Application 2019 & 2032
- Table 47: Rest of Asia Pacific Thaumatin Protein Sweeteners Revenue (million) Forecast, by Application 2019 & 2032
Frequently Asked Questions
1. What is the projected Compound Annual Growth Rate (CAGR) of the Thaumatin Protein Sweeteners?
The projected CAGR is approximately 6.8%.
2. Which companies are prominent players in the Thaumatin Protein Sweeteners?
Key companies in the market include Natex, Naturex, Conagen, Van Wankum Ingredients, Xi an Lyna Bio-Tech.
3. What are the main segments of the Thaumatin Protein Sweeteners?
The market segments include Application, Type.
4. Can you provide details about the market size?
The market size is estimated to be USD 86.6 million as of 2022.
5. What are some drivers contributing to market growth?
N/A
6. What are the notable trends driving market growth?
N/A
7. Are there any restraints impacting market growth?
N/A
8. Can you provide examples of recent developments in the market?
N/A
9. What pricing options are available for accessing the report?
Pricing options include single-user, multi-user, and enterprise licenses priced at USD 2900.00, USD 4350.00, and USD 5800.00 respectively.
10. Is the market size provided in terms of value or volume?
The market size is provided in terms of value, measured in million.
11. Are there any specific market keywords associated with the report?
Yes, the market keyword associated with the report is "Thaumatin Protein Sweeteners," which aids in identifying and referencing the specific market segment covered.
12. How do I determine which pricing option suits my needs best?
The pricing options vary based on user requirements and access needs. Individual users may opt for single-user licenses, while businesses requiring broader access may choose multi-user or enterprise licenses for cost-effective access to the report.
13. Are there any additional resources or data provided in the Thaumatin Protein Sweeteners report?
While the report offers comprehensive insights, it's advisable to review the specific contents or supplementary materials provided to ascertain if additional resources or data are available.
14. How can I stay updated on further developments or reports in the Thaumatin Protein Sweeteners?
To stay informed about further developments, trends, and reports in the Thaumatin Protein Sweeteners, consider subscribing to industry newsletters, following relevant companies and organizations, or regularly checking reputable industry news sources and publications.
Methodology
Step 1 - Identification of Relevant Samples Size from Population Database


Step 2 - Approaches for Defining Global Market Size (Value, Volume* & Price*)

Note*: In applicable scenarios
Step 3 - Data Sources
Primary Research
- Web Analytics
- Survey Reports
- Research Institute
- Latest Research Reports
- Opinion Leaders
Secondary Research
- Annual Reports
- White Paper
- Latest Press Release
- Industry Association
- Paid Database
- Investor Presentations

Step 4 - Data Triangulation
Involves using different sources of information in order to increase the validity of a study
These sources are likely to be stakeholders in a program - participants, other researchers, program staff, other community members, and so on.
Then we put all data in single framework & apply various statistical tools to find out the dynamic on the market.
During the analysis stage, feedback from the stakeholder groups would be compared to determine areas of agreement as well as areas of divergence
