

Key Insights
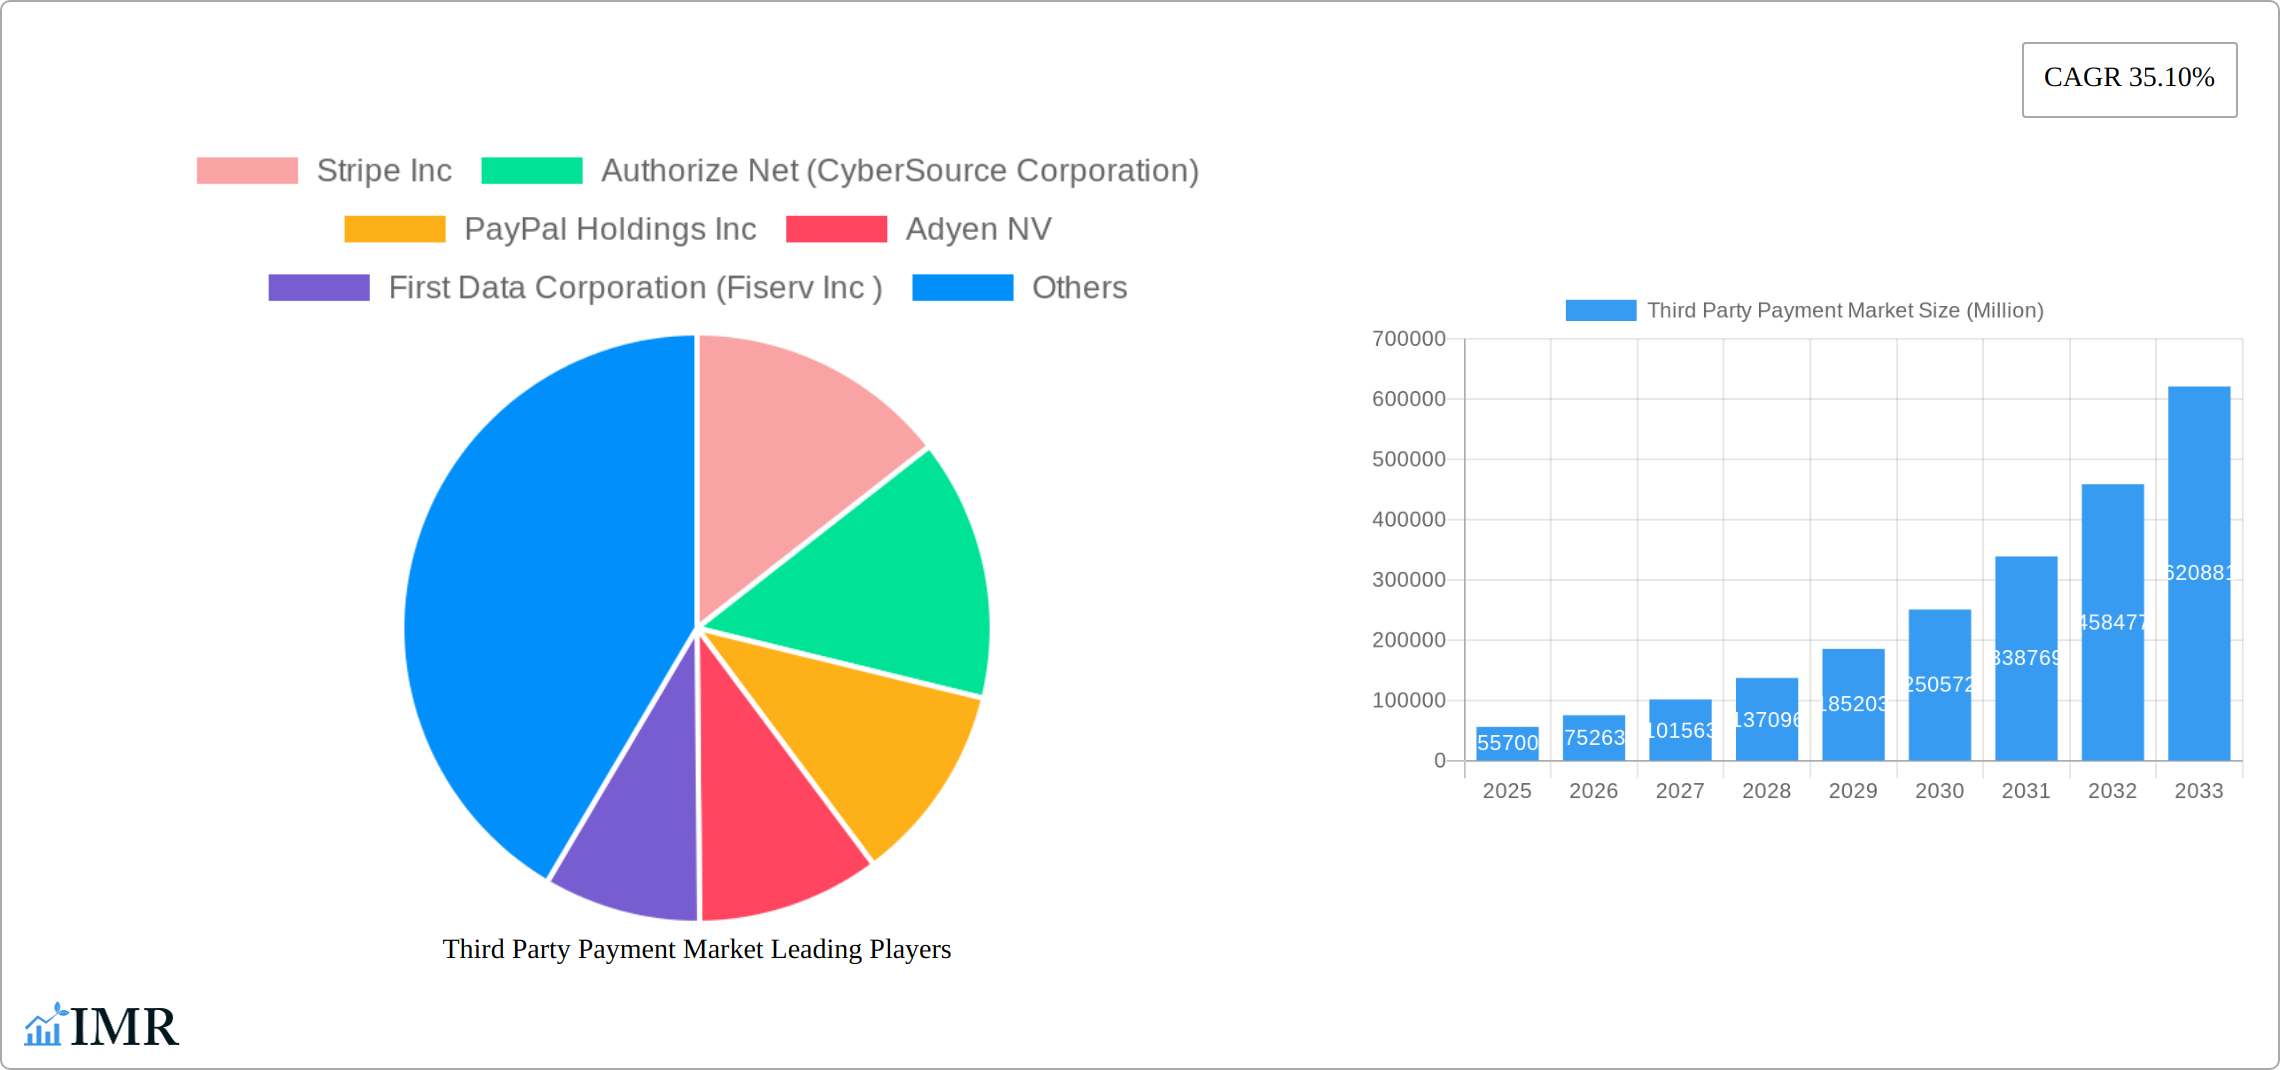
The global third-party payment market, valued at $55.70 billion in 2025, is projected to experience robust growth, driven by the increasing adoption of e-commerce, mobile payments, and digital wallets. This surge is fueled by the expanding base of online shoppers, the rising preference for contactless transactions, and the continuous advancements in payment technologies, such as biometric authentication and blockchain integration. Key market segments, including online and mobile payments, are showing particularly strong growth, outpacing traditional point-of-sale systems. The BFSI (Banking, Financial Services, and Insurance) sector remains a dominant end-user, with retail and e-commerce sectors also exhibiting substantial growth. The competitive landscape is characterized by a mix of established giants like PayPal and Stripe, alongside emerging fintech players vying for market share. Geographic expansion is another key driver, with Asia-Pacific expected to demonstrate significant growth potential due to its burgeoning digital economy and rising smartphone penetration. However, challenges like regulatory hurdles, security concerns, and the need for robust fraud prevention measures remain significant considerations for market players.
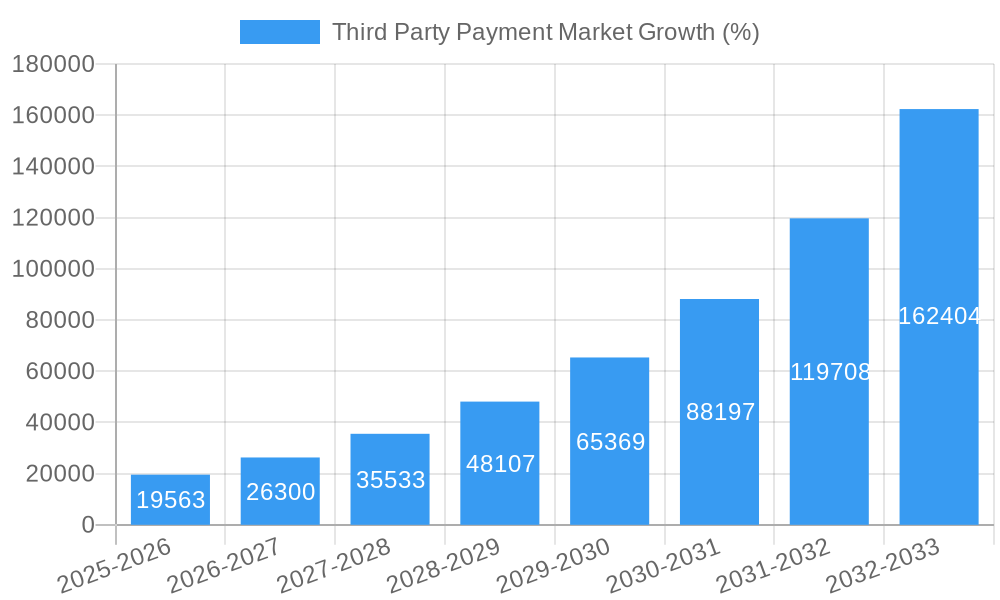
The projected CAGR of 35.10% indicates a substantial expansion of the market over the forecast period (2025-2033). This growth will be shaped by several factors, including the increasing integration of third-party payment systems into various business models, the continued development of innovative payment solutions, and the expanding global reach of e-commerce platforms. To sustain this momentum, companies must focus on enhancing security protocols, adapting to evolving regulatory frameworks, and delivering seamless and user-friendly payment experiences. The adoption of advanced technologies like AI and machine learning will also play a vital role in improving fraud detection and risk management. Competition will remain fierce, necessitating a focus on strategic partnerships, innovation, and a deep understanding of evolving customer preferences across different geographical regions.
Third Party Payment Market: A Comprehensive Report (2019-2033)
This in-depth report provides a comprehensive analysis of the Third Party Payment Market, encompassing market dynamics, growth trends, regional dominance, product landscapes, key players, and future outlook. The study period covers 2019-2033, with 2025 as the base and estimated year. The report offers invaluable insights for industry professionals, investors, and strategic decision-makers seeking to navigate this rapidly evolving landscape. The market is segmented by type (Online, Mobile, Point of Sale) and end-user (BFSI, Retail, E-commerce, Other). The total market size in 2025 is estimated at XXX Million.
Third Party Payment Market Market Dynamics & Structure
The third-party payment market is characterized by intense competition, rapid technological innovation, and evolving regulatory landscapes. Market concentration is moderate, with a few dominant players like PayPal and Stripe commanding significant market share, but numerous smaller players vying for market positions. The market share of the top 5 players is estimated at 60% in 2025. Technological advancements, such as advancements in mobile payment technologies and the increasing adoption of digital wallets are major drivers. Regulatory frameworks, including data privacy regulations (like GDPR) and anti-money laundering (AML) compliance, significantly influence market operations. The emergence of Buy Now Pay Later (BNPL) services presents a competitive substitute.
- Market Concentration: Moderate, with top 5 players holding approximately 60% market share (2025).
- Technological Innovation: Mobile payments, digital wallets, and BNPL are key drivers.
- Regulatory Frameworks: GDPR, AML compliance, and regional variations shape market dynamics.
- Competitive Substitutes: Traditional payment methods, and other emerging fintech solutions.
- End-User Demographics: Shifting towards younger, digitally native consumers driving mobile payment adoption.
- M&A Trends: Consolidation expected to continue, with larger players acquiring smaller fintech firms. The number of M&A deals in the period 2019-2024 was approximately xx.
Third Party Payment Market Growth Trends & Insights
The third-party payment market has experienced significant growth, driven by increased e-commerce adoption, the proliferation of mobile devices, and rising digital transactions. The market size exhibited a CAGR of xx% during the historical period (2019-2024), and is projected to grow at a CAGR of xx% during the forecast period (2025-2033), reaching XXX Million by 2033. This growth is attributed to factors such as increasing smartphone penetration, rising internet usage, expanding e-commerce activities, and a growing preference for contactless payments. Technological disruptions such as the integration of AI and blockchain are expected to further accelerate market expansion. Consumer behavior is shifting towards seamless, secure, and personalized payment experiences.
Dominant Regions, Countries, or Segments in Third Party Payment Market
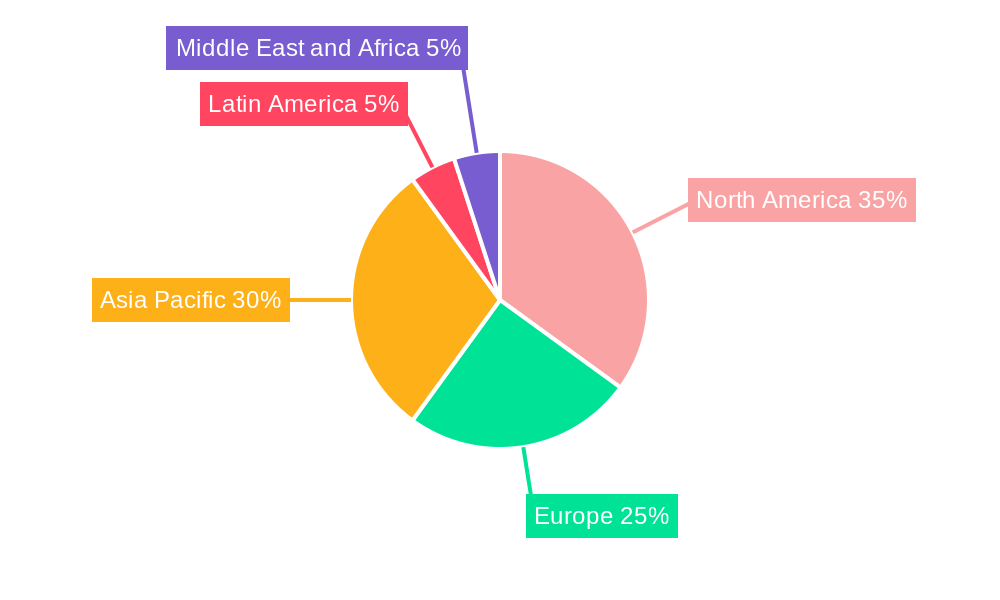
North America and Europe currently dominate the third-party payment market, driven by high internet and smartphone penetration, robust e-commerce infrastructure, and favorable regulatory environments. However, the Asia-Pacific region is witnessing the fastest growth, fueled by a burgeoning middle class, expanding digital economy, and increasing mobile payment adoption.
By Type:
- Online: Maintains a significant market share due to established e-commerce presence.
- Mobile: Fastest-growing segment, driven by smartphone penetration and user preference.
- Point of Sale: Steady growth, driven by contactless payment adoption and in-store digitalization.
By End-User:
E-commerce: Largest segment, driven by the boom in online retail.
BFSI: Significant growth due to increased digital banking adoption and payment processing needs.
Retail: Steady growth, driven by the adoption of contactless payments.
Key Drivers: High internet penetration, robust e-commerce infrastructure, favorable regulatory environments (North America and Europe); increasing smartphone penetration, expanding digital economy, and rising adoption of mobile payments (Asia-Pacific).
Third Party Payment Market Product Landscape
The third-party payment market offers a diverse range of products, including online payment gateways, mobile payment apps, point-of-sale systems, and digital wallets. These products are constantly evolving to enhance security, user experience, and payment processing efficiency. Key innovations include biometric authentication, tokenization, and AI-powered fraud detection. Unique selling propositions include seamless integration with various platforms, personalized user experiences, and robust security features.
Key Drivers, Barriers & Challenges in Third Party Payment Market
Key Drivers:
- Increasing e-commerce adoption
- Rising smartphone penetration
- Growing preference for contactless payments
- Technological advancements in payment processing
Challenges & Restraints:
- Stringent regulatory compliance
- Data security and privacy concerns
- Competition from established players and emerging fintechs
- Cross-border payment complexities and fluctuating currency exchange rates.
Emerging Opportunities in Third Party Payment Market
Emerging opportunities include the expansion into untapped markets (e.g., underbanked populations), the integration of blockchain technology for enhanced security and transparency, and the development of innovative payment solutions for the metaverse and other emerging technologies.
Growth Accelerators in the Third Party Payment Market Industry
Strategic partnerships between fintech companies and traditional financial institutions are driving market growth. Technological advancements, such as the integration of AI and machine learning for fraud prevention and personalized payment experiences, are key growth catalysts. The expansion into emerging markets and the development of innovative payment solutions for niche sectors contribute to accelerated growth.
Key Players Shaping the Third Party Payment Market Market
- Stripe Inc
- Authorize.Net (CyberSource Corporation)
- PayPal Holdings Inc
- Adyen NV
- First Data Corporation (Fiserv Inc)
- Amazon Payments Inc
- Alipay com Co Ltd
- 2checkout Com Inc (Avangate BV)
- One 97 Communications Limite
- WePay Inc (JPMorgan Chase & Co)
Notable Milestones in Third Party Payment Market Sector
- October 2023: PayPal Holdings Inc. integrated PayPal and Venmo cards with Apple Wallet, enabling seamless in-store, online, and app payments.
- May 2023: Stripe Inc. partnered with Lotus, integrating payment solutions into the sales cycle of Lotus's electric vehicles, enhancing the customer experience.
In-Depth Third Party Payment Market Market Outlook
The third-party payment market is poised for continued robust growth, driven by technological innovation, expanding e-commerce, and increasing global digital adoption. Strategic partnerships, expansion into new markets, and the development of innovative payment solutions will shape the market's future. Opportunities lie in providing secure, personalized, and seamless payment experiences across all channels.
Third Party Payment Market Segmentation
-
1. Type
- 1.1. Online
- 1.2. Mobile
- 1.3. Point of Sale
-
2. End User
- 2.1. BFSI
- 2.2. Retail
- 2.3. E-Commerce
- 2.4. Other End Users
Third Party Payment Market Segmentation By Geography
- 1. North America
- 2. Europe
- 3. Asia
- 4. Australia and New Zealand
- 5. Latin America
- 6. Middle East and Africa
Third Party Payment Market REPORT HIGHLIGHTS
| Aspects | Details |
|---|---|
| Study Period | 2019-2033 |
| Base Year | 2024 |
| Estimated Year | 2025 |
| Forecast Period | 2025-2033 |
| Historical Period | 2019-2024 |
| Growth Rate | CAGR of 35.10% from 2019-2033 |
| Segmentation |
|
Table of Contents
- 1. Introduction
- 1.1. Research Scope
- 1.2. Market Segmentation
- 1.3. Research Methodology
- 1.4. Definitions and Assumptions
- 2. Executive Summary
- 2.1. Introduction
- 3. Market Dynamics
- 3.1. Introduction
- 3.2. Market Drivers
- 3.2.1. Penetration of Internet Leading to Proliferation of Digital Payments; Cloud Based Systems Leading to Growth of B2B Sales and also Higher Sales in the POS Segment; Growth of E-Commerce Across the High Growth Regions of the World
- 3.3. Market Restrains
- 3.3.1. Security and Privacy Concerns to Restrain the Market
- 3.4. Market Trends
- 3.4.1. The Point of Sale Segment is Expected to Drive the Market
- 4. Market Factor Analysis
- 4.1. Porters Five Forces
- 4.2. Supply/Value Chain
- 4.3. PESTEL analysis
- 4.4. Market Entropy
- 4.5. Patent/Trademark Analysis
- 5. Global Third Party Payment Market Analysis, Insights and Forecast, 2019-2031
- 5.1. Market Analysis, Insights and Forecast - by Type
- 5.1.1. Online
- 5.1.2. Mobile
- 5.1.3. Point of Sale
- 5.2. Market Analysis, Insights and Forecast - by End User
- 5.2.1. BFSI
- 5.2.2. Retail
- 5.2.3. E-Commerce
- 5.2.4. Other End Users
- 5.3. Market Analysis, Insights and Forecast - by Region
- 5.3.1. North America
- 5.3.2. Europe
- 5.3.3. Asia
- 5.3.4. Australia and New Zealand
- 5.3.5. Latin America
- 5.3.6. Middle East and Africa
- 5.1. Market Analysis, Insights and Forecast - by Type
- 6. North America Third Party Payment Market Analysis, Insights and Forecast, 2019-2031
- 6.1. Market Analysis, Insights and Forecast - by Type
- 6.1.1. Online
- 6.1.2. Mobile
- 6.1.3. Point of Sale
- 6.2. Market Analysis, Insights and Forecast - by End User
- 6.2.1. BFSI
- 6.2.2. Retail
- 6.2.3. E-Commerce
- 6.2.4. Other End Users
- 6.1. Market Analysis, Insights and Forecast - by Type
- 7. Europe Third Party Payment Market Analysis, Insights and Forecast, 2019-2031
- 7.1. Market Analysis, Insights and Forecast - by Type
- 7.1.1. Online
- 7.1.2. Mobile
- 7.1.3. Point of Sale
- 7.2. Market Analysis, Insights and Forecast - by End User
- 7.2.1. BFSI
- 7.2.2. Retail
- 7.2.3. E-Commerce
- 7.2.4. Other End Users
- 7.1. Market Analysis, Insights and Forecast - by Type
- 8. Asia Third Party Payment Market Analysis, Insights and Forecast, 2019-2031
- 8.1. Market Analysis, Insights and Forecast - by Type
- 8.1.1. Online
- 8.1.2. Mobile
- 8.1.3. Point of Sale
- 8.2. Market Analysis, Insights and Forecast - by End User
- 8.2.1. BFSI
- 8.2.2. Retail
- 8.2.3. E-Commerce
- 8.2.4. Other End Users
- 8.1. Market Analysis, Insights and Forecast - by Type
- 9. Australia and New Zealand Third Party Payment Market Analysis, Insights and Forecast, 2019-2031
- 9.1. Market Analysis, Insights and Forecast - by Type
- 9.1.1. Online
- 9.1.2. Mobile
- 9.1.3. Point of Sale
- 9.2. Market Analysis, Insights and Forecast - by End User
- 9.2.1. BFSI
- 9.2.2. Retail
- 9.2.3. E-Commerce
- 9.2.4. Other End Users
- 9.1. Market Analysis, Insights and Forecast - by Type
- 10. Latin America Third Party Payment Market Analysis, Insights and Forecast, 2019-2031
- 10.1. Market Analysis, Insights and Forecast - by Type
- 10.1.1. Online
- 10.1.2. Mobile
- 10.1.3. Point of Sale
- 10.2. Market Analysis, Insights and Forecast - by End User
- 10.2.1. BFSI
- 10.2.2. Retail
- 10.2.3. E-Commerce
- 10.2.4. Other End Users
- 10.1. Market Analysis, Insights and Forecast - by Type
- 11. Middle East and Africa Third Party Payment Market Analysis, Insights and Forecast, 2019-2031
- 11.1. Market Analysis, Insights and Forecast - by Type
- 11.1.1. Online
- 11.1.2. Mobile
- 11.1.3. Point of Sale
- 11.2. Market Analysis, Insights and Forecast - by End User
- 11.2.1. BFSI
- 11.2.2. Retail
- 11.2.3. E-Commerce
- 11.2.4. Other End Users
- 11.1. Market Analysis, Insights and Forecast - by Type
- 12. North America Third Party Payment Market Analysis, Insights and Forecast, 2019-2031
- 12.1. Market Analysis, Insights and Forecast - By Country/Sub-region
- 12.1.1.
- 13. Europe Third Party Payment Market Analysis, Insights and Forecast, 2019-2031
- 13.1. Market Analysis, Insights and Forecast - By Country/Sub-region
- 13.1.1.
- 14. Asia Pacific Third Party Payment Market Analysis, Insights and Forecast, 2019-2031
- 14.1. Market Analysis, Insights and Forecast - By Country/Sub-region
- 14.1.1.
- 15. Latin America Third Party Payment Market Analysis, Insights and Forecast, 2019-2031
- 15.1. Market Analysis, Insights and Forecast - By Country/Sub-region
- 15.1.1.
- 16. Middle East and Africa Third Party Payment Market Analysis, Insights and Forecast, 2019-2031
- 16.1. Market Analysis, Insights and Forecast - By Country/Sub-region
- 16.1.1.
- 17. Competitive Analysis
- 17.1. Global Market Share Analysis 2024
- 17.2. Company Profiles
- 17.2.1 Stripe Inc
- 17.2.1.1. Overview
- 17.2.1.2. Products
- 17.2.1.3. SWOT Analysis
- 17.2.1.4. Recent Developments
- 17.2.1.5. Financials (Based on Availability)
- 17.2.2 Authorize Net (CyberSource Corporation)
- 17.2.2.1. Overview
- 17.2.2.2. Products
- 17.2.2.3. SWOT Analysis
- 17.2.2.4. Recent Developments
- 17.2.2.5. Financials (Based on Availability)
- 17.2.3 PayPal Holdings Inc
- 17.2.3.1. Overview
- 17.2.3.2. Products
- 17.2.3.3. SWOT Analysis
- 17.2.3.4. Recent Developments
- 17.2.3.5. Financials (Based on Availability)
- 17.2.4 Adyen NV
- 17.2.4.1. Overview
- 17.2.4.2. Products
- 17.2.4.3. SWOT Analysis
- 17.2.4.4. Recent Developments
- 17.2.4.5. Financials (Based on Availability)
- 17.2.5 First Data Corporation (Fiserv Inc )
- 17.2.5.1. Overview
- 17.2.5.2. Products
- 17.2.5.3. SWOT Analysis
- 17.2.5.4. Recent Developments
- 17.2.5.5. Financials (Based on Availability)
- 17.2.6 Amazon Payments Inc
- 17.2.6.1. Overview
- 17.2.6.2. Products
- 17.2.6.3. SWOT Analysis
- 17.2.6.4. Recent Developments
- 17.2.6.5. Financials (Based on Availability)
- 17.2.7 Alipay com Co Ltd
- 17.2.7.1. Overview
- 17.2.7.2. Products
- 17.2.7.3. SWOT Analysis
- 17.2.7.4. Recent Developments
- 17.2.7.5. Financials (Based on Availability)
- 17.2.8 2checkout Com Inc (Avangate BV)
- 17.2.8.1. Overview
- 17.2.8.2. Products
- 17.2.8.3. SWOT Analysis
- 17.2.8.4. Recent Developments
- 17.2.8.5. Financials (Based on Availability)
- 17.2.9 One 97 Communications Limite
- 17.2.9.1. Overview
- 17.2.9.2. Products
- 17.2.9.3. SWOT Analysis
- 17.2.9.4. Recent Developments
- 17.2.9.5. Financials (Based on Availability)
- 17.2.10 WePay Inc (JPMorgan Chase & Co )
- 17.2.10.1. Overview
- 17.2.10.2. Products
- 17.2.10.3. SWOT Analysis
- 17.2.10.4. Recent Developments
- 17.2.10.5. Financials (Based on Availability)
- 17.2.1 Stripe Inc
List of Figures
- Figure 1: Global Third Party Payment Market Revenue Breakdown (Million, %) by Region 2024 & 2032
- Figure 2: North America Third Party Payment Market Revenue (Million), by Country 2024 & 2032
- Figure 3: North America Third Party Payment Market Revenue Share (%), by Country 2024 & 2032
- Figure 4: Europe Third Party Payment Market Revenue (Million), by Country 2024 & 2032
- Figure 5: Europe Third Party Payment Market Revenue Share (%), by Country 2024 & 2032
- Figure 6: Asia Pacific Third Party Payment Market Revenue (Million), by Country 2024 & 2032
- Figure 7: Asia Pacific Third Party Payment Market Revenue Share (%), by Country 2024 & 2032
- Figure 8: Latin America Third Party Payment Market Revenue (Million), by Country 2024 & 2032
- Figure 9: Latin America Third Party Payment Market Revenue Share (%), by Country 2024 & 2032
- Figure 10: Middle East and Africa Third Party Payment Market Revenue (Million), by Country 2024 & 2032
- Figure 11: Middle East and Africa Third Party Payment Market Revenue Share (%), by Country 2024 & 2032
- Figure 12: North America Third Party Payment Market Revenue (Million), by Type 2024 & 2032
- Figure 13: North America Third Party Payment Market Revenue Share (%), by Type 2024 & 2032
- Figure 14: North America Third Party Payment Market Revenue (Million), by End User 2024 & 2032
- Figure 15: North America Third Party Payment Market Revenue Share (%), by End User 2024 & 2032
- Figure 16: North America Third Party Payment Market Revenue (Million), by Country 2024 & 2032
- Figure 17: North America Third Party Payment Market Revenue Share (%), by Country 2024 & 2032
- Figure 18: Europe Third Party Payment Market Revenue (Million), by Type 2024 & 2032
- Figure 19: Europe Third Party Payment Market Revenue Share (%), by Type 2024 & 2032
- Figure 20: Europe Third Party Payment Market Revenue (Million), by End User 2024 & 2032
- Figure 21: Europe Third Party Payment Market Revenue Share (%), by End User 2024 & 2032
- Figure 22: Europe Third Party Payment Market Revenue (Million), by Country 2024 & 2032
- Figure 23: Europe Third Party Payment Market Revenue Share (%), by Country 2024 & 2032
- Figure 24: Asia Third Party Payment Market Revenue (Million), by Type 2024 & 2032
- Figure 25: Asia Third Party Payment Market Revenue Share (%), by Type 2024 & 2032
- Figure 26: Asia Third Party Payment Market Revenue (Million), by End User 2024 & 2032
- Figure 27: Asia Third Party Payment Market Revenue Share (%), by End User 2024 & 2032
- Figure 28: Asia Third Party Payment Market Revenue (Million), by Country 2024 & 2032
- Figure 29: Asia Third Party Payment Market Revenue Share (%), by Country 2024 & 2032
- Figure 30: Australia and New Zealand Third Party Payment Market Revenue (Million), by Type 2024 & 2032
- Figure 31: Australia and New Zealand Third Party Payment Market Revenue Share (%), by Type 2024 & 2032
- Figure 32: Australia and New Zealand Third Party Payment Market Revenue (Million), by End User 2024 & 2032
- Figure 33: Australia and New Zealand Third Party Payment Market Revenue Share (%), by End User 2024 & 2032
- Figure 34: Australia and New Zealand Third Party Payment Market Revenue (Million), by Country 2024 & 2032
- Figure 35: Australia and New Zealand Third Party Payment Market Revenue Share (%), by Country 2024 & 2032
- Figure 36: Latin America Third Party Payment Market Revenue (Million), by Type 2024 & 2032
- Figure 37: Latin America Third Party Payment Market Revenue Share (%), by Type 2024 & 2032
- Figure 38: Latin America Third Party Payment Market Revenue (Million), by End User 2024 & 2032
- Figure 39: Latin America Third Party Payment Market Revenue Share (%), by End User 2024 & 2032
- Figure 40: Latin America Third Party Payment Market Revenue (Million), by Country 2024 & 2032
- Figure 41: Latin America Third Party Payment Market Revenue Share (%), by Country 2024 & 2032
- Figure 42: Middle East and Africa Third Party Payment Market Revenue (Million), by Type 2024 & 2032
- Figure 43: Middle East and Africa Third Party Payment Market Revenue Share (%), by Type 2024 & 2032
- Figure 44: Middle East and Africa Third Party Payment Market Revenue (Million), by End User 2024 & 2032
- Figure 45: Middle East and Africa Third Party Payment Market Revenue Share (%), by End User 2024 & 2032
- Figure 46: Middle East and Africa Third Party Payment Market Revenue (Million), by Country 2024 & 2032
- Figure 47: Middle East and Africa Third Party Payment Market Revenue Share (%), by Country 2024 & 2032
List of Tables
- Table 1: Global Third Party Payment Market Revenue Million Forecast, by Region 2019 & 2032
- Table 2: Global Third Party Payment Market Revenue Million Forecast, by Type 2019 & 2032
- Table 3: Global Third Party Payment Market Revenue Million Forecast, by End User 2019 & 2032
- Table 4: Global Third Party Payment Market Revenue Million Forecast, by Region 2019 & 2032
- Table 5: Global Third Party Payment Market Revenue Million Forecast, by Country 2019 & 2032
- Table 6: Third Party Payment Market Revenue (Million) Forecast, by Application 2019 & 2032
- Table 7: Global Third Party Payment Market Revenue Million Forecast, by Country 2019 & 2032
- Table 8: Third Party Payment Market Revenue (Million) Forecast, by Application 2019 & 2032
- Table 9: Global Third Party Payment Market Revenue Million Forecast, by Country 2019 & 2032
- Table 10: Third Party Payment Market Revenue (Million) Forecast, by Application 2019 & 2032
- Table 11: Global Third Party Payment Market Revenue Million Forecast, by Country 2019 & 2032
- Table 12: Third Party Payment Market Revenue (Million) Forecast, by Application 2019 & 2032
- Table 13: Global Third Party Payment Market Revenue Million Forecast, by Country 2019 & 2032
- Table 14: Third Party Payment Market Revenue (Million) Forecast, by Application 2019 & 2032
- Table 15: Global Third Party Payment Market Revenue Million Forecast, by Type 2019 & 2032
- Table 16: Global Third Party Payment Market Revenue Million Forecast, by End User 2019 & 2032
- Table 17: Global Third Party Payment Market Revenue Million Forecast, by Country 2019 & 2032
- Table 18: Global Third Party Payment Market Revenue Million Forecast, by Type 2019 & 2032
- Table 19: Global Third Party Payment Market Revenue Million Forecast, by End User 2019 & 2032
- Table 20: Global Third Party Payment Market Revenue Million Forecast, by Country 2019 & 2032
- Table 21: Global Third Party Payment Market Revenue Million Forecast, by Type 2019 & 2032
- Table 22: Global Third Party Payment Market Revenue Million Forecast, by End User 2019 & 2032
- Table 23: Global Third Party Payment Market Revenue Million Forecast, by Country 2019 & 2032
- Table 24: Global Third Party Payment Market Revenue Million Forecast, by Type 2019 & 2032
- Table 25: Global Third Party Payment Market Revenue Million Forecast, by End User 2019 & 2032
- Table 26: Global Third Party Payment Market Revenue Million Forecast, by Country 2019 & 2032
- Table 27: Global Third Party Payment Market Revenue Million Forecast, by Type 2019 & 2032
- Table 28: Global Third Party Payment Market Revenue Million Forecast, by End User 2019 & 2032
- Table 29: Global Third Party Payment Market Revenue Million Forecast, by Country 2019 & 2032
- Table 30: Global Third Party Payment Market Revenue Million Forecast, by Type 2019 & 2032
- Table 31: Global Third Party Payment Market Revenue Million Forecast, by End User 2019 & 2032
- Table 32: Global Third Party Payment Market Revenue Million Forecast, by Country 2019 & 2032
Frequently Asked Questions
1. What is the projected Compound Annual Growth Rate (CAGR) of the Third Party Payment Market?
The projected CAGR is approximately 35.10%.
2. Which companies are prominent players in the Third Party Payment Market?
Key companies in the market include Stripe Inc, Authorize Net (CyberSource Corporation), PayPal Holdings Inc, Adyen NV, First Data Corporation (Fiserv Inc ), Amazon Payments Inc, Alipay com Co Ltd, 2checkout Com Inc (Avangate BV), One 97 Communications Limite, WePay Inc (JPMorgan Chase & Co ).
3. What are the main segments of the Third Party Payment Market?
The market segments include Type, End User.
4. Can you provide details about the market size?
The market size is estimated to be USD 55.70 Million as of 2022.
5. What are some drivers contributing to market growth?
Penetration of Internet Leading to Proliferation of Digital Payments; Cloud Based Systems Leading to Growth of B2B Sales and also Higher Sales in the POS Segment; Growth of E-Commerce Across the High Growth Regions of the World.
6. What are the notable trends driving market growth?
The Point of Sale Segment is Expected to Drive the Market.
7. Are there any restraints impacting market growth?
Security and Privacy Concerns to Restrain the Market.
8. Can you provide examples of recent developments in the market?
October 2023: PayPal Holdings Inc. announced that customers can add their eligible PayPal and Venmo credit or debit cards to Apple Wallet and begin making payments. Customers can tap their iPhone and Apple Watch. PayPal and Venmo credit or debit card holders can make payments quickly and securely in-store, online, or on their favorite apps using Apple Pay.
9. What pricing options are available for accessing the report?
Pricing options include single-user, multi-user, and enterprise licenses priced at USD 4750, USD 5250, and USD 8750 respectively.
10. Is the market size provided in terms of value or volume?
The market size is provided in terms of value, measured in Million.
11. Are there any specific market keywords associated with the report?
Yes, the market keyword associated with the report is "Third Party Payment Market," which aids in identifying and referencing the specific market segment covered.
12. How do I determine which pricing option suits my needs best?
The pricing options vary based on user requirements and access needs. Individual users may opt for single-user licenses, while businesses requiring broader access may choose multi-user or enterprise licenses for cost-effective access to the report.
13. Are there any additional resources or data provided in the Third Party Payment Market report?
While the report offers comprehensive insights, it's advisable to review the specific contents or supplementary materials provided to ascertain if additional resources or data are available.
14. How can I stay updated on further developments or reports in the Third Party Payment Market?
To stay informed about further developments, trends, and reports in the Third Party Payment Market, consider subscribing to industry newsletters, following relevant companies and organizations, or regularly checking reputable industry news sources and publications.
Methodology
Step 1 - Identification of Relevant Samples Size from Population Database


Step 2 - Approaches for Defining Global Market Size (Value, Volume* & Price*)

Note*: In applicable scenarios
Step 3 - Data Sources
Primary Research
- Web Analytics
- Survey Reports
- Research Institute
- Latest Research Reports
- Opinion Leaders
Secondary Research
- Annual Reports
- White Paper
- Latest Press Release
- Industry Association
- Paid Database
- Investor Presentations

Step 4 - Data Triangulation
Involves using different sources of information in order to increase the validity of a study
These sources are likely to be stakeholders in a program - participants, other researchers, program staff, other community members, and so on.
Then we put all data in single framework & apply various statistical tools to find out the dynamic on the market.
During the analysis stage, feedback from the stakeholder groups would be compared to determine areas of agreement as well as areas of divergence
