

Key Insights
The United States proximity sensor market is experiencing substantial growth, driven by widespread automation adoption across key industries. The market is projected to reach a size of $9.26 billion by the base year 2025, with a significant Compound Annual Growth Rate (CAGR) of 13.35%. This expansion is primarily fueled by increasing demand for industrial automation in manufacturing and logistics, enhancing process efficiency and safety. The automotive sector is also a key contributor, integrating proximity sensors for advanced driver-assistance systems (ADAS) and autonomous driving capabilities. Furthermore, the burgeoning consumer electronics market, with proximity sensor integration in smartphones, wearables, and smart devices, presents additional growth avenues.
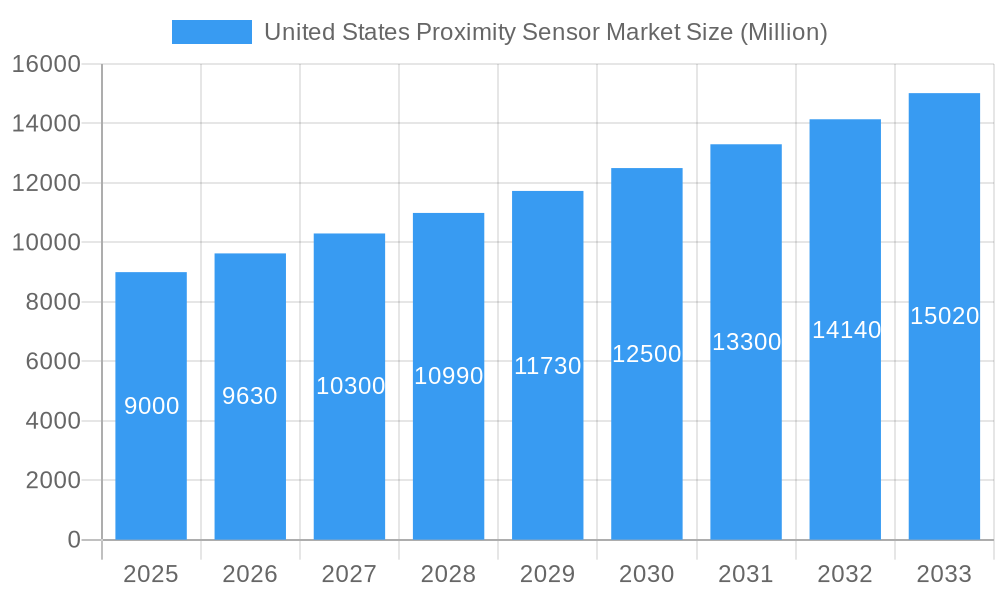
United States Proximity Sensor Market Market Size (In Billion)
The market is segmented by technology (inductive, capacitive, photoelectric, magnetic, ultrasonic), channel type (single, multi-channel), and end-user application. Capacitive and photoelectric sensors are expected to maintain market leadership due to their adaptability and cost-efficiency. The multi-channel segment is anticipated to exhibit accelerated growth, driven by sophisticated applications requiring simultaneous multi-point monitoring.
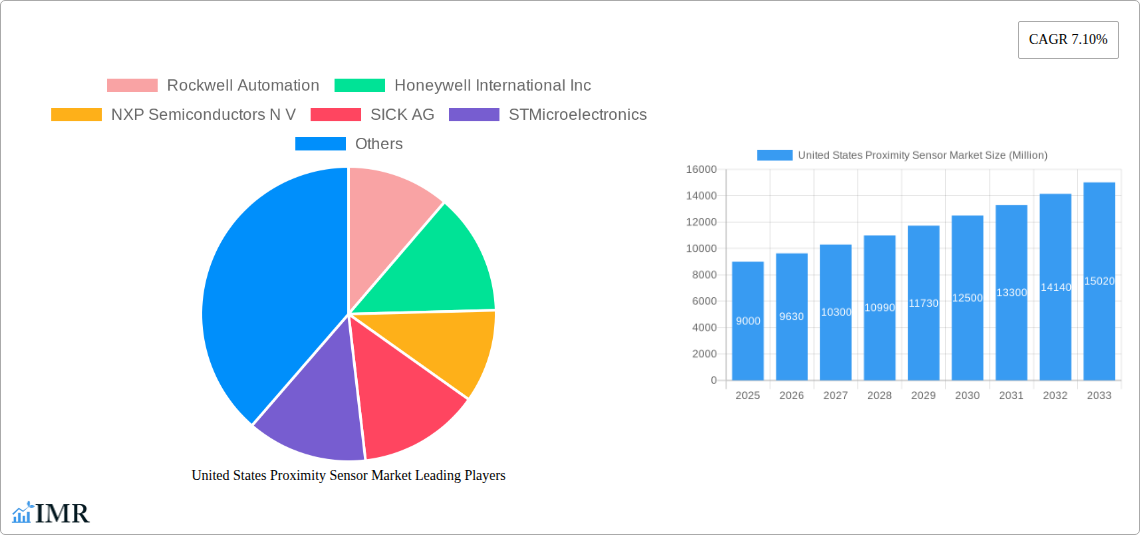
United States Proximity Sensor Market Company Market Share
Despite positive growth prospects, the market faces challenges including supply chain volatility and fluctuating raw material costs. Evolving technological landscapes and the emergence of novel sensor technologies may also pose competitive hurdles for established vendors. However, the overall outlook remains robust, supported by ongoing automation trends, the proliferation of connected devices, and continuous innovation in sensor applications across diverse sectors. Leading market participants, including Rockwell Automation, Honeywell, NXP Semiconductors, and SICK AG, are strategically leveraging innovation and partnerships to capitalize on emerging opportunities. The market's segmentation is likely to evolve further with the integration of Artificial Intelligence (AI) and the Internet of Things (IoT), creating demand for specialized and integrated sensing solutions.
United States Proximity Sensor Market: A Comprehensive Analysis (2019-2033)
This in-depth report provides a comprehensive analysis of the United States proximity sensor market, encompassing market dynamics, growth trends, regional segmentation, product landscape, key players, and future outlook. The study period covers 2019-2033, with 2025 as the base year and forecast period spanning 2025-2033. The report leverages extensive primary and secondary research to deliver actionable insights for industry professionals, investors, and strategic decision-makers. The parent market is the broader United States sensor market, while the child market focuses specifically on proximity sensors. Market size is presented in million units.
United States Proximity Sensor Market Market Dynamics & Structure
The US proximity sensor market is characterized by moderate concentration, with several major players holding significant market share. Technological innovation, driven by the increasing demand for automation and smart devices, is a key growth driver. Stringent regulatory frameworks regarding safety and performance standards influence market dynamics. Competitive product substitutes, such as vision systems, exist but often lack the cost-effectiveness and simplicity of proximity sensors. End-user demographics are diverse, encompassing various industries with varying technological adoption rates. M&A activity has been moderate, with strategic acquisitions aiming to expand product portfolios and geographical reach.
- Market Concentration: Moderately concentrated, with top 5 players holding approximately xx% market share in 2025.
- Technological Innovation: Focus on miniaturization, improved accuracy, and integration with IoT platforms.
- Regulatory Landscape: Compliance with safety standards (e.g., UL, CE) is crucial.
- Competitive Substitutes: Vision systems and other sensing technologies offer limited competition.
- M&A Activity: xx major M&A deals recorded between 2019 and 2024, primarily focused on expanding product lines and market reach.
- End-User Demographics: Strong demand from Industrial Automation, Automotive, and Consumer Electronics sectors.
United States Proximity Sensor Market Growth Trends & Insights
The US proximity sensor market exhibited steady growth during the historical period (2019-2024), driven by increasing automation across diverse industries. The market size reached xx million units in 2024 and is projected to reach xx million units by 2033, exhibiting a CAGR of xx% during the forecast period (2025-2033). Technological disruptions, such as the adoption of advanced sensor technologies (e.g., LiDAR, time-of-flight sensors), are reshaping market dynamics. Consumer behavior shifts towards smart devices and connected ecosystems are boosting demand in consumer electronics and automotive applications. Increased adoption of Industry 4.0 principles further fuels market growth.
Dominant Regions, Countries, or Segments in United States Proximity Sensor Market
The industrial automation sector currently dominates the US proximity sensor market, accounting for approximately xx% of total market share in 2025. The automotive industry is another significant contributor, driven by the increasing demand for Advanced Driver-Assistance Systems (ADAS). Within technology segments, inductive and capacitive sensors hold the largest market share, followed by photoelectric sensors. Geographically, the Midwest and South regions demonstrate strong growth potential due to substantial manufacturing activities and industrial hubs.
- Dominant End-User: Industrial Automation (xx%), Automotive (xx%).
- Dominant Technology: Inductive (xx%), Capacitive (xx%), Photoelectric (xx%).
- Dominant Region: Midwest and Southern US regions show significant growth.
- Key Growth Drivers: Rising automation needs across industries, technological advancements, government initiatives promoting industrial modernization.
United States Proximity Sensor Market Product Landscape
Proximity sensors are undergoing continuous innovation, with a focus on enhancing accuracy, reliability, and integration capabilities. New product offerings emphasize smaller form factors, improved signal processing, and enhanced environmental resilience. Unique selling propositions often include advanced features such as built-in diagnostics, communication protocols (e.g., IO-Link), and customized sensing ranges. Technological advancements in materials science and microelectronics drive improvements in performance metrics such as detection range, response time, and power consumption.
Key Drivers, Barriers & Challenges in United States Proximity Sensor Market
Key Drivers:
- Increasing automation across industries.
- Growing demand for advanced automation in manufacturing and logistics.
- Technological advancements leading to improved sensor performance and functionalities.
- Government initiatives promoting industrial modernization and smart manufacturing.
Key Challenges:
- Intense competition from established and emerging players.
- Supply chain disruptions impacting component availability and pricing.
- Stringent regulatory compliance requirements for safety and performance.
- The need for continuous innovation to meet evolving customer needs. The impact of supply chain issues on market growth is estimated to be xx% in 2025.
Emerging Opportunities in United States Proximity Sensor Market
- Growing demand for proximity sensors in robotics and automation.
- Expansion of applications in healthcare, medical devices, and smart home technologies.
- Development of sensor fusion technologies for enhanced object detection and localization.
- Opportunities in the burgeoning IoT market for connected and smart devices.
Growth Accelerators in the United States Proximity Sensor Market Industry
Technological breakthroughs in sensor materials, signal processing, and communication protocols are key growth accelerators. Strategic partnerships between sensor manufacturers and system integrators are facilitating market penetration and product adoption. Government support for automation and Industry 4.0 initiatives is fostering market expansion. The focus on developing next-generation sensors with improved accuracy, reliability and power consumption will be crucial for sustained growth.
Key Players Shaping the United States Proximity Sensor Market Market
Notable Milestones in United States Proximity Sensor Market Sector
- 2021 Q3: Introduction of a new generation of ultrasonic sensors with enhanced accuracy by SICK AG.
- 2022 Q1: Strategic partnership between Honeywell and a major automotive manufacturer to develop customized proximity sensors for ADAS.
- 2023 Q2: Acquisition of a smaller sensor technology company by Rockwell Automation to expand its product portfolio.
- Further milestones to be included based on available data.
In-Depth United States Proximity Sensor Market Market Outlook
The US proximity sensor market is poised for continued growth, driven by the increasing adoption of automation technologies across diverse industries. Strategic investments in R&D, focus on innovative product development, and expansion into new application areas will be critical for sustained market success. The market is expected to be significantly influenced by advancements in AI and machine learning technologies, enabling more sophisticated sensing capabilities. Furthermore, the growing focus on sustainability and energy efficiency will drive demand for low-power, high-performance proximity sensors.
United States Proximity Sensor Market Segmentation
-
1. Technology
- 1.1. Inductive
- 1.2. Capacitive
- 1.3. Photoelectric
- 1.4. Magnetic
- 1.5. Ultrasonic
- 1.6. Other Technology
-
2. Channel Type
- 2.1. Single Channel
- 2.2. Multi-Channel
-
3. End-User
- 3.1. Aerospace and Defense
- 3.2. Automotive
- 3.3. Industrial Automation
- 3.4. Consumer Electronics
- 3.5. Food & Beverage
- 3.6. Pharmaceutical
- 3.7. Construction
- 3.8. Energy
- 3.9. Other End-users
United States Proximity Sensor Market Segmentation By Geography
- 1. United States
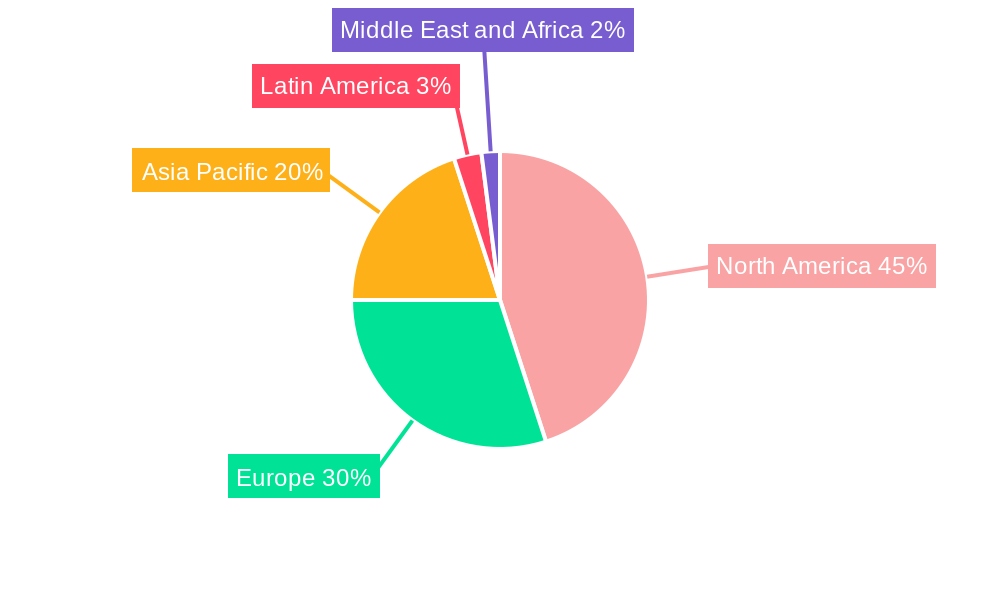
United States Proximity Sensor Market Regional Market Share
Geographic Coverage of United States Proximity Sensor Market
United States Proximity Sensor Market REPORT HIGHLIGHTS
| Aspects | Details |
|---|---|
| Study Period | 2020-2034 |
| Base Year | 2025 |
| Estimated Year | 2026 |
| Forecast Period | 2026-2034 |
| Historical Period | 2020-2025 |
| Growth Rate | CAGR of 13.35% from 2020-2034 |
| Segmentation |
|
Table of Contents
- 1. Introduction
- 1.1. Research Scope
- 1.2. Market Segmentation
- 1.3. Research Objective
- 1.4. Definitions and Assumptions
- 2. Executive Summary
- 2.1. Market Snapshot
- 3. Market Dynamics
- 3.1. Market Drivers
- 3.2. Market Restrains
- 3.3. Market Trends
- 3.4. Market Opportunities
- 4. Market Factor Analysis
- 4.1. Porters Five Forces
- 4.1.1. Bargaining Power of Suppliers
- 4.1.2. Bargaining Power of Buyers
- 4.1.3. Threat of New Entrants
- 4.1.4. Threat of Substitutes
- 4.1.5. Competitive Rivalry
- 4.2. PESTEL analysis
- 4.3. BCG Analysis
- 4.3.1. Stars (High Growth, High Market Share)
- 4.3.2. Cash Cows (Low Growth, High Market Share)
- 4.3.3. Question Mark (High Growth, Low Market Share)
- 4.3.4. Dogs (Low Growth, Low Market Share)
- 4.4. Ansoff Matrix Analysis
- 4.5. Supply Chain Analysis
- 4.6. Regulatory Landscape
- 4.7. Current Market Potential and Opportunity Assessment (TAM–SAM–SOM Framework)
- 4.8. IMR Analyst Note
- 4.1. Porters Five Forces
- 5. Market Analysis, Insights and Forecast 2021-2033
- 5.1. Market Analysis, Insights and Forecast - by Technology
- 5.1.1. Inductive
- 5.1.2. Capacitive
- 5.1.3. Photoelectric
- 5.1.4. Magnetic
- 5.1.5. Ultrasonic
- 5.1.6. Other Technology
- 5.2. Market Analysis, Insights and Forecast - by Channel Type
- 5.2.1. Single Channel
- 5.2.2. Multi-Channel
- 5.3. Market Analysis, Insights and Forecast - by End-User
- 5.3.1. Aerospace and Defense
- 5.3.2. Automotive
- 5.3.3. Industrial Automation
- 5.3.4. Consumer Electronics
- 5.3.5. Food & Beverage
- 5.3.6. Pharmaceutical
- 5.3.7. Construction
- 5.3.8. Energy
- 5.3.9. Other End-users
- 5.4. Market Analysis, Insights and Forecast - by Region
- 5.4.1. United States
- 5.1. Market Analysis, Insights and Forecast - by Technology
- 6. United States Proximity Sensor Market Analysis, Insights and Forecast, 2021-2033
- 6.1. Market Analysis, Insights and Forecast - by Technology
- 6.1.1. Inductive
- 6.1.2. Capacitive
- 6.1.3. Photoelectric
- 6.1.4. Magnetic
- 6.1.5. Ultrasonic
- 6.1.6. Other Technology
- 6.2. Market Analysis, Insights and Forecast - by Channel Type
- 6.2.1. Single Channel
- 6.2.2. Multi-Channel
- 6.3. Market Analysis, Insights and Forecast - by End-User
- 6.3.1. Aerospace and Defense
- 6.3.2. Automotive
- 6.3.3. Industrial Automation
- 6.3.4. Consumer Electronics
- 6.3.5. Food & Beverage
- 6.3.6. Pharmaceutical
- 6.3.7. Construction
- 6.3.8. Energy
- 6.3.9. Other End-users
- 6.1. Market Analysis, Insights and Forecast - by Technology
- 7. Competitive Analysis
- 7.1. Company Profiles
- 7.1.1 Rockwell Automation
- 7.1.1.1. Company Overview
- 7.1.1.2. Products
- 7.1.1.3. Company Financials
- 7.1.1.4. SWOT Analysis
- 7.1.2 Honeywell International Inc
- 7.1.2.1. Company Overview
- 7.1.2.2. Products
- 7.1.2.3. Company Financials
- 7.1.2.4. SWOT Analysis
- 7.1.3 NXP Semiconductors N V
- 7.1.3.1. Company Overview
- 7.1.3.2. Products
- 7.1.3.3. Company Financials
- 7.1.3.4. SWOT Analysis
- 7.1.4 SICK AG
- 7.1.4.1. Company Overview
- 7.1.4.2. Products
- 7.1.4.3. Company Financials
- 7.1.4.4. SWOT Analysis
- 7.1.5 STMicroelectronics
- 7.1.5.1. Company Overview
- 7.1.5.2. Products
- 7.1.5.3. Company Financials
- 7.1.5.4. SWOT Analysis
- 7.1.6 Schneider Electric
- 7.1.6.1. Company Overview
- 7.1.6.2. Products
- 7.1.6.3. Company Financials
- 7.1.6.4. SWOT Analysis
- 7.1.7 OMRON Corporation
- 7.1.7.1. Company Overview
- 7.1.7.2. Products
- 7.1.7.3. Company Financials
- 7.1.7.4. SWOT Analysis
- 7.1.8 Panasonic Corporation
- 7.1.8.1. Company Overview
- 7.1.8.2. Products
- 7.1.8.3. Company Financials
- 7.1.8.4. SWOT Analysis
- 7.1.9 General Electric*List Not Exhaustive
- 7.1.9.1. Company Overview
- 7.1.9.2. Products
- 7.1.9.3. Company Financials
- 7.1.9.4. SWOT Analysis
- 7.1.1 Rockwell Automation
- 7.2. Market Entropy
- 7.2.1 Company's Key Areas Served
- 7.2.2 Recent Developments
- 7.3. Company Market Share Analysis 2025
- 7.3.1 Top 5 Companies Market Share Analysis
- 7.3.2 Top 3 Companies Market Share Analysis
- 7.4. List of Potential Customers
- 8. Research Methodology
List of Figures
- Figure 1: United States Proximity Sensor Market Revenue Breakdown (billion, %) by Product 2025 & 2033
- Figure 2: United States Proximity Sensor Market Share (%) by Company 2025
List of Tables
- Table 1: United States Proximity Sensor Market Revenue billion Forecast, by Technology 2020 & 2033
- Table 2: United States Proximity Sensor Market Revenue billion Forecast, by Channel Type 2020 & 2033
- Table 3: United States Proximity Sensor Market Revenue billion Forecast, by End-User 2020 & 2033
- Table 4: United States Proximity Sensor Market Revenue billion Forecast, by Region 2020 & 2033
- Table 5: United States Proximity Sensor Market Revenue billion Forecast, by Technology 2020 & 2033
- Table 6: United States Proximity Sensor Market Revenue billion Forecast, by Channel Type 2020 & 2033
- Table 7: United States Proximity Sensor Market Revenue billion Forecast, by End-User 2020 & 2033
- Table 8: United States Proximity Sensor Market Revenue billion Forecast, by Country 2020 & 2033
Frequently Asked Questions
1. What is the projected Compound Annual Growth Rate (CAGR) of the United States Proximity Sensor Market?
The projected CAGR is approximately 13.35%.
2. Which companies are prominent players in the United States Proximity Sensor Market?
Key companies in the market include Rockwell Automation, Honeywell International Inc, NXP Semiconductors N V, SICK AG, STMicroelectronics, Schneider Electric, OMRON Corporation, Panasonic Corporation, General Electric*List Not Exhaustive.
3. What are the main segments of the United States Proximity Sensor Market?
The market segments include Technology, Channel Type, End-User.
4. Can you provide details about the market size?
The market size is estimated to be USD 9.26 billion as of 2022.
5. What are some drivers contributing to market growth?
; Growth in Industrial Automation; Increase in the Demand for Inductive Sensing Technology; Expansion of Automotive Sensing Applications.
6. What are the notable trends driving market growth?
The Automotive Segment is Expected to Drive the Market's Growth.
7. Are there any restraints impacting market growth?
Design Comlexity & Reliability.
8. Can you provide examples of recent developments in the market?
N/A
9. What pricing options are available for accessing the report?
Pricing options include single-user, multi-user, and enterprise licenses priced at USD 3800, USD 4500, and USD 5800 respectively.
10. Is the market size provided in terms of value or volume?
The market size is provided in terms of value, measured in billion.
11. Are there any specific market keywords associated with the report?
Yes, the market keyword associated with the report is "United States Proximity Sensor Market," which aids in identifying and referencing the specific market segment covered.
12. How do I determine which pricing option suits my needs best?
The pricing options vary based on user requirements and access needs. Individual users may opt for single-user licenses, while businesses requiring broader access may choose multi-user or enterprise licenses for cost-effective access to the report.
13. Are there any additional resources or data provided in the United States Proximity Sensor Market report?
While the report offers comprehensive insights, it's advisable to review the specific contents or supplementary materials provided to ascertain if additional resources or data are available.
14. How can I stay updated on further developments or reports in the United States Proximity Sensor Market?
To stay informed about further developments, trends, and reports in the United States Proximity Sensor Market, consider subscribing to industry newsletters, following relevant companies and organizations, or regularly checking reputable industry news sources and publications.
Methodology
Step 1 - Identification of Relevant Samples Size from Population Database


Step 2 - Approaches for Defining Global Market Size (Value, Volume* & Price*)

Note*: In applicable scenarios
Step 3 - Data Sources
Primary Research
- Web Analytics
- Survey Reports
- Research Institute
- Latest Research Reports
- Opinion Leaders
Secondary Research
- Annual Reports
- White Paper
- Latest Press Release
- Industry Association
- Paid Database
- Investor Presentations

Step 4 - Data Triangulation
Involves using different sources of information in order to increase the validity of a study
These sources are likely to be stakeholders in a program - participants, other researchers, program staff, other community members, and so on.
Then we put all data in single framework & apply various statistical tools to find out the dynamic on the market.
During the analysis stage, feedback from the stakeholder groups would be compared to determine areas of agreement as well as areas of divergence