

Key Insights
The global urea market is poised for sustained growth, projected to reach 178.8 million by 2025, with a compound annual growth rate (CAGR) of 0.9. This expansion is primarily driven by the escalating demand for fertilizers to support increased agricultural output for a burgeoning global population. Innovations in urea technology, including controlled-release and water-soluble formulations, are enhancing efficiency and environmental sustainability. The market’s broad application across field crops, horticultural crops, turf, and ornamentals, coupled with diverse product formulations, underscores its adaptability and widespread use in agriculture.
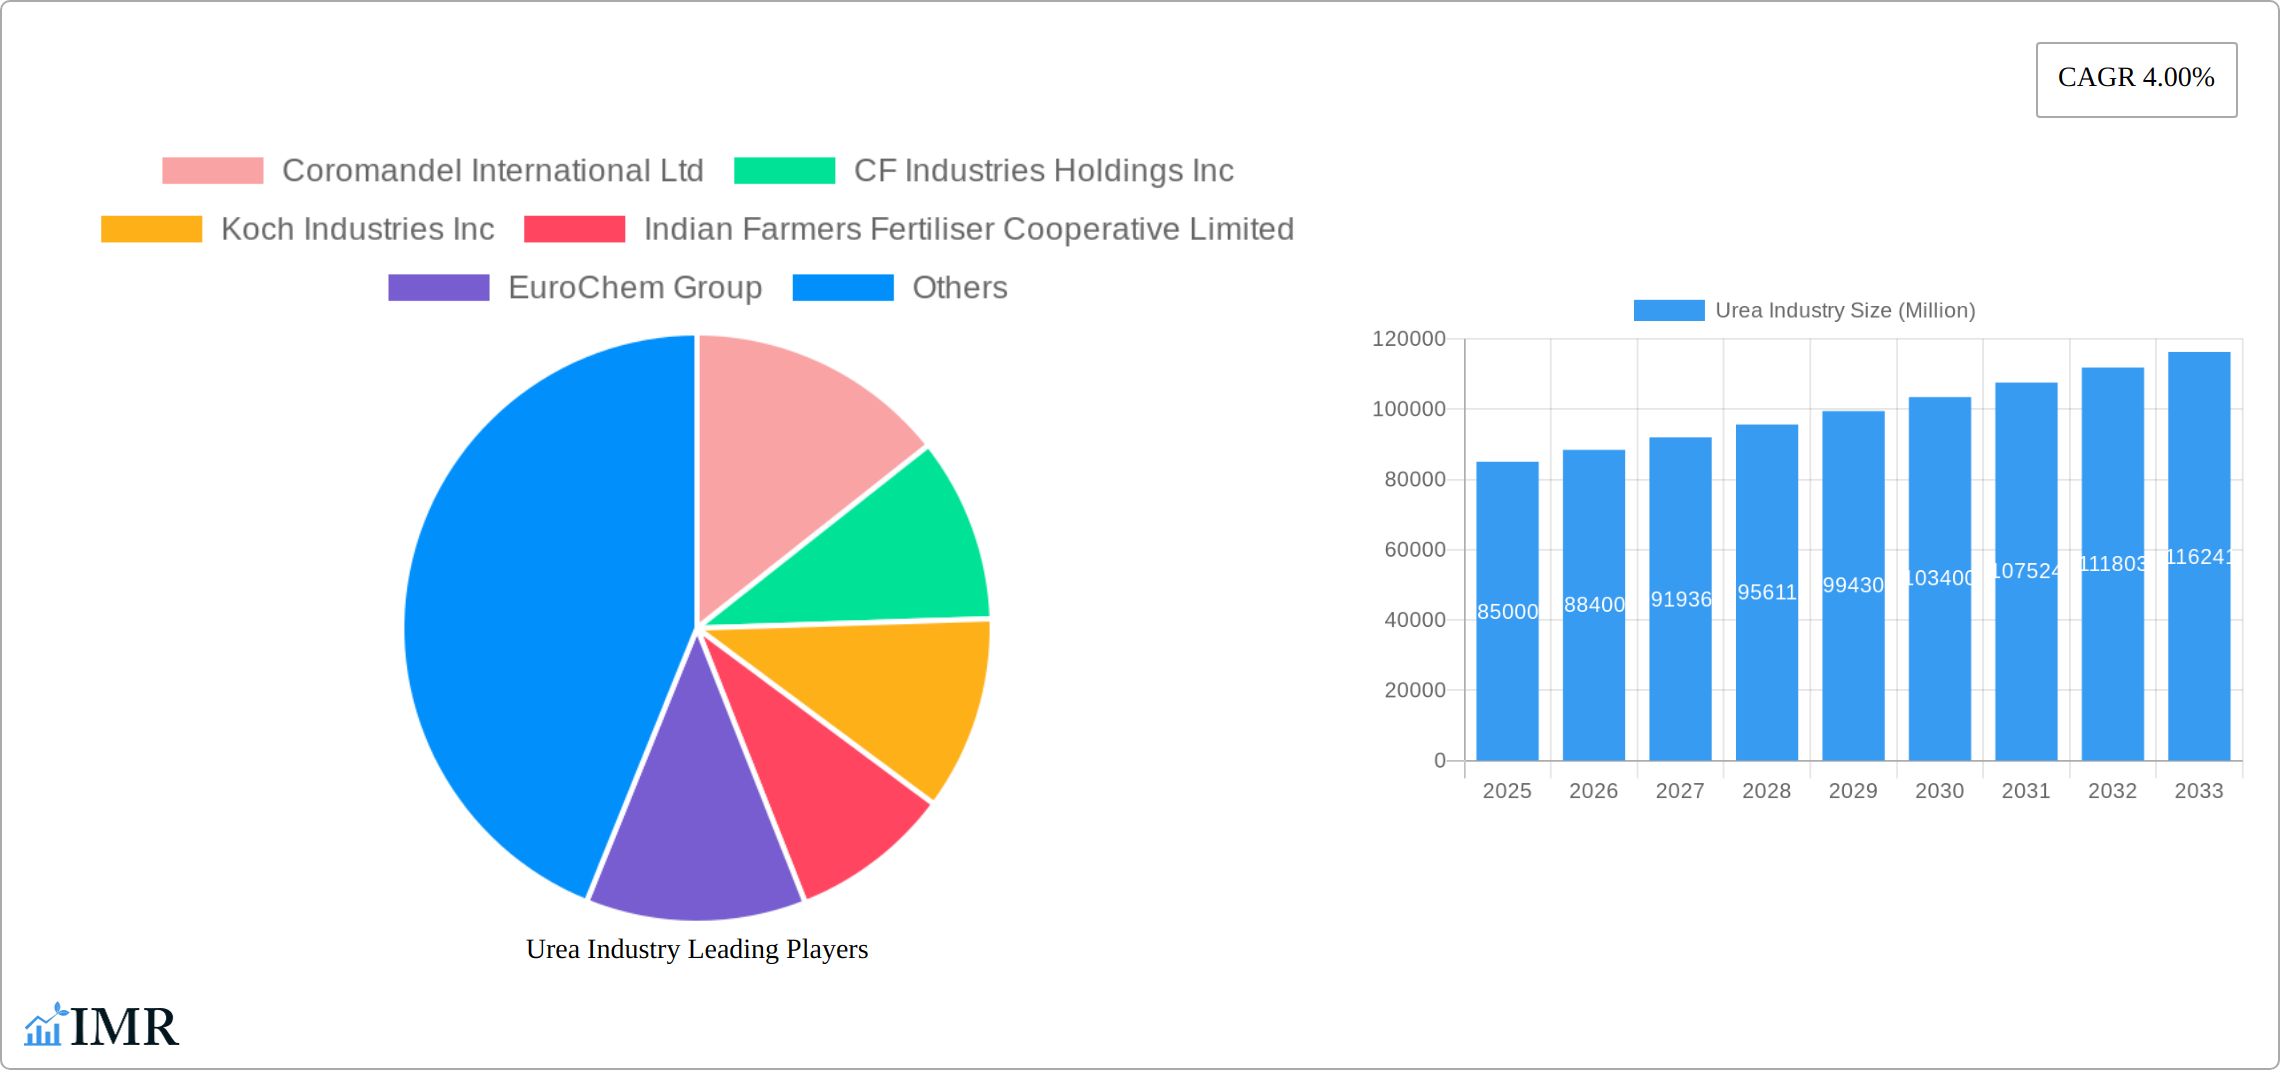
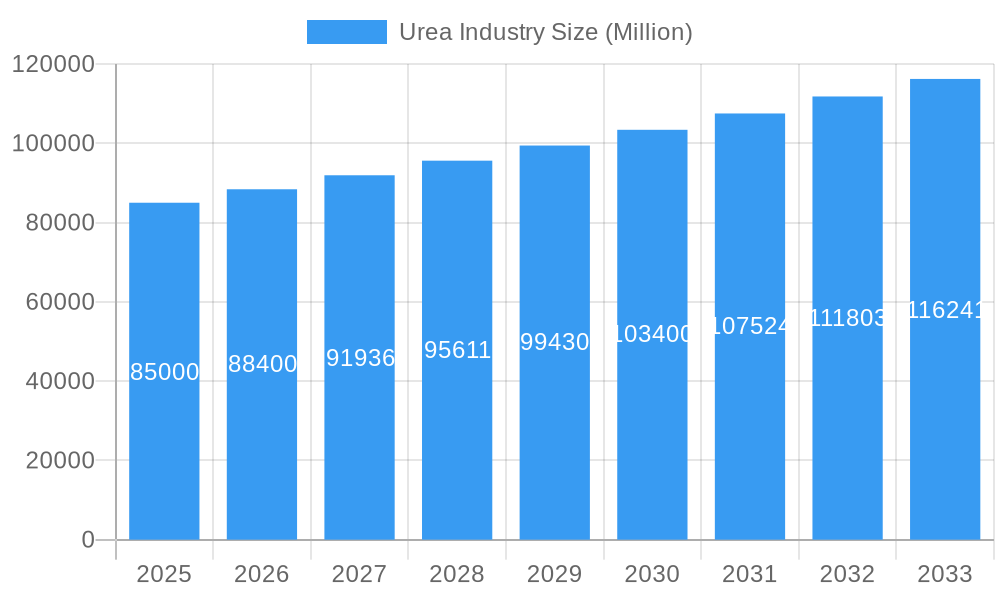
Urea Industry Market Size (In Million)
Challenges such as volatile raw material costs, especially natural gas, and stringent environmental regulations necessitate strategic adaptation. Leading companies are investing in sustainable production, alternative feedstocks, process optimization, and advanced nutrient-efficient formulations. Diversification across crop types and formulations is a key strategy for navigating market dynamics. The competitive landscape, marked by global and regional players, fosters both price competition and technological advancement.
Urea Industry Company Market Share
Urea Industry: A Comprehensive Market Report (2019-2033)
This comprehensive report provides a detailed analysis of the global urea industry, encompassing market dynamics, growth trends, regional performance, product landscape, and key players. The study period covers 2019-2033, with 2025 as the base year and forecast period extending to 2033. The report offers invaluable insights for industry professionals, investors, and stakeholders seeking to navigate this dynamic market. The total market value in 2025 is estimated at xx Million.
Urea Industry Market Dynamics & Structure
The urea market exhibits moderate concentration, with several key players commanding substantial market share. Technological advancements, particularly those enhancing efficiency and sustainability, are pivotal drivers. Stringent environmental regulations, varying geographically, significantly influence production and distribution. Competition from substitute fertilizers, such as ammonium nitrate, introduces further complexity. The end-user base is heavily reliant on agricultural applications, with a burgeoning segment dedicated to specialty crops and the adoption of precision farming techniques. Mergers and acquisitions (M&A) activity remains frequent, primarily fueled by the pursuit of expanded market reach, improved production capabilities, and secure access to essential raw materials. The increasing global focus on food security and sustainable agricultural practices further shapes market dynamics.
- Market Concentration: Moderately concentrated, with the top 5 players holding approximately [Insert Percentage]% of the global market share in 2025. This concentration is expected to [Increase/Decrease/Remain Stable] in the coming years due to [Explain the reason, e.g., increased consolidation, emergence of new players, etc.].
- Technological Innovation: Emphasis on energy efficiency, emission reduction, and the development of controlled-release formulations. Research and development efforts are focused on [Specific examples of innovations, e.g., new coating technologies, improved granulation processes].
- Regulatory Framework: Stringent environmental regulations in developed markets are prompting investments in cleaner technologies and sustainable production methods. Compliance costs and carbon footprint reduction are becoming increasingly important factors.
- Competitive Substitutes: Ammonium nitrate and other nitrogen fertilizers present a competitive challenge. The urea market's competitiveness is also influenced by [Mention other factors like pricing strategies, government subsidies, etc.].
- End-User Demographics: Primarily agricultural, with increasing demand from horticultural and turf & ornamental sectors. The growth in these segments is driven by [Explain driving factors like landscaping trends, urban gardening, etc.].
- M&A Trends: Significant activity in recent years, with a total deal volume exceeding [Insert Amount] Million in the period 2019-2024, indicating a [Trend - e.g., consolidating, growing, stabilizing] market.
Urea Industry Growth Trends & Insights
The global urea market displayed consistent growth during the historical period (2019-2024), fueled by expanding agricultural production, particularly in developing economies. The market size is projected to reach [Insert Amount] Million by 2033, exhibiting a CAGR of [Insert Percentage]% during the forecast period (2025-2033). Technological advancements, such as more efficient fertilizer application techniques and the rise of precision farming, are further boosting growth. Consumer behavior shifts toward sustainable agricultural practices, coupled with rising food demand and population growth, significantly contribute to market expansion. The increasing adoption of water-soluble and controlled-release formulations is driving growth within the specialty segment, offering benefits such as [Mention specific benefits like reduced nutrient loss, improved nutrient uptake].
Dominant Regions, Countries, or Segments in Urea Industry
Asia-Pacific currently leads in urea consumption, driven by extensive agricultural activities and increasing food production demands. India and China remain major contributors within this region. The field crops segment dominates the overall market; however, the horticultural crops and turf & ornamental segments exhibit substantial growth potential. The rising demand for high-efficiency fertilizers is fueling significant growth within the specialty urea segment (e.g., CRF, water-soluble), offering advantages like [Mention specific advantages like targeted nutrient delivery, improved crop yields].
- Key Drivers: Strong agricultural sector growth in Asia-Pacific; increasing global demand for specialty fertilizers; supportive government policies in several regions promoting sustainable agriculture.
- Dominance Factors: Large agricultural land areas in Asia; robust economic growth in several developing countries; favorable climatic conditions in certain regions.
- Growth Potential: High potential in developing countries and in segments targeting specialty crops and precision agriculture. The water-soluble segment is expected to grow at a CAGR of [Insert Percentage]% during the forecast period, driven by [Mention reasons like improved nutrient use efficiency, reduced environmental impact].
Urea Industry Product Landscape
The urea product landscape is diverse, ranging from conventional granular urea to specialized formulations like controlled-release fertilizers (CRF), slow-release fertilizers (SRF), and water-soluble fertilizers. Recent innovations focus on enhancing nutrient use efficiency, improving fertilizer application methods, and reducing environmental impact. Unique selling propositions include improved nutrient uptake, reduced leaching, and targeted delivery to the plant roots. Technological advancements in coating technologies and fertilizer blending are pivotal to this evolution.
Key Drivers, Barriers & Challenges in Urea Industry
Key Drivers: Rising global food demand, increasing agricultural intensity, government support for agricultural development, and advancements in fertilizer technology.
Challenges & Restraints: Volatility in raw material prices (natural gas), environmental regulations, competition from substitute fertilizers, and supply chain disruptions causing price fluctuations (estimated impact: xx Million reduction in market value in 2024).
Emerging Opportunities in Urea Industry
Untapped markets in Africa and Latin America present significant growth opportunities. The increasing emphasis on sustainable agriculture is creating demand for eco-friendly urea formulations and production methods. Innovative applications, such as bio-based fertilizers and nano-fertilizers, are emerging, offering potential for [Mention potential benefits, e.g., enhanced nutrient uptake, reduced environmental footprint]. Furthermore, opportunities exist in developing [Mention specific niches, e.g., organic farming, vertical farming].
Growth Accelerators in the Urea Industry Industry
Technological breakthroughs in controlled-release technology and precision application are significant growth drivers. Strategic partnerships between fertilizer producers and agricultural technology companies are streamlining distribution and improving efficiency. Expansion into new markets and the development of specialized formulations cater to specific crop needs.
Key Players Shaping the Urea Industry Market
- Coromandel International Ltd
- CF Industries Holdings Inc
- Koch Industries Inc
- Indian Farmers Fertiliser Cooperative Limited
- EuroChem Group
- SABIC Agri-Nutrients Co
- Yara International AS
- OCI NV
- Nutrien Ltd
Notable Milestones in Urea Industry Sector
- April 2023: SABIC Agri-Nutrients Company acquired a 49% stake in ETG Inputs Holdco Limited for USD 320 Million, expanding its value chain integration and strengthening its market position.
- March 2022: EuroChem Group purchased 51.48% of Fertilizantes Heringer SA, strengthening its Brazilian distribution network and enhancing its reach in a key agricultural market.
- January 2022: Yara and Lantmännen partnered to commercialize "green" fertilizers produced using renewable energy, highlighting the growing importance of sustainability in the industry.
- [Add more recent milestones with brief descriptions and impact]
In-Depth Urea Industry Market Outlook
The urea market is poised for continued growth, driven by several factors. Technological innovations focused on sustainability and efficiency, coupled with increasing demand from emerging markets, will significantly shape future market dynamics. Strategic partnerships and investments in research and development will further strengthen the industry's long-term potential. The development and adoption of specialized urea formulations tailored to specific crop needs and farming practices will drive premium segment expansion.
Urea Industry Segmentation
- 1. Production Analysis
- 2. Consumption Analysis
- 3. Import Market Analysis (Value & Volume)
- 4. Export Market Analysis (Value & Volume)
- 5. Price Trend Analysis
Urea Industry Segmentation By Geography
-
1. North America
- 1.1. United States
- 1.2. Canada
- 1.3. Mexico
-
2. South America
- 2.1. Brazil
- 2.2. Argentina
- 2.3. Rest of South America
-
3. Europe
- 3.1. United Kingdom
- 3.2. Germany
- 3.3. France
- 3.4. Italy
- 3.5. Spain
- 3.6. Russia
- 3.7. Benelux
- 3.8. Nordics
- 3.9. Rest of Europe
-
4. Middle East & Africa
- 4.1. Turkey
- 4.2. Israel
- 4.3. GCC
- 4.4. North Africa
- 4.5. South Africa
- 4.6. Rest of Middle East & Africa
-
5. Asia Pacific
- 5.1. China
- 5.2. India
- 5.3. Japan
- 5.4. South Korea
- 5.5. ASEAN
- 5.6. Oceania
- 5.7. Rest of Asia Pacific
Urea Industry Regional Market Share
Geographic Coverage of Urea Industry
Urea Industry REPORT HIGHLIGHTS
| Aspects | Details |
|---|---|
| Study Period | 2020-2034 |
| Base Year | 2025 |
| Estimated Year | 2026 |
| Forecast Period | 2026-2034 |
| Historical Period | 2020-2025 |
| Growth Rate | CAGR of 0.9% from 2020-2034 |
| Segmentation |
|
Table of Contents
- 1. Introduction
- 1.1. Research Scope
- 1.2. Market Segmentation
- 1.3. Research Objective
- 1.4. Definitions and Assumptions
- 2. Executive Summary
- 2.1. Market Snapshot
- 3. Market Dynamics
- 3.1. Market Drivers
- 3.2. Market Restrains
- 3.3. Market Trends
- 3.4. Market Opportunities
- 4. Market Factor Analysis
- 4.1. Porters Five Forces
- 4.1.1. Bargaining Power of Suppliers
- 4.1.2. Bargaining Power of Buyers
- 4.1.3. Threat of New Entrants
- 4.1.4. Threat of Substitutes
- 4.1.5. Competitive Rivalry
- 4.2. PESTEL analysis
- 4.3. BCG Analysis
- 4.3.1. Stars (High Growth, High Market Share)
- 4.3.2. Cash Cows (Low Growth, High Market Share)
- 4.3.3. Question Mark (High Growth, Low Market Share)
- 4.3.4. Dogs (Low Growth, Low Market Share)
- 4.4. Ansoff Matrix Analysis
- 4.5. Supply Chain Analysis
- 4.6. Regulatory Landscape
- 4.7. Current Market Potential and Opportunity Assessment (TAM–SAM–SOM Framework)
- 4.8. IMR Analyst Note
- 4.1. Porters Five Forces
- 5. Market Analysis, Insights and Forecast 2021-2033
- 5.1. Market Analysis, Insights and Forecast - by Production Analysis
- 5.2. Market Analysis, Insights and Forecast - by Consumption Analysis
- 5.3. Market Analysis, Insights and Forecast - by Import Market Analysis (Value & Volume)
- 5.4. Market Analysis, Insights and Forecast - by Export Market Analysis (Value & Volume)
- 5.5. Market Analysis, Insights and Forecast - by Price Trend Analysis
- 5.6. Market Analysis, Insights and Forecast - by Region
- 5.6.1. North America
- 5.6.2. South America
- 5.6.3. Europe
- 5.6.4. Middle East & Africa
- 5.6.5. Asia Pacific
- 6. Global Urea Industry Analysis, Insights and Forecast, 2021-2033
- 6.1. Market Analysis, Insights and Forecast - by Production Analysis
- 6.2. Market Analysis, Insights and Forecast - by Consumption Analysis
- 6.3. Market Analysis, Insights and Forecast - by Import Market Analysis (Value & Volume)
- 6.4. Market Analysis, Insights and Forecast - by Export Market Analysis (Value & Volume)
- 6.5. Market Analysis, Insights and Forecast - by Price Trend Analysis
- 7. North America Urea Industry Analysis, Insights and Forecast, 2020-2032
- 7.1. Market Analysis, Insights and Forecast - by Production Analysis
- 7.2. Market Analysis, Insights and Forecast - by Consumption Analysis
- 7.3. Market Analysis, Insights and Forecast - by Import Market Analysis (Value & Volume)
- 7.4. Market Analysis, Insights and Forecast - by Export Market Analysis (Value & Volume)
- 7.5. Market Analysis, Insights and Forecast - by Price Trend Analysis
- 8. South America Urea Industry Analysis, Insights and Forecast, 2020-2032
- 8.1. Market Analysis, Insights and Forecast - by Production Analysis
- 8.2. Market Analysis, Insights and Forecast - by Consumption Analysis
- 8.3. Market Analysis, Insights and Forecast - by Import Market Analysis (Value & Volume)
- 8.4. Market Analysis, Insights and Forecast - by Export Market Analysis (Value & Volume)
- 8.5. Market Analysis, Insights and Forecast - by Price Trend Analysis
- 9. Europe Urea Industry Analysis, Insights and Forecast, 2020-2032
- 9.1. Market Analysis, Insights and Forecast - by Production Analysis
- 9.2. Market Analysis, Insights and Forecast - by Consumption Analysis
- 9.3. Market Analysis, Insights and Forecast - by Import Market Analysis (Value & Volume)
- 9.4. Market Analysis, Insights and Forecast - by Export Market Analysis (Value & Volume)
- 9.5. Market Analysis, Insights and Forecast - by Price Trend Analysis
- 10. Middle East & Africa Urea Industry Analysis, Insights and Forecast, 2020-2032
- 10.1. Market Analysis, Insights and Forecast - by Production Analysis
- 10.2. Market Analysis, Insights and Forecast - by Consumption Analysis
- 10.3. Market Analysis, Insights and Forecast - by Import Market Analysis (Value & Volume)
- 10.4. Market Analysis, Insights and Forecast - by Export Market Analysis (Value & Volume)
- 10.5. Market Analysis, Insights and Forecast - by Price Trend Analysis
- 11. Asia Pacific Urea Industry Analysis, Insights and Forecast, 2020-2032
- 11.1. Market Analysis, Insights and Forecast - by Production Analysis
- 11.2. Market Analysis, Insights and Forecast - by Consumption Analysis
- 11.3. Market Analysis, Insights and Forecast - by Import Market Analysis (Value & Volume)
- 11.4. Market Analysis, Insights and Forecast - by Export Market Analysis (Value & Volume)
- 11.5. Market Analysis, Insights and Forecast - by Price Trend Analysis
- 12. Competitive Analysis
- 12.1. Company Profiles
- 12.1.1 Coromandel International Ltd
- 12.1.1.1. Company Overview
- 12.1.1.2. Products
- 12.1.1.3. Company Financials
- 12.1.1.4. SWOT Analysis
- 12.1.2 CF Industries Holdings Inc
- 12.1.2.1. Company Overview
- 12.1.2.2. Products
- 12.1.2.3. Company Financials
- 12.1.2.4. SWOT Analysis
- 12.1.3 Koch Industries Inc
- 12.1.3.1. Company Overview
- 12.1.3.2. Products
- 12.1.3.3. Company Financials
- 12.1.3.4. SWOT Analysis
- 12.1.4 Indian Farmers Fertiliser Cooperative Limited
- 12.1.4.1. Company Overview
- 12.1.4.2. Products
- 12.1.4.3. Company Financials
- 12.1.4.4. SWOT Analysis
- 12.1.5 EuroChem Group
- 12.1.5.1. Company Overview
- 12.1.5.2. Products
- 12.1.5.3. Company Financials
- 12.1.5.4. SWOT Analysis
- 12.1.6 SABIC Agri-Nutrients Co
- 12.1.6.1. Company Overview
- 12.1.6.2. Products
- 12.1.6.3. Company Financials
- 12.1.6.4. SWOT Analysis
- 12.1.7 Yara International AS
- 12.1.7.1. Company Overview
- 12.1.7.2. Products
- 12.1.7.3. Company Financials
- 12.1.7.4. SWOT Analysis
- 12.1.8 OCI NV
- 12.1.8.1. Company Overview
- 12.1.8.2. Products
- 12.1.8.3. Company Financials
- 12.1.8.4. SWOT Analysis
- 12.1.9 Nutrien Ltd
- 12.1.9.1. Company Overview
- 12.1.9.2. Products
- 12.1.9.3. Company Financials
- 12.1.9.4. SWOT Analysis
- 12.1.1 Coromandel International Ltd
- 12.2. Market Entropy
- 12.2.1 Company's Key Areas Served
- 12.2.2 Recent Developments
- 12.3. Company Market Share Analysis 2025
- 12.3.1 Top 5 Companies Market Share Analysis
- 12.3.2 Top 3 Companies Market Share Analysis
- 12.4. List of Potential Customers
- 13. Research Methodology
List of Figures
- Figure 1: Global Urea Industry Revenue Breakdown (million, %) by Region 2025 & 2033
- Figure 2: North America Urea Industry Revenue (million), by Production Analysis 2025 & 2033
- Figure 3: North America Urea Industry Revenue Share (%), by Production Analysis 2025 & 2033
- Figure 4: North America Urea Industry Revenue (million), by Consumption Analysis 2025 & 2033
- Figure 5: North America Urea Industry Revenue Share (%), by Consumption Analysis 2025 & 2033
- Figure 6: North America Urea Industry Revenue (million), by Import Market Analysis (Value & Volume) 2025 & 2033
- Figure 7: North America Urea Industry Revenue Share (%), by Import Market Analysis (Value & Volume) 2025 & 2033
- Figure 8: North America Urea Industry Revenue (million), by Export Market Analysis (Value & Volume) 2025 & 2033
- Figure 9: North America Urea Industry Revenue Share (%), by Export Market Analysis (Value & Volume) 2025 & 2033
- Figure 10: North America Urea Industry Revenue (million), by Price Trend Analysis 2025 & 2033
- Figure 11: North America Urea Industry Revenue Share (%), by Price Trend Analysis 2025 & 2033
- Figure 12: North America Urea Industry Revenue (million), by Country 2025 & 2033
- Figure 13: North America Urea Industry Revenue Share (%), by Country 2025 & 2033
- Figure 14: South America Urea Industry Revenue (million), by Production Analysis 2025 & 2033
- Figure 15: South America Urea Industry Revenue Share (%), by Production Analysis 2025 & 2033
- Figure 16: South America Urea Industry Revenue (million), by Consumption Analysis 2025 & 2033
- Figure 17: South America Urea Industry Revenue Share (%), by Consumption Analysis 2025 & 2033
- Figure 18: South America Urea Industry Revenue (million), by Import Market Analysis (Value & Volume) 2025 & 2033
- Figure 19: South America Urea Industry Revenue Share (%), by Import Market Analysis (Value & Volume) 2025 & 2033
- Figure 20: South America Urea Industry Revenue (million), by Export Market Analysis (Value & Volume) 2025 & 2033
- Figure 21: South America Urea Industry Revenue Share (%), by Export Market Analysis (Value & Volume) 2025 & 2033
- Figure 22: South America Urea Industry Revenue (million), by Price Trend Analysis 2025 & 2033
- Figure 23: South America Urea Industry Revenue Share (%), by Price Trend Analysis 2025 & 2033
- Figure 24: South America Urea Industry Revenue (million), by Country 2025 & 2033
- Figure 25: South America Urea Industry Revenue Share (%), by Country 2025 & 2033
- Figure 26: Europe Urea Industry Revenue (million), by Production Analysis 2025 & 2033
- Figure 27: Europe Urea Industry Revenue Share (%), by Production Analysis 2025 & 2033
- Figure 28: Europe Urea Industry Revenue (million), by Consumption Analysis 2025 & 2033
- Figure 29: Europe Urea Industry Revenue Share (%), by Consumption Analysis 2025 & 2033
- Figure 30: Europe Urea Industry Revenue (million), by Import Market Analysis (Value & Volume) 2025 & 2033
- Figure 31: Europe Urea Industry Revenue Share (%), by Import Market Analysis (Value & Volume) 2025 & 2033
- Figure 32: Europe Urea Industry Revenue (million), by Export Market Analysis (Value & Volume) 2025 & 2033
- Figure 33: Europe Urea Industry Revenue Share (%), by Export Market Analysis (Value & Volume) 2025 & 2033
- Figure 34: Europe Urea Industry Revenue (million), by Price Trend Analysis 2025 & 2033
- Figure 35: Europe Urea Industry Revenue Share (%), by Price Trend Analysis 2025 & 2033
- Figure 36: Europe Urea Industry Revenue (million), by Country 2025 & 2033
- Figure 37: Europe Urea Industry Revenue Share (%), by Country 2025 & 2033
- Figure 38: Middle East & Africa Urea Industry Revenue (million), by Production Analysis 2025 & 2033
- Figure 39: Middle East & Africa Urea Industry Revenue Share (%), by Production Analysis 2025 & 2033
- Figure 40: Middle East & Africa Urea Industry Revenue (million), by Consumption Analysis 2025 & 2033
- Figure 41: Middle East & Africa Urea Industry Revenue Share (%), by Consumption Analysis 2025 & 2033
- Figure 42: Middle East & Africa Urea Industry Revenue (million), by Import Market Analysis (Value & Volume) 2025 & 2033
- Figure 43: Middle East & Africa Urea Industry Revenue Share (%), by Import Market Analysis (Value & Volume) 2025 & 2033
- Figure 44: Middle East & Africa Urea Industry Revenue (million), by Export Market Analysis (Value & Volume) 2025 & 2033
- Figure 45: Middle East & Africa Urea Industry Revenue Share (%), by Export Market Analysis (Value & Volume) 2025 & 2033
- Figure 46: Middle East & Africa Urea Industry Revenue (million), by Price Trend Analysis 2025 & 2033
- Figure 47: Middle East & Africa Urea Industry Revenue Share (%), by Price Trend Analysis 2025 & 2033
- Figure 48: Middle East & Africa Urea Industry Revenue (million), by Country 2025 & 2033
- Figure 49: Middle East & Africa Urea Industry Revenue Share (%), by Country 2025 & 2033
- Figure 50: Asia Pacific Urea Industry Revenue (million), by Production Analysis 2025 & 2033
- Figure 51: Asia Pacific Urea Industry Revenue Share (%), by Production Analysis 2025 & 2033
- Figure 52: Asia Pacific Urea Industry Revenue (million), by Consumption Analysis 2025 & 2033
- Figure 53: Asia Pacific Urea Industry Revenue Share (%), by Consumption Analysis 2025 & 2033
- Figure 54: Asia Pacific Urea Industry Revenue (million), by Import Market Analysis (Value & Volume) 2025 & 2033
- Figure 55: Asia Pacific Urea Industry Revenue Share (%), by Import Market Analysis (Value & Volume) 2025 & 2033
- Figure 56: Asia Pacific Urea Industry Revenue (million), by Export Market Analysis (Value & Volume) 2025 & 2033
- Figure 57: Asia Pacific Urea Industry Revenue Share (%), by Export Market Analysis (Value & Volume) 2025 & 2033
- Figure 58: Asia Pacific Urea Industry Revenue (million), by Price Trend Analysis 2025 & 2033
- Figure 59: Asia Pacific Urea Industry Revenue Share (%), by Price Trend Analysis 2025 & 2033
- Figure 60: Asia Pacific Urea Industry Revenue (million), by Country 2025 & 2033
- Figure 61: Asia Pacific Urea Industry Revenue Share (%), by Country 2025 & 2033
List of Tables
- Table 1: Global Urea Industry Revenue million Forecast, by Production Analysis 2020 & 2033
- Table 2: Global Urea Industry Revenue million Forecast, by Consumption Analysis 2020 & 2033
- Table 3: Global Urea Industry Revenue million Forecast, by Import Market Analysis (Value & Volume) 2020 & 2033
- Table 4: Global Urea Industry Revenue million Forecast, by Export Market Analysis (Value & Volume) 2020 & 2033
- Table 5: Global Urea Industry Revenue million Forecast, by Price Trend Analysis 2020 & 2033
- Table 6: Global Urea Industry Revenue million Forecast, by Region 2020 & 2033
- Table 7: Global Urea Industry Revenue million Forecast, by Production Analysis 2020 & 2033
- Table 8: Global Urea Industry Revenue million Forecast, by Consumption Analysis 2020 & 2033
- Table 9: Global Urea Industry Revenue million Forecast, by Import Market Analysis (Value & Volume) 2020 & 2033
- Table 10: Global Urea Industry Revenue million Forecast, by Export Market Analysis (Value & Volume) 2020 & 2033
- Table 11: Global Urea Industry Revenue million Forecast, by Price Trend Analysis 2020 & 2033
- Table 12: Global Urea Industry Revenue million Forecast, by Country 2020 & 2033
- Table 13: United States Urea Industry Revenue (million) Forecast, by Application 2020 & 2033
- Table 14: Canada Urea Industry Revenue (million) Forecast, by Application 2020 & 2033
- Table 15: Mexico Urea Industry Revenue (million) Forecast, by Application 2020 & 2033
- Table 16: Global Urea Industry Revenue million Forecast, by Production Analysis 2020 & 2033
- Table 17: Global Urea Industry Revenue million Forecast, by Consumption Analysis 2020 & 2033
- Table 18: Global Urea Industry Revenue million Forecast, by Import Market Analysis (Value & Volume) 2020 & 2033
- Table 19: Global Urea Industry Revenue million Forecast, by Export Market Analysis (Value & Volume) 2020 & 2033
- Table 20: Global Urea Industry Revenue million Forecast, by Price Trend Analysis 2020 & 2033
- Table 21: Global Urea Industry Revenue million Forecast, by Country 2020 & 2033
- Table 22: Brazil Urea Industry Revenue (million) Forecast, by Application 2020 & 2033
- Table 23: Argentina Urea Industry Revenue (million) Forecast, by Application 2020 & 2033
- Table 24: Rest of South America Urea Industry Revenue (million) Forecast, by Application 2020 & 2033
- Table 25: Global Urea Industry Revenue million Forecast, by Production Analysis 2020 & 2033
- Table 26: Global Urea Industry Revenue million Forecast, by Consumption Analysis 2020 & 2033
- Table 27: Global Urea Industry Revenue million Forecast, by Import Market Analysis (Value & Volume) 2020 & 2033
- Table 28: Global Urea Industry Revenue million Forecast, by Export Market Analysis (Value & Volume) 2020 & 2033
- Table 29: Global Urea Industry Revenue million Forecast, by Price Trend Analysis 2020 & 2033
- Table 30: Global Urea Industry Revenue million Forecast, by Country 2020 & 2033
- Table 31: United Kingdom Urea Industry Revenue (million) Forecast, by Application 2020 & 2033
- Table 32: Germany Urea Industry Revenue (million) Forecast, by Application 2020 & 2033
- Table 33: France Urea Industry Revenue (million) Forecast, by Application 2020 & 2033
- Table 34: Italy Urea Industry Revenue (million) Forecast, by Application 2020 & 2033
- Table 35: Spain Urea Industry Revenue (million) Forecast, by Application 2020 & 2033
- Table 36: Russia Urea Industry Revenue (million) Forecast, by Application 2020 & 2033
- Table 37: Benelux Urea Industry Revenue (million) Forecast, by Application 2020 & 2033
- Table 38: Nordics Urea Industry Revenue (million) Forecast, by Application 2020 & 2033
- Table 39: Rest of Europe Urea Industry Revenue (million) Forecast, by Application 2020 & 2033
- Table 40: Global Urea Industry Revenue million Forecast, by Production Analysis 2020 & 2033
- Table 41: Global Urea Industry Revenue million Forecast, by Consumption Analysis 2020 & 2033
- Table 42: Global Urea Industry Revenue million Forecast, by Import Market Analysis (Value & Volume) 2020 & 2033
- Table 43: Global Urea Industry Revenue million Forecast, by Export Market Analysis (Value & Volume) 2020 & 2033
- Table 44: Global Urea Industry Revenue million Forecast, by Price Trend Analysis 2020 & 2033
- Table 45: Global Urea Industry Revenue million Forecast, by Country 2020 & 2033
- Table 46: Turkey Urea Industry Revenue (million) Forecast, by Application 2020 & 2033
- Table 47: Israel Urea Industry Revenue (million) Forecast, by Application 2020 & 2033
- Table 48: GCC Urea Industry Revenue (million) Forecast, by Application 2020 & 2033
- Table 49: North Africa Urea Industry Revenue (million) Forecast, by Application 2020 & 2033
- Table 50: South Africa Urea Industry Revenue (million) Forecast, by Application 2020 & 2033
- Table 51: Rest of Middle East & Africa Urea Industry Revenue (million) Forecast, by Application 2020 & 2033
- Table 52: Global Urea Industry Revenue million Forecast, by Production Analysis 2020 & 2033
- Table 53: Global Urea Industry Revenue million Forecast, by Consumption Analysis 2020 & 2033
- Table 54: Global Urea Industry Revenue million Forecast, by Import Market Analysis (Value & Volume) 2020 & 2033
- Table 55: Global Urea Industry Revenue million Forecast, by Export Market Analysis (Value & Volume) 2020 & 2033
- Table 56: Global Urea Industry Revenue million Forecast, by Price Trend Analysis 2020 & 2033
- Table 57: Global Urea Industry Revenue million Forecast, by Country 2020 & 2033
- Table 58: China Urea Industry Revenue (million) Forecast, by Application 2020 & 2033
- Table 59: India Urea Industry Revenue (million) Forecast, by Application 2020 & 2033
- Table 60: Japan Urea Industry Revenue (million) Forecast, by Application 2020 & 2033
- Table 61: South Korea Urea Industry Revenue (million) Forecast, by Application 2020 & 2033
- Table 62: ASEAN Urea Industry Revenue (million) Forecast, by Application 2020 & 2033
- Table 63: Oceania Urea Industry Revenue (million) Forecast, by Application 2020 & 2033
- Table 64: Rest of Asia Pacific Urea Industry Revenue (million) Forecast, by Application 2020 & 2033
Frequently Asked Questions
1. What is the projected Compound Annual Growth Rate (CAGR) of the Urea Industry?
The projected CAGR is approximately 0.9%.
2. Which companies are prominent players in the Urea Industry?
Key companies in the market include Coromandel International Ltd, CF Industries Holdings Inc, Koch Industries Inc, Indian Farmers Fertiliser Cooperative Limited, EuroChem Group, SABIC Agri-Nutrients Co, Yara International AS, OCI NV, Nutrien Ltd.
3. What are the main segments of the Urea Industry?
The market segments include Production Analysis, Consumption Analysis, Import Market Analysis (Value & Volume), Export Market Analysis (Value & Volume), Price Trend Analysis.
4. Can you provide details about the market size?
The market size is estimated to be USD 178.8 million as of 2022.
5. What are some drivers contributing to market growth?
Awareness of Landscaping Maintenance; Technological Advancements.
6. What are the notable trends driving market growth?
OTHER KEY INDUSTRY TRENDS COVERED IN THE REPORT.
7. Are there any restraints impacting market growth?
Shortage of Skilled Labor; Wastage of High Amount of Water For Irrigating Lawns.
8. Can you provide examples of recent developments in the market?
April 2023: SABIC Agri-Nutrients Company acquired the ETC Group (ETG) with a 49% stake in the ETG Inputs Holdco Limited for a transaction value of USD 320 million. The agreement is part of SABIC Agri-Nutrients Company's strategy to integrate the value chain and distribution of agri-nutrients markets.March 2022: EuroChem Group has purchased 51.48% of the shares of the Brazilian distributor Fertilizantes Heringer SA, this purchase will further strengthen its production and distribution capacity in Brazil.January 2022: Yara and Lantmännen signed a commercial agreement to bring “green” fertilizers to the market. Produced with renewable energy, these green nitrogen fertilizers are vital to decarbonizing the food chain and offering consumers more sustainable food choices.
9. What pricing options are available for accessing the report?
Pricing options include single-user, multi-user, and enterprise licenses priced at USD 3800, USD 4500, and USD 5800 respectively.
10. Is the market size provided in terms of value or volume?
The market size is provided in terms of value, measured in million.
11. Are there any specific market keywords associated with the report?
Yes, the market keyword associated with the report is "Urea Industry," which aids in identifying and referencing the specific market segment covered.
12. How do I determine which pricing option suits my needs best?
The pricing options vary based on user requirements and access needs. Individual users may opt for single-user licenses, while businesses requiring broader access may choose multi-user or enterprise licenses for cost-effective access to the report.
13. Are there any additional resources or data provided in the Urea Industry report?
While the report offers comprehensive insights, it's advisable to review the specific contents or supplementary materials provided to ascertain if additional resources or data are available.
14. How can I stay updated on further developments or reports in the Urea Industry?
To stay informed about further developments, trends, and reports in the Urea Industry, consider subscribing to industry newsletters, following relevant companies and organizations, or regularly checking reputable industry news sources and publications.
Methodology
Step 1 - Identification of Relevant Samples Size from Population Database


Step 2 - Approaches for Defining Global Market Size (Value, Volume* & Price*)

Note*: In applicable scenarios
Step 3 - Data Sources
Primary Research
- Web Analytics
- Survey Reports
- Research Institute
- Latest Research Reports
- Opinion Leaders
Secondary Research
- Annual Reports
- White Paper
- Latest Press Release
- Industry Association
- Paid Database
- Investor Presentations

Step 4 - Data Triangulation
Involves using different sources of information in order to increase the validity of a study
These sources are likely to be stakeholders in a program - participants, other researchers, program staff, other community members, and so on.
Then we put all data in single framework & apply various statistical tools to find out the dynamic on the market.
During the analysis stage, feedback from the stakeholder groups would be compared to determine areas of agreement as well as areas of divergence