

Key Insights
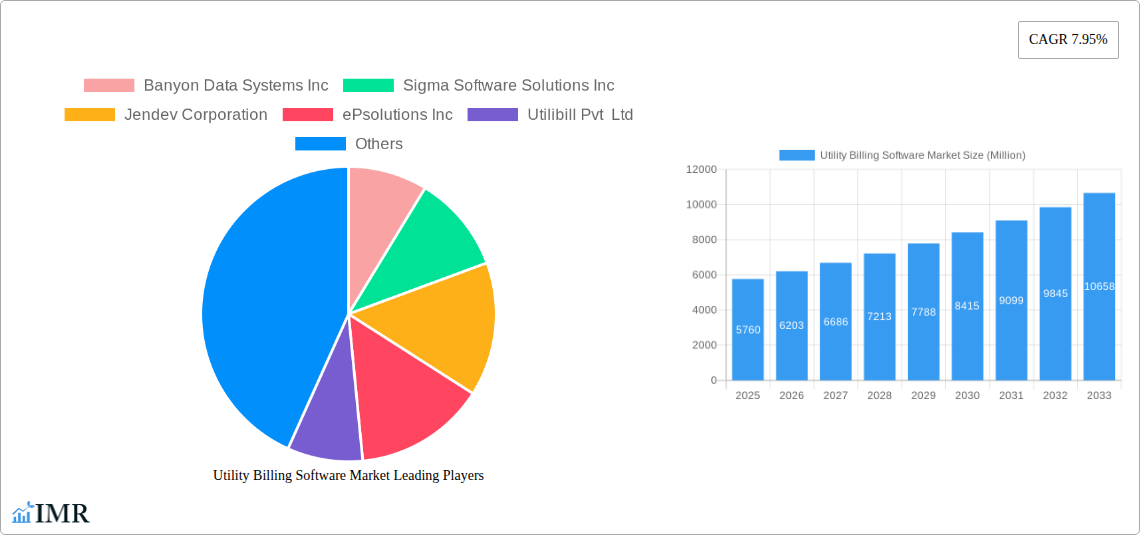
The Utility Billing Software market is experiencing robust growth, projected to reach \$5.76 billion in 2025 and maintain a Compound Annual Growth Rate (CAGR) of 7.95% from 2025 to 2033. This expansion is driven by several key factors. Increasing demand for efficient and automated billing processes within the utility sector (water, oil & gas, power distribution, and telecommunications) is a major catalyst. The shift towards cloud-based solutions offers improved scalability, accessibility, and reduced infrastructure costs, further fueling market growth. Furthermore, the rising adoption of advanced analytics and data-driven insights within billing systems enhances operational efficiency and improves customer service, creating a strong incentive for utility companies to upgrade their software. Regulatory compliance requirements and the need to minimize billing errors are also contributing to the market's expansion. Competition is intense, with established players like Oracle Corporation alongside specialized providers like Banyon Data Systems and Sigma Software Solutions vying for market share. The market is segmented by deployment mode (cloud-based and on-premise) and end-user industry, with North America and Europe currently holding significant market shares.
The continued growth trajectory is expected to be influenced by several ongoing trends. The increasing integration of Internet of Things (IoT) devices into billing systems allows for real-time data collection and improved accuracy. The adoption of Artificial Intelligence (AI) and machine learning for predictive analytics and fraud detection is also gaining traction. However, challenges remain, including the high initial investment costs associated with software implementation and integration, the need for robust cybersecurity measures to protect sensitive customer data, and the potential for resistance to change among utility companies accustomed to traditional billing methods. Despite these restraints, the long-term outlook for the Utility Billing Software market remains positive, fueled by ongoing technological advancements and the inherent need for efficiency and accuracy within the utility billing sector.
Utility Billing Software Market: A Comprehensive Report (2019-2033)
This comprehensive report provides an in-depth analysis of the Utility Billing Software Market, offering valuable insights for industry professionals, investors, and strategists. The study period spans from 2019 to 2033, with 2025 serving as the base and estimated year. The report meticulously examines market dynamics, growth trends, regional dominance, product landscapes, and key players shaping the future of this vital sector. The market is segmented by deployment mode (cloud-based and on-premise) and end-user industry (water, oil & gas, power distribution, telecommunication, and other end-user industries). The total market size is projected to reach xx Million by 2033.
Utility Billing Software Market Dynamics & Structure
This section analyzes the competitive landscape, technological advancements, regulatory influences, and market trends impacting the Utility Billing Software market. The market exhibits a moderately concentrated structure, with key players such as Banyon Data Systems Inc, Sigma Software Solutions Inc, Jendev Corporation, ePsolutions Inc, Utilibill Pvt Ltd, Jayhawk Software Inc, Exceleron Softwares Inc, PayStand Inc, Oracle Corporation, and Harris Computer Systems holding significant market share. However, the entry of smaller niche players and the increasing adoption of cloud-based solutions are leading to heightened competition.
- Market Concentration: The top 5 players hold approximately xx% of the market share in 2025, indicating a moderately concentrated market.
- Technological Innovation: The market is driven by the adoption of AI, machine learning, and advanced analytics for enhanced billing accuracy and customer service. Blockchain technology is also gaining traction for improved transparency and security.
- Regulatory Frameworks: Stringent data privacy regulations (e.g., GDPR, CCPA) are influencing software development and deployment strategies.
- Competitive Product Substitutes: Traditional manual billing systems pose a competitive threat, especially in smaller utilities. However, the cost-effectiveness and efficiency of software solutions are driving market adoption.
- End-User Demographics: The market is driven by large and medium-sized utilities across various sectors seeking efficiency gains and cost optimization.
- M&A Trends: The market has witnessed xx M&A deals between 2019 and 2024, primarily focused on acquiring smaller software companies with specialized functionalities.
Utility Billing Software Market Growth Trends & Insights
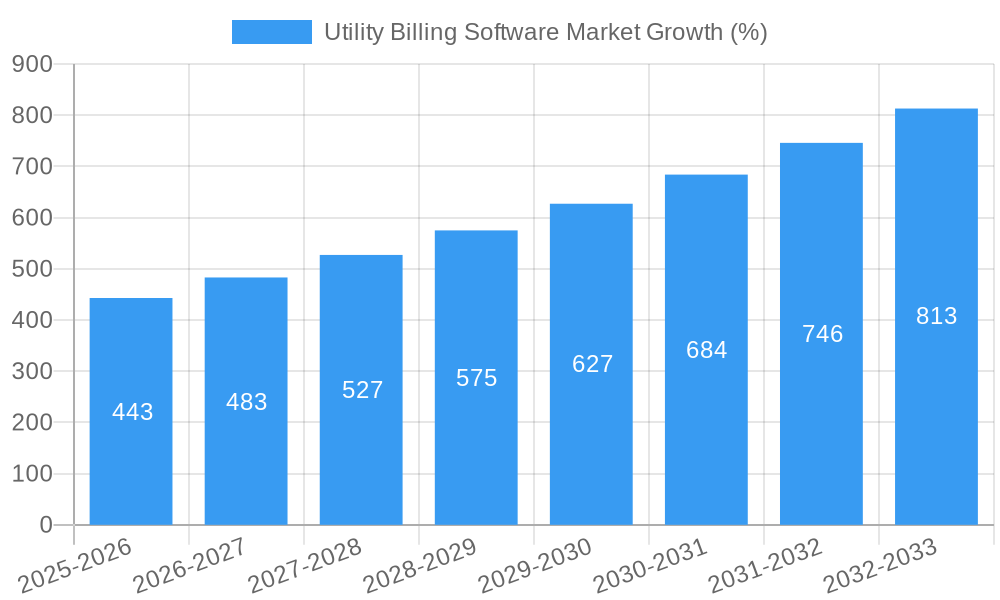
The Utility Billing Software market experienced significant growth between 2019 and 2024, with a CAGR of xx%. This growth is primarily attributed to increasing digitalization across utility sectors, rising demand for improved customer experience, and the need for efficient billing and revenue management systems. The market is expected to maintain a robust CAGR of xx% during the forecast period (2025-2033), driven by factors such as the rising adoption of cloud-based solutions, increasing investments in smart grid technologies, and growing demand for data analytics capabilities. The market penetration rate for cloud-based solutions is expected to reach xx% by 2033, indicating significant growth potential in this segment. Technological disruptions, such as the integration of IoT devices and advanced analytics, are further driving market expansion. Consumer behavior shifts towards digital self-service platforms are also impacting market dynamics, pushing utilities to adopt user-friendly and efficient billing software.
Dominant Regions, Countries, or Segments in Utility Billing Software Market
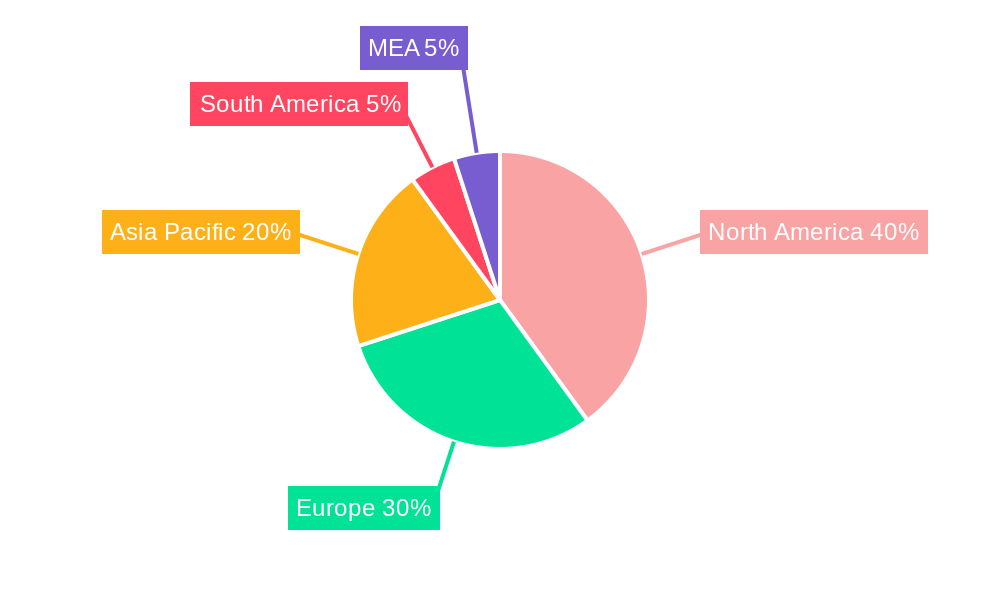
North America is currently the leading region in the Utility Billing Software market, holding approximately xx% of the global market share in 2025. This dominance is driven by factors such as early adoption of advanced technologies, strong regulatory support for digital transformation, and the presence of major market players. Europe is also a significant market, projected to witness substantial growth during the forecast period. Within the segments, the cloud-based deployment model is experiencing the fastest growth, driven by its scalability, cost-effectiveness, and enhanced accessibility. The power distribution and water sectors are the largest end-user industries, representing approximately xx% and xx% of the market respectively.
- Key Drivers in North America: Strong regulatory push for digitalization, high adoption rates of cloud solutions, and the presence of major software vendors.
- Key Drivers in Europe: Increasing investments in smart grid infrastructure, rising demand for efficient billing systems, and government initiatives promoting digital transformation.
- Cloud-based Segment Drivers: Cost-effectiveness, scalability, accessibility, and ease of integration with other systems.
- Power Distribution Sector Drivers: Need for precise billing, efficient revenue management, and real-time data analytics for optimizing grid operations.
Utility Billing Software Market Product Landscape
Utility billing software solutions are evolving to incorporate advanced features such as AI-powered fraud detection, predictive analytics for optimizing revenue collection, and integrated customer portals for enhancing user experience. Modern solutions leverage cloud infrastructure for improved scalability and accessibility, and often integrate with other utility management systems to streamline operations. Unique selling propositions include real-time billing capabilities, sophisticated reporting dashboards, and customized billing options tailored to specific industry needs. Continuous technological advancements focus on improving billing accuracy, reducing operational costs, and enhancing customer satisfaction.
Key Drivers, Barriers & Challenges in Utility Billing Software Market
Key Drivers: The primary drivers include increasing demand for efficient billing and revenue management, the adoption of cloud-based solutions, the growing need for data analytics, and the rising pressure to improve customer service. Government initiatives promoting digitalization and smart grid investments are also contributing factors.
Key Challenges: High upfront implementation costs can pose a barrier to adoption for smaller utilities. Integration challenges with existing legacy systems and concerns about data security and compliance with privacy regulations are significant hurdles. Competition among established vendors and the emergence of new players create intense market pressure. Supply chain disruptions may lead to delays in software implementation and support.
Emerging Opportunities in Utility Billing Software Market
Emerging opportunities lie in expanding into untapped markets such as developing economies. The integration of IoT devices and the growing adoption of blockchain technology offer avenues for innovation. The development of specialized software tailored for specific utility sectors (e.g., renewable energy) presents a significant opportunity. Customization of billing portals to meet specific customer needs and offering tailored mobile applications will further fuel market growth.
Growth Accelerators in the Utility Billing Software Market Industry
Strategic partnerships between software vendors and utility companies are driving market expansion. The development of innovative billing models, such as tiered pricing and dynamic pricing, enables utilities to better manage their operations. Expansion into emerging economies and increasing investments in research and development are key accelerators for long-term growth. The focus on improving customer engagement through seamless online portals and self-service options is boosting market growth.
Key Players Shaping the Utility Billing Software Market Market
- Banyon Data Systems Inc
- Sigma Software Solutions Inc
- Jendev Corporation
- ePsolutions Inc
- Utilibill Pvt Ltd
- Jayhawk Software Inc
- Exceleron Softwares Inc
- PayStand Inc
- Oracle Corporation
- Harris Computer Systems
Notable Milestones in Utility Billing Software Market Sector
- October 2022: Exceleron Softwares Inc. enhanced its MyUsage solution to support Amazon Web Services and Tier-1 private cloud options, providing customers with greater flexibility and scalability.
- September 2022: Harris Computer Systems acquired AirVM Inc., adding a private cloud management platform and enhancing its billing data accuracy.
In-Depth Utility Billing Software Market Market Outlook
The Utility Billing Software market is poised for sustained growth, driven by technological advancements, increasing demand for efficient billing solutions, and the ongoing digital transformation across the utility sector. Strategic partnerships, innovative product development, and expansion into new markets will further shape the market landscape. The focus on improving customer experience, leveraging data analytics, and addressing sustainability concerns presents significant opportunities for market participants. The market is expected to experience robust growth, with cloud-based solutions and advanced analytics features leading the charge.
Utility Billing Software Market Segmentation
-
1. Deployment Mode
- 1.1. Cloud-based
- 1.2. On-premise
-
2. End-user Industry
- 2.1. Water
- 2.2. Oil & Gas
- 2.3. Power Distribution
- 2.4. Telecommunication
- 2.5. Other End-user Industries
Utility Billing Software Market Segmentation By Geography
-
1. North America
- 1.1. United States
- 1.2. Canada
-
2. Europe
- 2.1. Germany
- 2.2. United Kingdom
- 2.3. France
- 2.4. Rest of Europe
-
3. Asia Pacific
- 3.1. China
- 3.2. Japan
- 3.3. India
- 3.4. Rest of Asia Pacific
- 4. Rest of the World
Utility Billing Software Market REPORT HIGHLIGHTS
| Aspects | Details |
|---|---|
| Study Period | 2019-2033 |
| Base Year | 2024 |
| Estimated Year | 2025 |
| Forecast Period | 2025-2033 |
| Historical Period | 2019-2024 |
| Growth Rate | CAGR of 7.95% from 2019-2033 |
| Segmentation |
|
Table of Contents
- 1. Introduction
- 1.1. Research Scope
- 1.2. Market Segmentation
- 1.3. Research Methodology
- 1.4. Definitions and Assumptions
- 2. Executive Summary
- 2.1. Introduction
- 3. Market Dynamics
- 3.1. Introduction
- 3.2. Market Drivers
- 3.2.1. Improvement in Legacy Billing Systems and IT Infrastructure; Growing Investment in Smart Grid Technology
- 3.3. Market Restrains
- 3.3.1. Lack of Digital Skills Among End-user Industries
- 3.4. Market Trends
- 3.4.1. Power Distribution Industry Expected to Hold Significant Market Share
- 4. Market Factor Analysis
- 4.1. Porters Five Forces
- 4.2. Supply/Value Chain
- 4.3. PESTEL analysis
- 4.4. Market Entropy
- 4.5. Patent/Trademark Analysis
- 5. Global Utility Billing Software Market Analysis, Insights and Forecast, 2019-2031
- 5.1. Market Analysis, Insights and Forecast - by Deployment Mode
- 5.1.1. Cloud-based
- 5.1.2. On-premise
- 5.2. Market Analysis, Insights and Forecast - by End-user Industry
- 5.2.1. Water
- 5.2.2. Oil & Gas
- 5.2.3. Power Distribution
- 5.2.4. Telecommunication
- 5.2.5. Other End-user Industries
- 5.3. Market Analysis, Insights and Forecast - by Region
- 5.3.1. North America
- 5.3.2. Europe
- 5.3.3. Asia Pacific
- 5.3.4. Rest of the World
- 5.1. Market Analysis, Insights and Forecast - by Deployment Mode
- 6. North America Utility Billing Software Market Analysis, Insights and Forecast, 2019-2031
- 6.1. Market Analysis, Insights and Forecast - by Deployment Mode
- 6.1.1. Cloud-based
- 6.1.2. On-premise
- 6.2. Market Analysis, Insights and Forecast - by End-user Industry
- 6.2.1. Water
- 6.2.2. Oil & Gas
- 6.2.3. Power Distribution
- 6.2.4. Telecommunication
- 6.2.5. Other End-user Industries
- 6.1. Market Analysis, Insights and Forecast - by Deployment Mode
- 7. Europe Utility Billing Software Market Analysis, Insights and Forecast, 2019-2031
- 7.1. Market Analysis, Insights and Forecast - by Deployment Mode
- 7.1.1. Cloud-based
- 7.1.2. On-premise
- 7.2. Market Analysis, Insights and Forecast - by End-user Industry
- 7.2.1. Water
- 7.2.2. Oil & Gas
- 7.2.3. Power Distribution
- 7.2.4. Telecommunication
- 7.2.5. Other End-user Industries
- 7.1. Market Analysis, Insights and Forecast - by Deployment Mode
- 8. Asia Pacific Utility Billing Software Market Analysis, Insights and Forecast, 2019-2031
- 8.1. Market Analysis, Insights and Forecast - by Deployment Mode
- 8.1.1. Cloud-based
- 8.1.2. On-premise
- 8.2. Market Analysis, Insights and Forecast - by End-user Industry
- 8.2.1. Water
- 8.2.2. Oil & Gas
- 8.2.3. Power Distribution
- 8.2.4. Telecommunication
- 8.2.5. Other End-user Industries
- 8.1. Market Analysis, Insights and Forecast - by Deployment Mode
- 9. Rest of the World Utility Billing Software Market Analysis, Insights and Forecast, 2019-2031
- 9.1. Market Analysis, Insights and Forecast - by Deployment Mode
- 9.1.1. Cloud-based
- 9.1.2. On-premise
- 9.2. Market Analysis, Insights and Forecast - by End-user Industry
- 9.2.1. Water
- 9.2.2. Oil & Gas
- 9.2.3. Power Distribution
- 9.2.4. Telecommunication
- 9.2.5. Other End-user Industries
- 9.1. Market Analysis, Insights and Forecast - by Deployment Mode
- 10. North America Utility Billing Software Market Analysis, Insights and Forecast, 2019-2031
- 10.1. Market Analysis, Insights and Forecast - By Country/Sub-region
- 10.1.1 United States
- 10.1.2 Canada
- 10.1.3 Mexico
- 11. Europe Utility Billing Software Market Analysis, Insights and Forecast, 2019-2031
- 11.1. Market Analysis, Insights and Forecast - By Country/Sub-region
- 11.1.1 Germany
- 11.1.2 United Kingdom
- 11.1.3 France
- 11.1.4 Spain
- 11.1.5 Italy
- 11.1.6 Spain
- 11.1.7 Belgium
- 11.1.8 Netherland
- 11.1.9 Nordics
- 11.1.10 Rest of Europe
- 12. Asia Pacific Utility Billing Software Market Analysis, Insights and Forecast, 2019-2031
- 12.1. Market Analysis, Insights and Forecast - By Country/Sub-region
- 12.1.1 China
- 12.1.2 Japan
- 12.1.3 India
- 12.1.4 South Korea
- 12.1.5 Southeast Asia
- 12.1.6 Australia
- 12.1.7 Indonesia
- 12.1.8 Phillipes
- 12.1.9 Singapore
- 12.1.10 Thailandc
- 12.1.11 Rest of Asia Pacific
- 13. South America Utility Billing Software Market Analysis, Insights and Forecast, 2019-2031
- 13.1. Market Analysis, Insights and Forecast - By Country/Sub-region
- 13.1.1 Brazil
- 13.1.2 Argentina
- 13.1.3 Peru
- 13.1.4 Chile
- 13.1.5 Colombia
- 13.1.6 Ecuador
- 13.1.7 Venezuela
- 13.1.8 Rest of South America
- 14. North America Utility Billing Software Market Analysis, Insights and Forecast, 2019-2031
- 14.1. Market Analysis, Insights and Forecast - By Country/Sub-region
- 14.1.1 United States
- 14.1.2 Canada
- 14.1.3 Mexico
- 15. MEA Utility Billing Software Market Analysis, Insights and Forecast, 2019-2031
- 15.1. Market Analysis, Insights and Forecast - By Country/Sub-region
- 15.1.1 United Arab Emirates
- 15.1.2 Saudi Arabia
- 15.1.3 South Africa
- 15.1.4 Rest of Middle East and Africa
- 16. Competitive Analysis
- 16.1. Global Market Share Analysis 2024
- 16.2. Company Profiles
- 16.2.1 Banyon Data Systems Inc
- 16.2.1.1. Overview
- 16.2.1.2. Products
- 16.2.1.3. SWOT Analysis
- 16.2.1.4. Recent Developments
- 16.2.1.5. Financials (Based on Availability)
- 16.2.2 Sigma Software Solutions Inc
- 16.2.2.1. Overview
- 16.2.2.2. Products
- 16.2.2.3. SWOT Analysis
- 16.2.2.4. Recent Developments
- 16.2.2.5. Financials (Based on Availability)
- 16.2.3 Jendev Corporation
- 16.2.3.1. Overview
- 16.2.3.2. Products
- 16.2.3.3. SWOT Analysis
- 16.2.3.4. Recent Developments
- 16.2.3.5. Financials (Based on Availability)
- 16.2.4 ePsolutions Inc
- 16.2.4.1. Overview
- 16.2.4.2. Products
- 16.2.4.3. SWOT Analysis
- 16.2.4.4. Recent Developments
- 16.2.4.5. Financials (Based on Availability)
- 16.2.5 Utilibill Pvt Ltd
- 16.2.5.1. Overview
- 16.2.5.2. Products
- 16.2.5.3. SWOT Analysis
- 16.2.5.4. Recent Developments
- 16.2.5.5. Financials (Based on Availability)
- 16.2.6 Jayhawk Software Inc
- 16.2.6.1. Overview
- 16.2.6.2. Products
- 16.2.6.3. SWOT Analysis
- 16.2.6.4. Recent Developments
- 16.2.6.5. Financials (Based on Availability)
- 16.2.7 Exceleron Softwares Inc
- 16.2.7.1. Overview
- 16.2.7.2. Products
- 16.2.7.3. SWOT Analysis
- 16.2.7.4. Recent Developments
- 16.2.7.5. Financials (Based on Availability)
- 16.2.8 PayStand Inc
- 16.2.8.1. Overview
- 16.2.8.2. Products
- 16.2.8.3. SWOT Analysis
- 16.2.8.4. Recent Developments
- 16.2.8.5. Financials (Based on Availability)
- 16.2.9 Oracle Corporation*List Not Exhaustive
- 16.2.9.1. Overview
- 16.2.9.2. Products
- 16.2.9.3. SWOT Analysis
- 16.2.9.4. Recent Developments
- 16.2.9.5. Financials (Based on Availability)
- 16.2.10 Harris Computer Systems
- 16.2.10.1. Overview
- 16.2.10.2. Products
- 16.2.10.3. SWOT Analysis
- 16.2.10.4. Recent Developments
- 16.2.10.5. Financials (Based on Availability)
- 16.2.1 Banyon Data Systems Inc
List of Figures
- Figure 1: Global Utility Billing Software Market Revenue Breakdown (Million, %) by Region 2024 & 2032
- Figure 2: North America Utility Billing Software Market Revenue (Million), by Country 2024 & 2032
- Figure 3: North America Utility Billing Software Market Revenue Share (%), by Country 2024 & 2032
- Figure 4: Europe Utility Billing Software Market Revenue (Million), by Country 2024 & 2032
- Figure 5: Europe Utility Billing Software Market Revenue Share (%), by Country 2024 & 2032
- Figure 6: Asia Pacific Utility Billing Software Market Revenue (Million), by Country 2024 & 2032
- Figure 7: Asia Pacific Utility Billing Software Market Revenue Share (%), by Country 2024 & 2032
- Figure 8: South America Utility Billing Software Market Revenue (Million), by Country 2024 & 2032
- Figure 9: South America Utility Billing Software Market Revenue Share (%), by Country 2024 & 2032
- Figure 10: North America Utility Billing Software Market Revenue (Million), by Country 2024 & 2032
- Figure 11: North America Utility Billing Software Market Revenue Share (%), by Country 2024 & 2032
- Figure 12: MEA Utility Billing Software Market Revenue (Million), by Country 2024 & 2032
- Figure 13: MEA Utility Billing Software Market Revenue Share (%), by Country 2024 & 2032
- Figure 14: North America Utility Billing Software Market Revenue (Million), by Deployment Mode 2024 & 2032
- Figure 15: North America Utility Billing Software Market Revenue Share (%), by Deployment Mode 2024 & 2032
- Figure 16: North America Utility Billing Software Market Revenue (Million), by End-user Industry 2024 & 2032
- Figure 17: North America Utility Billing Software Market Revenue Share (%), by End-user Industry 2024 & 2032
- Figure 18: North America Utility Billing Software Market Revenue (Million), by Country 2024 & 2032
- Figure 19: North America Utility Billing Software Market Revenue Share (%), by Country 2024 & 2032
- Figure 20: Europe Utility Billing Software Market Revenue (Million), by Deployment Mode 2024 & 2032
- Figure 21: Europe Utility Billing Software Market Revenue Share (%), by Deployment Mode 2024 & 2032
- Figure 22: Europe Utility Billing Software Market Revenue (Million), by End-user Industry 2024 & 2032
- Figure 23: Europe Utility Billing Software Market Revenue Share (%), by End-user Industry 2024 & 2032
- Figure 24: Europe Utility Billing Software Market Revenue (Million), by Country 2024 & 2032
- Figure 25: Europe Utility Billing Software Market Revenue Share (%), by Country 2024 & 2032
- Figure 26: Asia Pacific Utility Billing Software Market Revenue (Million), by Deployment Mode 2024 & 2032
- Figure 27: Asia Pacific Utility Billing Software Market Revenue Share (%), by Deployment Mode 2024 & 2032
- Figure 28: Asia Pacific Utility Billing Software Market Revenue (Million), by End-user Industry 2024 & 2032
- Figure 29: Asia Pacific Utility Billing Software Market Revenue Share (%), by End-user Industry 2024 & 2032
- Figure 30: Asia Pacific Utility Billing Software Market Revenue (Million), by Country 2024 & 2032
- Figure 31: Asia Pacific Utility Billing Software Market Revenue Share (%), by Country 2024 & 2032
- Figure 32: Rest of the World Utility Billing Software Market Revenue (Million), by Deployment Mode 2024 & 2032
- Figure 33: Rest of the World Utility Billing Software Market Revenue Share (%), by Deployment Mode 2024 & 2032
- Figure 34: Rest of the World Utility Billing Software Market Revenue (Million), by End-user Industry 2024 & 2032
- Figure 35: Rest of the World Utility Billing Software Market Revenue Share (%), by End-user Industry 2024 & 2032
- Figure 36: Rest of the World Utility Billing Software Market Revenue (Million), by Country 2024 & 2032
- Figure 37: Rest of the World Utility Billing Software Market Revenue Share (%), by Country 2024 & 2032
List of Tables
- Table 1: Global Utility Billing Software Market Revenue Million Forecast, by Region 2019 & 2032
- Table 2: Global Utility Billing Software Market Revenue Million Forecast, by Deployment Mode 2019 & 2032
- Table 3: Global Utility Billing Software Market Revenue Million Forecast, by End-user Industry 2019 & 2032
- Table 4: Global Utility Billing Software Market Revenue Million Forecast, by Region 2019 & 2032
- Table 5: Global Utility Billing Software Market Revenue Million Forecast, by Country 2019 & 2032
- Table 6: United States Utility Billing Software Market Revenue (Million) Forecast, by Application 2019 & 2032
- Table 7: Canada Utility Billing Software Market Revenue (Million) Forecast, by Application 2019 & 2032
- Table 8: Mexico Utility Billing Software Market Revenue (Million) Forecast, by Application 2019 & 2032
- Table 9: Global Utility Billing Software Market Revenue Million Forecast, by Country 2019 & 2032
- Table 10: Germany Utility Billing Software Market Revenue (Million) Forecast, by Application 2019 & 2032
- Table 11: United Kingdom Utility Billing Software Market Revenue (Million) Forecast, by Application 2019 & 2032
- Table 12: France Utility Billing Software Market Revenue (Million) Forecast, by Application 2019 & 2032
- Table 13: Spain Utility Billing Software Market Revenue (Million) Forecast, by Application 2019 & 2032
- Table 14: Italy Utility Billing Software Market Revenue (Million) Forecast, by Application 2019 & 2032
- Table 15: Spain Utility Billing Software Market Revenue (Million) Forecast, by Application 2019 & 2032
- Table 16: Belgium Utility Billing Software Market Revenue (Million) Forecast, by Application 2019 & 2032
- Table 17: Netherland Utility Billing Software Market Revenue (Million) Forecast, by Application 2019 & 2032
- Table 18: Nordics Utility Billing Software Market Revenue (Million) Forecast, by Application 2019 & 2032
- Table 19: Rest of Europe Utility Billing Software Market Revenue (Million) Forecast, by Application 2019 & 2032
- Table 20: Global Utility Billing Software Market Revenue Million Forecast, by Country 2019 & 2032
- Table 21: China Utility Billing Software Market Revenue (Million) Forecast, by Application 2019 & 2032
- Table 22: Japan Utility Billing Software Market Revenue (Million) Forecast, by Application 2019 & 2032
- Table 23: India Utility Billing Software Market Revenue (Million) Forecast, by Application 2019 & 2032
- Table 24: South Korea Utility Billing Software Market Revenue (Million) Forecast, by Application 2019 & 2032
- Table 25: Southeast Asia Utility Billing Software Market Revenue (Million) Forecast, by Application 2019 & 2032
- Table 26: Australia Utility Billing Software Market Revenue (Million) Forecast, by Application 2019 & 2032
- Table 27: Indonesia Utility Billing Software Market Revenue (Million) Forecast, by Application 2019 & 2032
- Table 28: Phillipes Utility Billing Software Market Revenue (Million) Forecast, by Application 2019 & 2032
- Table 29: Singapore Utility Billing Software Market Revenue (Million) Forecast, by Application 2019 & 2032
- Table 30: Thailandc Utility Billing Software Market Revenue (Million) Forecast, by Application 2019 & 2032
- Table 31: Rest of Asia Pacific Utility Billing Software Market Revenue (Million) Forecast, by Application 2019 & 2032
- Table 32: Global Utility Billing Software Market Revenue Million Forecast, by Country 2019 & 2032
- Table 33: Brazil Utility Billing Software Market Revenue (Million) Forecast, by Application 2019 & 2032
- Table 34: Argentina Utility Billing Software Market Revenue (Million) Forecast, by Application 2019 & 2032
- Table 35: Peru Utility Billing Software Market Revenue (Million) Forecast, by Application 2019 & 2032
- Table 36: Chile Utility Billing Software Market Revenue (Million) Forecast, by Application 2019 & 2032
- Table 37: Colombia Utility Billing Software Market Revenue (Million) Forecast, by Application 2019 & 2032
- Table 38: Ecuador Utility Billing Software Market Revenue (Million) Forecast, by Application 2019 & 2032
- Table 39: Venezuela Utility Billing Software Market Revenue (Million) Forecast, by Application 2019 & 2032
- Table 40: Rest of South America Utility Billing Software Market Revenue (Million) Forecast, by Application 2019 & 2032
- Table 41: Global Utility Billing Software Market Revenue Million Forecast, by Country 2019 & 2032
- Table 42: United States Utility Billing Software Market Revenue (Million) Forecast, by Application 2019 & 2032
- Table 43: Canada Utility Billing Software Market Revenue (Million) Forecast, by Application 2019 & 2032
- Table 44: Mexico Utility Billing Software Market Revenue (Million) Forecast, by Application 2019 & 2032
- Table 45: Global Utility Billing Software Market Revenue Million Forecast, by Country 2019 & 2032
- Table 46: United Arab Emirates Utility Billing Software Market Revenue (Million) Forecast, by Application 2019 & 2032
- Table 47: Saudi Arabia Utility Billing Software Market Revenue (Million) Forecast, by Application 2019 & 2032
- Table 48: South Africa Utility Billing Software Market Revenue (Million) Forecast, by Application 2019 & 2032
- Table 49: Rest of Middle East and Africa Utility Billing Software Market Revenue (Million) Forecast, by Application 2019 & 2032
- Table 50: Global Utility Billing Software Market Revenue Million Forecast, by Deployment Mode 2019 & 2032
- Table 51: Global Utility Billing Software Market Revenue Million Forecast, by End-user Industry 2019 & 2032
- Table 52: Global Utility Billing Software Market Revenue Million Forecast, by Country 2019 & 2032
- Table 53: United States Utility Billing Software Market Revenue (Million) Forecast, by Application 2019 & 2032
- Table 54: Canada Utility Billing Software Market Revenue (Million) Forecast, by Application 2019 & 2032
- Table 55: Global Utility Billing Software Market Revenue Million Forecast, by Deployment Mode 2019 & 2032
- Table 56: Global Utility Billing Software Market Revenue Million Forecast, by End-user Industry 2019 & 2032
- Table 57: Global Utility Billing Software Market Revenue Million Forecast, by Country 2019 & 2032
- Table 58: Germany Utility Billing Software Market Revenue (Million) Forecast, by Application 2019 & 2032
- Table 59: United Kingdom Utility Billing Software Market Revenue (Million) Forecast, by Application 2019 & 2032
- Table 60: France Utility Billing Software Market Revenue (Million) Forecast, by Application 2019 & 2032
- Table 61: Rest of Europe Utility Billing Software Market Revenue (Million) Forecast, by Application 2019 & 2032
- Table 62: Global Utility Billing Software Market Revenue Million Forecast, by Deployment Mode 2019 & 2032
- Table 63: Global Utility Billing Software Market Revenue Million Forecast, by End-user Industry 2019 & 2032
- Table 64: Global Utility Billing Software Market Revenue Million Forecast, by Country 2019 & 2032
- Table 65: China Utility Billing Software Market Revenue (Million) Forecast, by Application 2019 & 2032
- Table 66: Japan Utility Billing Software Market Revenue (Million) Forecast, by Application 2019 & 2032
- Table 67: India Utility Billing Software Market Revenue (Million) Forecast, by Application 2019 & 2032
- Table 68: Rest of Asia Pacific Utility Billing Software Market Revenue (Million) Forecast, by Application 2019 & 2032
- Table 69: Global Utility Billing Software Market Revenue Million Forecast, by Deployment Mode 2019 & 2032
- Table 70: Global Utility Billing Software Market Revenue Million Forecast, by End-user Industry 2019 & 2032
- Table 71: Global Utility Billing Software Market Revenue Million Forecast, by Country 2019 & 2032
Frequently Asked Questions
1. What is the projected Compound Annual Growth Rate (CAGR) of the Utility Billing Software Market?
The projected CAGR is approximately 7.95%.
2. Which companies are prominent players in the Utility Billing Software Market?
Key companies in the market include Banyon Data Systems Inc, Sigma Software Solutions Inc, Jendev Corporation, ePsolutions Inc, Utilibill Pvt Ltd, Jayhawk Software Inc, Exceleron Softwares Inc, PayStand Inc, Oracle Corporation*List Not Exhaustive, Harris Computer Systems.
3. What are the main segments of the Utility Billing Software Market?
The market segments include Deployment Mode, End-user Industry.
4. Can you provide details about the market size?
The market size is estimated to be USD 5.76 Million as of 2022.
5. What are some drivers contributing to market growth?
Improvement in Legacy Billing Systems and IT Infrastructure; Growing Investment in Smart Grid Technology.
6. What are the notable trends driving market growth?
Power Distribution Industry Expected to Hold Significant Market Share.
7. Are there any restraints impacting market growth?
Lack of Digital Skills Among End-user Industries.
8. Can you provide examples of recent developments in the market?
October 2022 - Exceleron Softwares Inc. has announced that it has enhanced the MyUsage solution to support amazon web services along with tier -1 private cloud options that MyUsage hybrid cloud offerings provide customers with greater flexibility and scalability; this allows excelerons utility customers to select the hosting option that meets their security and back office requirements.
9. What pricing options are available for accessing the report?
Pricing options include single-user, multi-user, and enterprise licenses priced at USD 4750, USD 5250, and USD 8750 respectively.
10. Is the market size provided in terms of value or volume?
The market size is provided in terms of value, measured in Million.
11. Are there any specific market keywords associated with the report?
Yes, the market keyword associated with the report is "Utility Billing Software Market," which aids in identifying and referencing the specific market segment covered.
12. How do I determine which pricing option suits my needs best?
The pricing options vary based on user requirements and access needs. Individual users may opt for single-user licenses, while businesses requiring broader access may choose multi-user or enterprise licenses for cost-effective access to the report.
13. Are there any additional resources or data provided in the Utility Billing Software Market report?
While the report offers comprehensive insights, it's advisable to review the specific contents or supplementary materials provided to ascertain if additional resources or data are available.
14. How can I stay updated on further developments or reports in the Utility Billing Software Market?
To stay informed about further developments, trends, and reports in the Utility Billing Software Market, consider subscribing to industry newsletters, following relevant companies and organizations, or regularly checking reputable industry news sources and publications.
Methodology
Step 1 - Identification of Relevant Samples Size from Population Database


Step 2 - Approaches for Defining Global Market Size (Value, Volume* & Price*)

Note*: In applicable scenarios
Step 3 - Data Sources
Primary Research
- Web Analytics
- Survey Reports
- Research Institute
- Latest Research Reports
- Opinion Leaders
Secondary Research
- Annual Reports
- White Paper
- Latest Press Release
- Industry Association
- Paid Database
- Investor Presentations

Step 4 - Data Triangulation
Involves using different sources of information in order to increase the validity of a study
These sources are likely to be stakeholders in a program - participants, other researchers, program staff, other community members, and so on.
Then we put all data in single framework & apply various statistical tools to find out the dynamic on the market.
During the analysis stage, feedback from the stakeholder groups would be compared to determine areas of agreement as well as areas of divergence
