

Key Insights
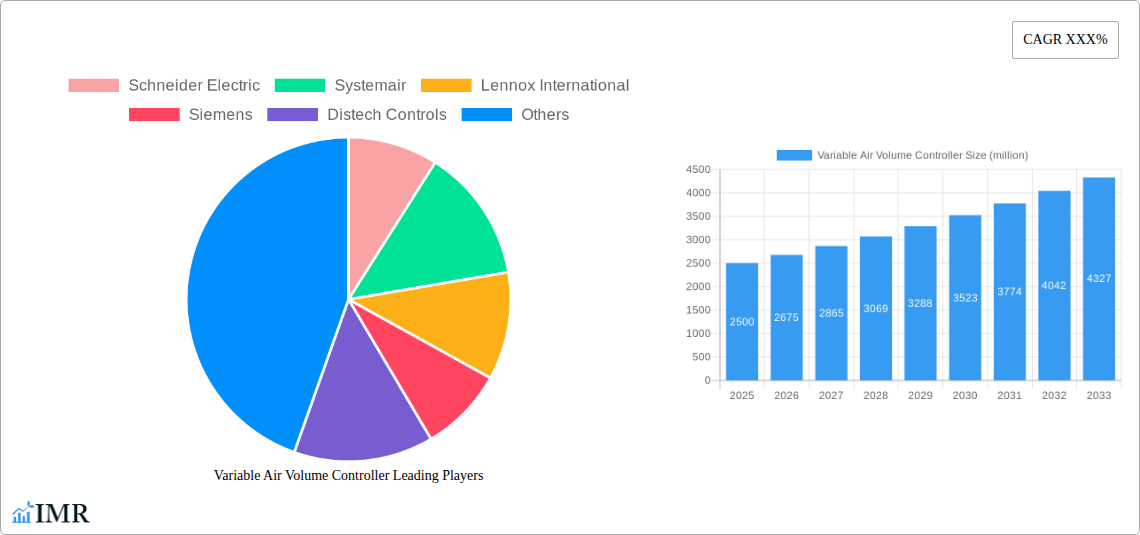
The Variable Air Volume (VAV) controller market is experiencing robust growth, driven by increasing demand for energy-efficient HVAC systems in commercial and industrial buildings. The market, estimated at $2.5 billion in 2025, is projected to expand at a Compound Annual Growth Rate (CAGR) of 7% from 2025 to 2033, reaching approximately $4.2 billion by 2033. This growth is fueled by several factors, including stringent energy regulations, rising awareness of sustainability, and the increasing adoption of smart building technologies. Building automation systems incorporating VAV controllers offer significant energy savings through precise temperature control and reduced HVAC energy consumption, making them an attractive investment for building owners and operators. Furthermore, advancements in technology, such as the integration of IoT and cloud-based platforms for remote monitoring and control, are enhancing the functionality and appeal of VAV controllers.
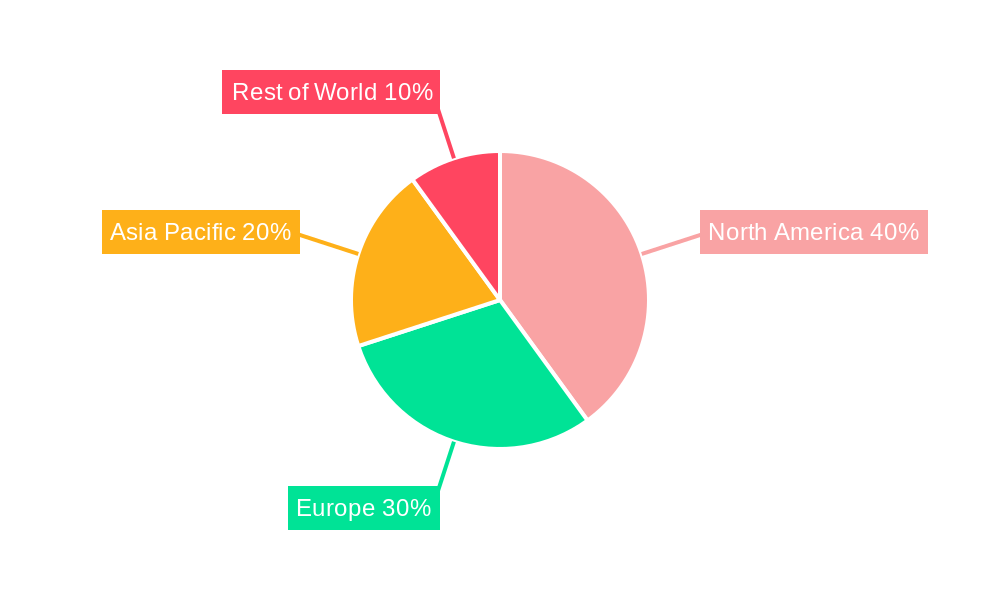
Major market players like Schneider Electric, Siemens, Johnson Controls, and others are driving innovation and competition, offering a wide range of solutions to meet diverse customer needs. However, high initial investment costs and the complexity of integration with existing building management systems can act as restraints. The market is segmented by various factors such as controller type (analog, digital, networked), application (commercial, industrial), and geography. North America currently holds a significant market share, followed by Europe and Asia Pacific. The increasing penetration of smart building technologies in emerging economies is expected to fuel future growth in these regions. The long-term outlook for the VAV controller market remains positive, driven by sustained investments in sustainable building practices and technological advancements.
Variable Air Volume (VAV) Controller Market Report: 2019-2033
This comprehensive report provides an in-depth analysis of the Variable Air Volume (VAV) Controller market, encompassing market dynamics, growth trends, regional analysis, product landscape, key players, and future outlook. The report covers the period from 2019 to 2033, with a focus on the forecast period of 2025-2033 and a base year of 2025. The market is segmented by various factors, providing granular insights for informed decision-making. This report is essential for HVAC manufacturers, building automation companies, system integrators, investors, and market researchers seeking to understand and capitalize on the opportunities within this dynamic sector. Total market size projections are in million units.
Variable Air Volume Controller Market Dynamics & Structure
This section analyzes the competitive landscape, technological advancements, regulatory influences, and market trends within the VAV controller industry. The market is characterized by a moderate level of concentration, with key players holding significant market share but facing continuous pressure from emerging competitors and technological disruptions. We analyze the impact of mergers & acquisitions (M&A) activity, regulatory changes impacting energy efficiency, and the substitution of older technologies with advanced VAV controllers.
- Market Concentration: The top 5 players hold approximately xx% of the market share in 2025.
- Technological Innovation: The adoption of IoT, AI, and cloud-based solutions are key drivers. Barriers to innovation include high R&D costs and the need for interoperability standards.
- Regulatory Framework: Stringent energy efficiency regulations in developed regions are driving demand for advanced VAV controllers. Regional variations in regulations impact market growth differently.
- Competitive Substitutes: Programmable logic controllers (PLCs) and other building automation systems pose some level of competition. However, the unique functionalities of VAV controllers maintain their market dominance.
- End-User Demographics: Commercial buildings (offices, healthcare facilities, etc.) and industrial facilities represent the largest end-user segments. Residential adoption is growing steadily.
- M&A Trends: The number of M&A deals in the VAV controller market has averaged xx per year during the historical period (2019-2024), indicating a trend of consolidation.
Variable Air Volume Controller Growth Trends & Insights
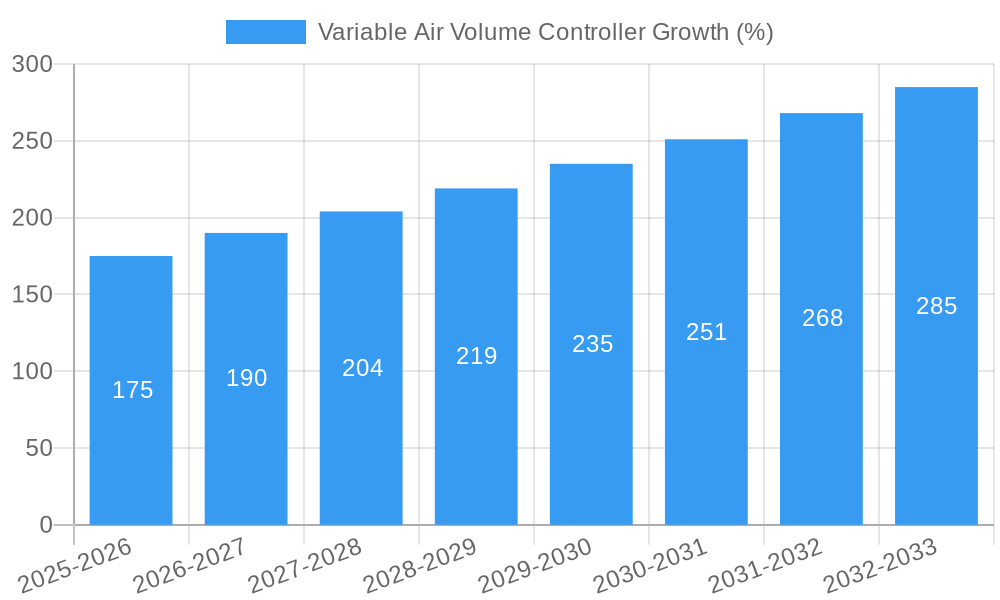
The VAV controller market exhibits robust growth driven by the increasing adoption of smart building technologies and the need for energy-efficient HVAC systems. The market experienced a CAGR of xx% during the historical period (2019-2024), and a projected CAGR of xx% is anticipated during the forecast period (2025-2033). This growth is attributed to increasing construction activities globally, especially in developing economies. The market penetration rate is estimated at xx% in 2025, with significant potential for future growth, particularly in regions with underdeveloped building automation infrastructure. Technological advancements such as IoT integration, predictive maintenance capabilities, and improved user interfaces are driving consumer adoption rates. Shifting consumer preferences towards energy-efficient and intelligent building systems also boost the demand for VAV controllers.
Dominant Regions, Countries, or Segments in Variable Air Volume Controller
North America and Europe currently dominate the VAV controller market, driven by strong demand from commercial building projects and robust building automation infrastructure. Asia-Pacific, particularly China and India, is projected to exhibit significant growth during the forecast period due to rapid urbanization and increasing investments in infrastructure development. Key factors driving regional dominance include favorable economic policies, government initiatives promoting energy efficiency, and technological advancements.
- North America: High adoption of smart building technologies, stringent energy regulations, and a mature building automation market contribute to market leadership.
- Europe: Similar to North America, stringent environmental regulations and a focus on energy-efficient buildings fuel market growth.
- Asia-Pacific: Rapid urbanization and industrialization drive significant growth potential. Government initiatives supporting sustainable building practices further accelerate market expansion.
Variable Air Volume Controller Product Landscape
The VAV controller market encompasses a range of products offering various functionalities, including basic airflow control, advanced features like demand-controlled ventilation (DCV), and integration with building management systems (BMS). Recent innovations focus on improving energy efficiency, enhancing connectivity, and integrating advanced analytics for predictive maintenance. Key features driving product differentiation include enhanced precision, remote monitoring capabilities, and seamless integration with other building automation systems. The market offers various communication protocols like BACnet, Modbus, and LonWorks, enabling interoperability.
Key Drivers, Barriers & Challenges in Variable Air Volume Controller
Key Drivers:
- Increasing demand for energy-efficient HVAC systems.
- Growing adoption of smart building technologies.
- Stringent energy efficiency regulations globally.
- Rising construction activities, particularly in developing economies.
Challenges:
- High initial investment costs can be a barrier for some end-users.
- Complex integration with existing building systems can pose challenges.
- Cybersecurity concerns related to connected devices are a growing concern. The market faces approximately xx million units lost due to cybersecurity breaches annually.
Emerging Opportunities in Variable Air Volume Controller
- Growing demand for energy-efficient solutions in the residential sector.
- Integration of VAV controllers with renewable energy sources.
- Development of advanced analytics and predictive maintenance capabilities.
- Expansion into emerging markets with high growth potential.
Growth Accelerators in the Variable Air Volume Controller Industry
Technological advancements, strategic partnerships between VAV controller manufacturers and building automation companies, and expanding market penetration into developing countries are significant growth catalysts. The development of innovative, cost-effective solutions tailored to the needs of diverse market segments will further accelerate market expansion.
Key Players Shaping the Variable Air Volume Controller Market
- Schneider Electric
- Systemair
- Lennox International
- Siemens
- Distech Controls
- KMC Controls
- Johnson Controls
- Vemco
- Trane
- Emerson Climate Technologies
- Titan Products
- Prolon
- Sensirion
Notable Milestones in Variable Air Volume Controller Sector
- 2020: Launch of a new generation of VAV controllers with integrated IoT capabilities by Schneider Electric.
- 2022: Siemens acquires a smaller VAV controller manufacturer, expanding its product portfolio.
- 2023: Johnson Controls introduces a new line of energy-efficient VAV controllers targeting the residential market.
In-Depth Variable Air Volume Controller Market Outlook
The VAV controller market is poised for continued growth, driven by technological advancements and increasing demand for energy-efficient building solutions. Strategic partnerships and expansion into new markets will play a significant role in shaping future market dynamics. The focus on smart building technologies and the increasing adoption of IoT will create significant opportunities for growth and innovation. The market is expected to reach xx million units by 2033, presenting a lucrative opportunity for existing and new players.
Variable Air Volume Controller Segmentation
-
1. Application
- 1.1. Oil and Gas
- 1.2. HVAC
- 1.3. Industrial
- 1.4. Others
-
2. Type
- 2.1. Pressure Dependent
- 2.2. Pressure Independent
Variable Air Volume Controller Segmentation By Geography
-
1. North America
- 1.1. United States
- 1.2. Canada
- 1.3. Mexico
-
2. South America
- 2.1. Brazil
- 2.2. Argentina
- 2.3. Rest of South America
-
3. Europe
- 3.1. United Kingdom
- 3.2. Germany
- 3.3. France
- 3.4. Italy
- 3.5. Spain
- 3.6. Russia
- 3.7. Benelux
- 3.8. Nordics
- 3.9. Rest of Europe
-
4. Middle East & Africa
- 4.1. Turkey
- 4.2. Israel
- 4.3. GCC
- 4.4. North Africa
- 4.5. South Africa
- 4.6. Rest of Middle East & Africa
-
5. Asia Pacific
- 5.1. China
- 5.2. India
- 5.3. Japan
- 5.4. South Korea
- 5.5. ASEAN
- 5.6. Oceania
- 5.7. Rest of Asia Pacific
Variable Air Volume Controller REPORT HIGHLIGHTS
| Aspects | Details |
|---|---|
| Study Period | 2019-2033 |
| Base Year | 2024 |
| Estimated Year | 2025 |
| Forecast Period | 2025-2033 |
| Historical Period | 2019-2024 |
| Growth Rate | CAGR of XXX% from 2019-2033 |
| Segmentation |
|
Table of Contents
- 1. Introduction
- 1.1. Research Scope
- 1.2. Market Segmentation
- 1.3. Research Methodology
- 1.4. Definitions and Assumptions
- 2. Executive Summary
- 2.1. Introduction
- 3. Market Dynamics
- 3.1. Introduction
- 3.2. Market Drivers
- 3.3. Market Restrains
- 3.4. Market Trends
- 4. Market Factor Analysis
- 4.1. Porters Five Forces
- 4.2. Supply/Value Chain
- 4.3. PESTEL analysis
- 4.4. Market Entropy
- 4.5. Patent/Trademark Analysis
- 5. Global Variable Air Volume Controller Analysis, Insights and Forecast, 2019-2031
- 5.1. Market Analysis, Insights and Forecast - by Application
- 5.1.1. Oil and Gas
- 5.1.2. HVAC
- 5.1.3. Industrial
- 5.1.4. Others
- 5.2. Market Analysis, Insights and Forecast - by Type
- 5.2.1. Pressure Dependent
- 5.2.2. Pressure Independent
- 5.3. Market Analysis, Insights and Forecast - by Region
- 5.3.1. North America
- 5.3.2. South America
- 5.3.3. Europe
- 5.3.4. Middle East & Africa
- 5.3.5. Asia Pacific
- 5.1. Market Analysis, Insights and Forecast - by Application
- 6. North America Variable Air Volume Controller Analysis, Insights and Forecast, 2019-2031
- 6.1. Market Analysis, Insights and Forecast - by Application
- 6.1.1. Oil and Gas
- 6.1.2. HVAC
- 6.1.3. Industrial
- 6.1.4. Others
- 6.2. Market Analysis, Insights and Forecast - by Type
- 6.2.1. Pressure Dependent
- 6.2.2. Pressure Independent
- 6.1. Market Analysis, Insights and Forecast - by Application
- 7. South America Variable Air Volume Controller Analysis, Insights and Forecast, 2019-2031
- 7.1. Market Analysis, Insights and Forecast - by Application
- 7.1.1. Oil and Gas
- 7.1.2. HVAC
- 7.1.3. Industrial
- 7.1.4. Others
- 7.2. Market Analysis, Insights and Forecast - by Type
- 7.2.1. Pressure Dependent
- 7.2.2. Pressure Independent
- 7.1. Market Analysis, Insights and Forecast - by Application
- 8. Europe Variable Air Volume Controller Analysis, Insights and Forecast, 2019-2031
- 8.1. Market Analysis, Insights and Forecast - by Application
- 8.1.1. Oil and Gas
- 8.1.2. HVAC
- 8.1.3. Industrial
- 8.1.4. Others
- 8.2. Market Analysis, Insights and Forecast - by Type
- 8.2.1. Pressure Dependent
- 8.2.2. Pressure Independent
- 8.1. Market Analysis, Insights and Forecast - by Application
- 9. Middle East & Africa Variable Air Volume Controller Analysis, Insights and Forecast, 2019-2031
- 9.1. Market Analysis, Insights and Forecast - by Application
- 9.1.1. Oil and Gas
- 9.1.2. HVAC
- 9.1.3. Industrial
- 9.1.4. Others
- 9.2. Market Analysis, Insights and Forecast - by Type
- 9.2.1. Pressure Dependent
- 9.2.2. Pressure Independent
- 9.1. Market Analysis, Insights and Forecast - by Application
- 10. Asia Pacific Variable Air Volume Controller Analysis, Insights and Forecast, 2019-2031
- 10.1. Market Analysis, Insights and Forecast - by Application
- 10.1.1. Oil and Gas
- 10.1.2. HVAC
- 10.1.3. Industrial
- 10.1.4. Others
- 10.2. Market Analysis, Insights and Forecast - by Type
- 10.2.1. Pressure Dependent
- 10.2.2. Pressure Independent
- 10.1. Market Analysis, Insights and Forecast - by Application
- 11. Competitive Analysis
- 11.1. Global Market Share Analysis 2024
- 11.2. Company Profiles
- 11.2.1 Schneider Electric
- 11.2.1.1. Overview
- 11.2.1.2. Products
- 11.2.1.3. SWOT Analysis
- 11.2.1.4. Recent Developments
- 11.2.1.5. Financials (Based on Availability)
- 11.2.2 Systemair
- 11.2.2.1. Overview
- 11.2.2.2. Products
- 11.2.2.3. SWOT Analysis
- 11.2.2.4. Recent Developments
- 11.2.2.5. Financials (Based on Availability)
- 11.2.3 Lennox International
- 11.2.3.1. Overview
- 11.2.3.2. Products
- 11.2.3.3. SWOT Analysis
- 11.2.3.4. Recent Developments
- 11.2.3.5. Financials (Based on Availability)
- 11.2.4 Siemens
- 11.2.4.1. Overview
- 11.2.4.2. Products
- 11.2.4.3. SWOT Analysis
- 11.2.4.4. Recent Developments
- 11.2.4.5. Financials (Based on Availability)
- 11.2.5 Distech Controls
- 11.2.5.1. Overview
- 11.2.5.2. Products
- 11.2.5.3. SWOT Analysis
- 11.2.5.4. Recent Developments
- 11.2.5.5. Financials (Based on Availability)
- 11.2.6 KMC Controls
- 11.2.6.1. Overview
- 11.2.6.2. Products
- 11.2.6.3. SWOT Analysis
- 11.2.6.4. Recent Developments
- 11.2.6.5. Financials (Based on Availability)
- 11.2.7 Johnson Controls
- 11.2.7.1. Overview
- 11.2.7.2. Products
- 11.2.7.3. SWOT Analysis
- 11.2.7.4. Recent Developments
- 11.2.7.5. Financials (Based on Availability)
- 11.2.8 Vemco
- 11.2.8.1. Overview
- 11.2.8.2. Products
- 11.2.8.3. SWOT Analysis
- 11.2.8.4. Recent Developments
- 11.2.8.5. Financials (Based on Availability)
- 11.2.9 Trane
- 11.2.9.1. Overview
- 11.2.9.2. Products
- 11.2.9.3. SWOT Analysis
- 11.2.9.4. Recent Developments
- 11.2.9.5. Financials (Based on Availability)
- 11.2.10 Emerson Climate Technologies
- 11.2.10.1. Overview
- 11.2.10.2. Products
- 11.2.10.3. SWOT Analysis
- 11.2.10.4. Recent Developments
- 11.2.10.5. Financials (Based on Availability)
- 11.2.11 Titan Products
- 11.2.11.1. Overview
- 11.2.11.2. Products
- 11.2.11.3. SWOT Analysis
- 11.2.11.4. Recent Developments
- 11.2.11.5. Financials (Based on Availability)
- 11.2.12 Prolon
- 11.2.12.1. Overview
- 11.2.12.2. Products
- 11.2.12.3. SWOT Analysis
- 11.2.12.4. Recent Developments
- 11.2.12.5. Financials (Based on Availability)
- 11.2.13 Sensirion
- 11.2.13.1. Overview
- 11.2.13.2. Products
- 11.2.13.3. SWOT Analysis
- 11.2.13.4. Recent Developments
- 11.2.13.5. Financials (Based on Availability)
- 11.2.1 Schneider Electric
List of Figures
- Figure 1: Global Variable Air Volume Controller Revenue Breakdown (million, %) by Region 2024 & 2032
- Figure 2: Global Variable Air Volume Controller Volume Breakdown (K, %) by Region 2024 & 2032
- Figure 3: North America Variable Air Volume Controller Revenue (million), by Application 2024 & 2032
- Figure 4: North America Variable Air Volume Controller Volume (K), by Application 2024 & 2032
- Figure 5: North America Variable Air Volume Controller Revenue Share (%), by Application 2024 & 2032
- Figure 6: North America Variable Air Volume Controller Volume Share (%), by Application 2024 & 2032
- Figure 7: North America Variable Air Volume Controller Revenue (million), by Type 2024 & 2032
- Figure 8: North America Variable Air Volume Controller Volume (K), by Type 2024 & 2032
- Figure 9: North America Variable Air Volume Controller Revenue Share (%), by Type 2024 & 2032
- Figure 10: North America Variable Air Volume Controller Volume Share (%), by Type 2024 & 2032
- Figure 11: North America Variable Air Volume Controller Revenue (million), by Country 2024 & 2032
- Figure 12: North America Variable Air Volume Controller Volume (K), by Country 2024 & 2032
- Figure 13: North America Variable Air Volume Controller Revenue Share (%), by Country 2024 & 2032
- Figure 14: North America Variable Air Volume Controller Volume Share (%), by Country 2024 & 2032
- Figure 15: South America Variable Air Volume Controller Revenue (million), by Application 2024 & 2032
- Figure 16: South America Variable Air Volume Controller Volume (K), by Application 2024 & 2032
- Figure 17: South America Variable Air Volume Controller Revenue Share (%), by Application 2024 & 2032
- Figure 18: South America Variable Air Volume Controller Volume Share (%), by Application 2024 & 2032
- Figure 19: South America Variable Air Volume Controller Revenue (million), by Type 2024 & 2032
- Figure 20: South America Variable Air Volume Controller Volume (K), by Type 2024 & 2032
- Figure 21: South America Variable Air Volume Controller Revenue Share (%), by Type 2024 & 2032
- Figure 22: South America Variable Air Volume Controller Volume Share (%), by Type 2024 & 2032
- Figure 23: South America Variable Air Volume Controller Revenue (million), by Country 2024 & 2032
- Figure 24: South America Variable Air Volume Controller Volume (K), by Country 2024 & 2032
- Figure 25: South America Variable Air Volume Controller Revenue Share (%), by Country 2024 & 2032
- Figure 26: South America Variable Air Volume Controller Volume Share (%), by Country 2024 & 2032
- Figure 27: Europe Variable Air Volume Controller Revenue (million), by Application 2024 & 2032
- Figure 28: Europe Variable Air Volume Controller Volume (K), by Application 2024 & 2032
- Figure 29: Europe Variable Air Volume Controller Revenue Share (%), by Application 2024 & 2032
- Figure 30: Europe Variable Air Volume Controller Volume Share (%), by Application 2024 & 2032
- Figure 31: Europe Variable Air Volume Controller Revenue (million), by Type 2024 & 2032
- Figure 32: Europe Variable Air Volume Controller Volume (K), by Type 2024 & 2032
- Figure 33: Europe Variable Air Volume Controller Revenue Share (%), by Type 2024 & 2032
- Figure 34: Europe Variable Air Volume Controller Volume Share (%), by Type 2024 & 2032
- Figure 35: Europe Variable Air Volume Controller Revenue (million), by Country 2024 & 2032
- Figure 36: Europe Variable Air Volume Controller Volume (K), by Country 2024 & 2032
- Figure 37: Europe Variable Air Volume Controller Revenue Share (%), by Country 2024 & 2032
- Figure 38: Europe Variable Air Volume Controller Volume Share (%), by Country 2024 & 2032
- Figure 39: Middle East & Africa Variable Air Volume Controller Revenue (million), by Application 2024 & 2032
- Figure 40: Middle East & Africa Variable Air Volume Controller Volume (K), by Application 2024 & 2032
- Figure 41: Middle East & Africa Variable Air Volume Controller Revenue Share (%), by Application 2024 & 2032
- Figure 42: Middle East & Africa Variable Air Volume Controller Volume Share (%), by Application 2024 & 2032
- Figure 43: Middle East & Africa Variable Air Volume Controller Revenue (million), by Type 2024 & 2032
- Figure 44: Middle East & Africa Variable Air Volume Controller Volume (K), by Type 2024 & 2032
- Figure 45: Middle East & Africa Variable Air Volume Controller Revenue Share (%), by Type 2024 & 2032
- Figure 46: Middle East & Africa Variable Air Volume Controller Volume Share (%), by Type 2024 & 2032
- Figure 47: Middle East & Africa Variable Air Volume Controller Revenue (million), by Country 2024 & 2032
- Figure 48: Middle East & Africa Variable Air Volume Controller Volume (K), by Country 2024 & 2032
- Figure 49: Middle East & Africa Variable Air Volume Controller Revenue Share (%), by Country 2024 & 2032
- Figure 50: Middle East & Africa Variable Air Volume Controller Volume Share (%), by Country 2024 & 2032
- Figure 51: Asia Pacific Variable Air Volume Controller Revenue (million), by Application 2024 & 2032
- Figure 52: Asia Pacific Variable Air Volume Controller Volume (K), by Application 2024 & 2032
- Figure 53: Asia Pacific Variable Air Volume Controller Revenue Share (%), by Application 2024 & 2032
- Figure 54: Asia Pacific Variable Air Volume Controller Volume Share (%), by Application 2024 & 2032
- Figure 55: Asia Pacific Variable Air Volume Controller Revenue (million), by Type 2024 & 2032
- Figure 56: Asia Pacific Variable Air Volume Controller Volume (K), by Type 2024 & 2032
- Figure 57: Asia Pacific Variable Air Volume Controller Revenue Share (%), by Type 2024 & 2032
- Figure 58: Asia Pacific Variable Air Volume Controller Volume Share (%), by Type 2024 & 2032
- Figure 59: Asia Pacific Variable Air Volume Controller Revenue (million), by Country 2024 & 2032
- Figure 60: Asia Pacific Variable Air Volume Controller Volume (K), by Country 2024 & 2032
- Figure 61: Asia Pacific Variable Air Volume Controller Revenue Share (%), by Country 2024 & 2032
- Figure 62: Asia Pacific Variable Air Volume Controller Volume Share (%), by Country 2024 & 2032
List of Tables
- Table 1: Global Variable Air Volume Controller Revenue million Forecast, by Region 2019 & 2032
- Table 2: Global Variable Air Volume Controller Volume K Forecast, by Region 2019 & 2032
- Table 3: Global Variable Air Volume Controller Revenue million Forecast, by Application 2019 & 2032
- Table 4: Global Variable Air Volume Controller Volume K Forecast, by Application 2019 & 2032
- Table 5: Global Variable Air Volume Controller Revenue million Forecast, by Type 2019 & 2032
- Table 6: Global Variable Air Volume Controller Volume K Forecast, by Type 2019 & 2032
- Table 7: Global Variable Air Volume Controller Revenue million Forecast, by Region 2019 & 2032
- Table 8: Global Variable Air Volume Controller Volume K Forecast, by Region 2019 & 2032
- Table 9: Global Variable Air Volume Controller Revenue million Forecast, by Application 2019 & 2032
- Table 10: Global Variable Air Volume Controller Volume K Forecast, by Application 2019 & 2032
- Table 11: Global Variable Air Volume Controller Revenue million Forecast, by Type 2019 & 2032
- Table 12: Global Variable Air Volume Controller Volume K Forecast, by Type 2019 & 2032
- Table 13: Global Variable Air Volume Controller Revenue million Forecast, by Country 2019 & 2032
- Table 14: Global Variable Air Volume Controller Volume K Forecast, by Country 2019 & 2032
- Table 15: United States Variable Air Volume Controller Revenue (million) Forecast, by Application 2019 & 2032
- Table 16: United States Variable Air Volume Controller Volume (K) Forecast, by Application 2019 & 2032
- Table 17: Canada Variable Air Volume Controller Revenue (million) Forecast, by Application 2019 & 2032
- Table 18: Canada Variable Air Volume Controller Volume (K) Forecast, by Application 2019 & 2032
- Table 19: Mexico Variable Air Volume Controller Revenue (million) Forecast, by Application 2019 & 2032
- Table 20: Mexico Variable Air Volume Controller Volume (K) Forecast, by Application 2019 & 2032
- Table 21: Global Variable Air Volume Controller Revenue million Forecast, by Application 2019 & 2032
- Table 22: Global Variable Air Volume Controller Volume K Forecast, by Application 2019 & 2032
- Table 23: Global Variable Air Volume Controller Revenue million Forecast, by Type 2019 & 2032
- Table 24: Global Variable Air Volume Controller Volume K Forecast, by Type 2019 & 2032
- Table 25: Global Variable Air Volume Controller Revenue million Forecast, by Country 2019 & 2032
- Table 26: Global Variable Air Volume Controller Volume K Forecast, by Country 2019 & 2032
- Table 27: Brazil Variable Air Volume Controller Revenue (million) Forecast, by Application 2019 & 2032
- Table 28: Brazil Variable Air Volume Controller Volume (K) Forecast, by Application 2019 & 2032
- Table 29: Argentina Variable Air Volume Controller Revenue (million) Forecast, by Application 2019 & 2032
- Table 30: Argentina Variable Air Volume Controller Volume (K) Forecast, by Application 2019 & 2032
- Table 31: Rest of South America Variable Air Volume Controller Revenue (million) Forecast, by Application 2019 & 2032
- Table 32: Rest of South America Variable Air Volume Controller Volume (K) Forecast, by Application 2019 & 2032
- Table 33: Global Variable Air Volume Controller Revenue million Forecast, by Application 2019 & 2032
- Table 34: Global Variable Air Volume Controller Volume K Forecast, by Application 2019 & 2032
- Table 35: Global Variable Air Volume Controller Revenue million Forecast, by Type 2019 & 2032
- Table 36: Global Variable Air Volume Controller Volume K Forecast, by Type 2019 & 2032
- Table 37: Global Variable Air Volume Controller Revenue million Forecast, by Country 2019 & 2032
- Table 38: Global Variable Air Volume Controller Volume K Forecast, by Country 2019 & 2032
- Table 39: United Kingdom Variable Air Volume Controller Revenue (million) Forecast, by Application 2019 & 2032
- Table 40: United Kingdom Variable Air Volume Controller Volume (K) Forecast, by Application 2019 & 2032
- Table 41: Germany Variable Air Volume Controller Revenue (million) Forecast, by Application 2019 & 2032
- Table 42: Germany Variable Air Volume Controller Volume (K) Forecast, by Application 2019 & 2032
- Table 43: France Variable Air Volume Controller Revenue (million) Forecast, by Application 2019 & 2032
- Table 44: France Variable Air Volume Controller Volume (K) Forecast, by Application 2019 & 2032
- Table 45: Italy Variable Air Volume Controller Revenue (million) Forecast, by Application 2019 & 2032
- Table 46: Italy Variable Air Volume Controller Volume (K) Forecast, by Application 2019 & 2032
- Table 47: Spain Variable Air Volume Controller Revenue (million) Forecast, by Application 2019 & 2032
- Table 48: Spain Variable Air Volume Controller Volume (K) Forecast, by Application 2019 & 2032
- Table 49: Russia Variable Air Volume Controller Revenue (million) Forecast, by Application 2019 & 2032
- Table 50: Russia Variable Air Volume Controller Volume (K) Forecast, by Application 2019 & 2032
- Table 51: Benelux Variable Air Volume Controller Revenue (million) Forecast, by Application 2019 & 2032
- Table 52: Benelux Variable Air Volume Controller Volume (K) Forecast, by Application 2019 & 2032
- Table 53: Nordics Variable Air Volume Controller Revenue (million) Forecast, by Application 2019 & 2032
- Table 54: Nordics Variable Air Volume Controller Volume (K) Forecast, by Application 2019 & 2032
- Table 55: Rest of Europe Variable Air Volume Controller Revenue (million) Forecast, by Application 2019 & 2032
- Table 56: Rest of Europe Variable Air Volume Controller Volume (K) Forecast, by Application 2019 & 2032
- Table 57: Global Variable Air Volume Controller Revenue million Forecast, by Application 2019 & 2032
- Table 58: Global Variable Air Volume Controller Volume K Forecast, by Application 2019 & 2032
- Table 59: Global Variable Air Volume Controller Revenue million Forecast, by Type 2019 & 2032
- Table 60: Global Variable Air Volume Controller Volume K Forecast, by Type 2019 & 2032
- Table 61: Global Variable Air Volume Controller Revenue million Forecast, by Country 2019 & 2032
- Table 62: Global Variable Air Volume Controller Volume K Forecast, by Country 2019 & 2032
- Table 63: Turkey Variable Air Volume Controller Revenue (million) Forecast, by Application 2019 & 2032
- Table 64: Turkey Variable Air Volume Controller Volume (K) Forecast, by Application 2019 & 2032
- Table 65: Israel Variable Air Volume Controller Revenue (million) Forecast, by Application 2019 & 2032
- Table 66: Israel Variable Air Volume Controller Volume (K) Forecast, by Application 2019 & 2032
- Table 67: GCC Variable Air Volume Controller Revenue (million) Forecast, by Application 2019 & 2032
- Table 68: GCC Variable Air Volume Controller Volume (K) Forecast, by Application 2019 & 2032
- Table 69: North Africa Variable Air Volume Controller Revenue (million) Forecast, by Application 2019 & 2032
- Table 70: North Africa Variable Air Volume Controller Volume (K) Forecast, by Application 2019 & 2032
- Table 71: South Africa Variable Air Volume Controller Revenue (million) Forecast, by Application 2019 & 2032
- Table 72: South Africa Variable Air Volume Controller Volume (K) Forecast, by Application 2019 & 2032
- Table 73: Rest of Middle East & Africa Variable Air Volume Controller Revenue (million) Forecast, by Application 2019 & 2032
- Table 74: Rest of Middle East & Africa Variable Air Volume Controller Volume (K) Forecast, by Application 2019 & 2032
- Table 75: Global Variable Air Volume Controller Revenue million Forecast, by Application 2019 & 2032
- Table 76: Global Variable Air Volume Controller Volume K Forecast, by Application 2019 & 2032
- Table 77: Global Variable Air Volume Controller Revenue million Forecast, by Type 2019 & 2032
- Table 78: Global Variable Air Volume Controller Volume K Forecast, by Type 2019 & 2032
- Table 79: Global Variable Air Volume Controller Revenue million Forecast, by Country 2019 & 2032
- Table 80: Global Variable Air Volume Controller Volume K Forecast, by Country 2019 & 2032
- Table 81: China Variable Air Volume Controller Revenue (million) Forecast, by Application 2019 & 2032
- Table 82: China Variable Air Volume Controller Volume (K) Forecast, by Application 2019 & 2032
- Table 83: India Variable Air Volume Controller Revenue (million) Forecast, by Application 2019 & 2032
- Table 84: India Variable Air Volume Controller Volume (K) Forecast, by Application 2019 & 2032
- Table 85: Japan Variable Air Volume Controller Revenue (million) Forecast, by Application 2019 & 2032
- Table 86: Japan Variable Air Volume Controller Volume (K) Forecast, by Application 2019 & 2032
- Table 87: South Korea Variable Air Volume Controller Revenue (million) Forecast, by Application 2019 & 2032
- Table 88: South Korea Variable Air Volume Controller Volume (K) Forecast, by Application 2019 & 2032
- Table 89: ASEAN Variable Air Volume Controller Revenue (million) Forecast, by Application 2019 & 2032
- Table 90: ASEAN Variable Air Volume Controller Volume (K) Forecast, by Application 2019 & 2032
- Table 91: Oceania Variable Air Volume Controller Revenue (million) Forecast, by Application 2019 & 2032
- Table 92: Oceania Variable Air Volume Controller Volume (K) Forecast, by Application 2019 & 2032
- Table 93: Rest of Asia Pacific Variable Air Volume Controller Revenue (million) Forecast, by Application 2019 & 2032
- Table 94: Rest of Asia Pacific Variable Air Volume Controller Volume (K) Forecast, by Application 2019 & 2032
Frequently Asked Questions
1. What is the projected Compound Annual Growth Rate (CAGR) of the Variable Air Volume Controller?
The projected CAGR is approximately XXX%.
2. Which companies are prominent players in the Variable Air Volume Controller?
Key companies in the market include Schneider Electric, Systemair, Lennox International, Siemens, Distech Controls, KMC Controls, Johnson Controls, Vemco, Trane, Emerson Climate Technologies, Titan Products, Prolon, Sensirion.
3. What are the main segments of the Variable Air Volume Controller?
The market segments include Application, Type.
4. Can you provide details about the market size?
The market size is estimated to be USD XXX million as of 2022.
5. What are some drivers contributing to market growth?
N/A
6. What are the notable trends driving market growth?
N/A
7. Are there any restraints impacting market growth?
N/A
8. Can you provide examples of recent developments in the market?
N/A
9. What pricing options are available for accessing the report?
Pricing options include single-user, multi-user, and enterprise licenses priced at USD 2900.00, USD 4350.00, and USD 5800.00 respectively.
10. Is the market size provided in terms of value or volume?
The market size is provided in terms of value, measured in million and volume, measured in K.
11. Are there any specific market keywords associated with the report?
Yes, the market keyword associated with the report is "Variable Air Volume Controller," which aids in identifying and referencing the specific market segment covered.
12. How do I determine which pricing option suits my needs best?
The pricing options vary based on user requirements and access needs. Individual users may opt for single-user licenses, while businesses requiring broader access may choose multi-user or enterprise licenses for cost-effective access to the report.
13. Are there any additional resources or data provided in the Variable Air Volume Controller report?
While the report offers comprehensive insights, it's advisable to review the specific contents or supplementary materials provided to ascertain if additional resources or data are available.
14. How can I stay updated on further developments or reports in the Variable Air Volume Controller?
To stay informed about further developments, trends, and reports in the Variable Air Volume Controller, consider subscribing to industry newsletters, following relevant companies and organizations, or regularly checking reputable industry news sources and publications.
Methodology
Step 1 - Identification of Relevant Samples Size from Population Database


Step 2 - Approaches for Defining Global Market Size (Value, Volume* & Price*)

Note*: In applicable scenarios
Step 3 - Data Sources
Primary Research
- Web Analytics
- Survey Reports
- Research Institute
- Latest Research Reports
- Opinion Leaders
Secondary Research
- Annual Reports
- White Paper
- Latest Press Release
- Industry Association
- Paid Database
- Investor Presentations

Step 4 - Data Triangulation
Involves using different sources of information in order to increase the validity of a study
These sources are likely to be stakeholders in a program - participants, other researchers, program staff, other community members, and so on.
Then we put all data in single framework & apply various statistical tools to find out the dynamic on the market.
During the analysis stage, feedback from the stakeholder groups would be compared to determine areas of agreement as well as areas of divergence
