

Key Insights
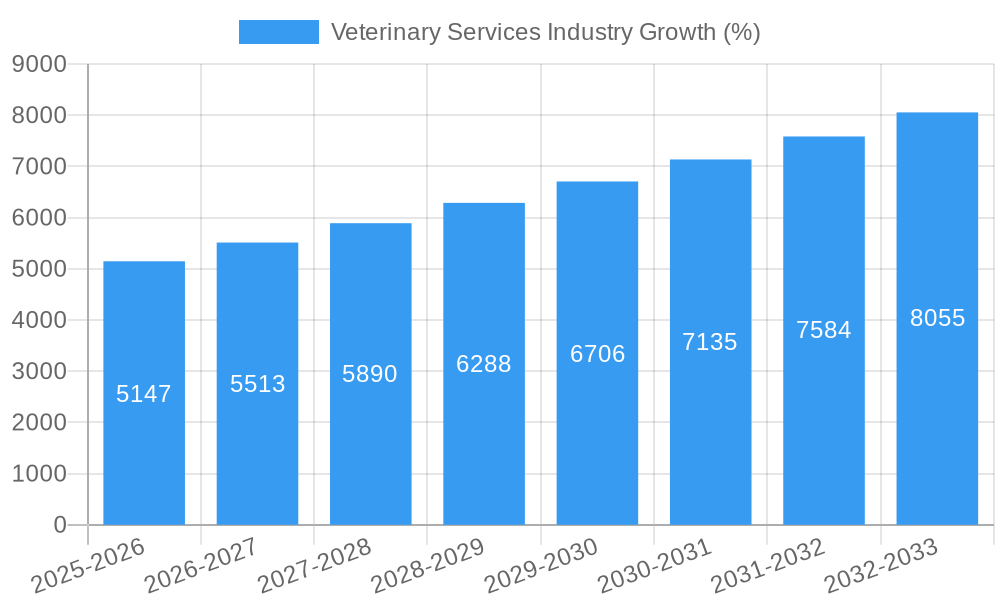
The global veterinary services market, valued at $88.22 billion in 2025, is projected to experience robust growth, driven by several key factors. Rising pet ownership worldwide, coupled with increasing humanization of pets and a greater willingness to invest in their healthcare, significantly fuels market expansion. Technological advancements, such as advanced diagnostic imaging and minimally invasive surgical techniques, are enhancing the quality and scope of veterinary care, further stimulating demand. The growing prevalence of chronic diseases in animals, mirroring human health trends, necessitates ongoing veterinary attention, contributing to market growth. The market is segmented by animal type (companion and production animals) and service type (primary, emergency, critical, specialty, and others like diagnostics and counseling). This segmentation highlights the diverse service offerings catering to varied animal needs and healthcare complexities. The competitive landscape includes both multinational corporations like Zoetis, Elanco, and Boehringer Ingelheim, and regional players, indicating a blend of established expertise and emerging innovation. Geographical variations in market penetration are expected, with North America and Europe maintaining significant market shares due to higher pet ownership rates and advanced healthcare infrastructure, while Asia-Pacific is anticipated to exhibit substantial growth potential in the coming years, fueled by rising disposable incomes and increasing pet adoption.
The projected Compound Annual Growth Rate (CAGR) of 5.59% from 2025 to 2033 indicates consistent market expansion. However, several factors could influence this growth trajectory. Economic fluctuations and variations in pet ownership trends can impact overall demand. The regulatory landscape surrounding veterinary practices and drug approvals can also play a role. The increasing competition among providers necessitates innovation and strategic partnerships to maintain a competitive edge. Furthermore, addressing affordability concerns related to veterinary care, especially in developing regions, remains crucial for sustainable market growth. Despite these challenges, the long-term outlook for the veterinary services market remains positive, driven by the enduring human-animal bond and the increasing focus on animal welfare.
This comprehensive report provides a detailed analysis of the Veterinary Services industry, encompassing market dynamics, growth trends, regional dominance, product landscape, key players, and future outlook. The study period covers 2019-2033, with a base year of 2025 and a forecast period of 2025-2033. The report segments the market by animal type (companion and production animals) and type of care (primary, emergency, critical, specialty, and others, including diagnostic services and pet care counseling). This in-depth analysis is crucial for veterinary professionals, investors, and businesses seeking to understand and capitalize on the burgeoning opportunities within this vital sector.

Veterinary Services Industry Market Dynamics & Structure
The global veterinary services market, valued at $xx million in 2024, is characterized by moderate concentration with a few large multinational corporations and numerous smaller regional players. Technological innovation, particularly in diagnostics and therapeutics, is a key driver, alongside increasing pet ownership and rising awareness of animal health. Stringent regulatory frameworks governing pharmaceuticals and veterinary practices significantly impact market dynamics. Competitive product substitutes, such as home remedies and alternative therapies, exist but pose a relatively limited threat. End-user demographics, particularly the growing middle class in emerging economies, contribute to market expansion. M&A activity has been relatively active in recent years, with an estimated xx million deals in the historical period (2019-2024), driven by consolidation and expansion efforts.
- Market Concentration: Moderately concentrated, with top 5 players holding approximately xx% market share in 2024.
- Technological Innovation: Focus on diagnostics (e.g., IDEXX Laboratories), therapeutics (e.g., Zoetis), and telehealth is driving growth.
- Regulatory Frameworks: Stringent regulations on drug approvals and veterinary practices present both opportunities and challenges.
- Competitive Substitutes: Limited impact from alternative therapies, but potential for growth in this space.
- End-User Demographics: Rising pet ownership, especially in developing nations, fuels demand.
- M&A Trends: Consolidation trend, with xx million in deal value recorded during 2019-2024.
Veterinary Services Industry Growth Trends & Insights
The veterinary services market demonstrates robust growth, exhibiting a CAGR of xx% during the historical period (2019-2024). This growth is primarily fueled by increasing pet ownership, rising disposable incomes, escalating demand for premium pet care services, and the development of innovative diagnostic and therapeutic tools. Technological disruptions, such as the integration of telemedicine and advanced diagnostic imaging, are significantly improving the quality and efficiency of veterinary care. A shift towards preventive care and proactive health management is also driving market expansion. Market penetration is relatively high in developed countries, but significant untapped potential exists in developing regions with increasing pet ownership rates.
- Market Size Evolution: Growth from $xx million in 2019 to $xx million in 2024, projected to reach $xx million by 2033.
- Adoption Rates: High adoption of advanced diagnostics and therapeutic technologies in developed markets.
- Technological Disruptions: Telemedicine, AI-powered diagnostics, and advanced surgical techniques are transforming the industry.
- Consumer Behavior Shifts: Increased willingness to spend on premium pet care services and preventive health measures.
Dominant Regions, Countries, or Segments in Veterinary Services Industry
The North American region currently holds the largest market share within the veterinary services sector, driven by high pet ownership rates, advanced healthcare infrastructure, and strong regulatory frameworks. Within the animal type segment, companion animals contribute significantly to market revenue due to higher per-animal spending on care and services. Primary care services constitute the largest segment by type of care, reflecting the focus on preventive health and regular check-ups.
- North America: High pet ownership, advanced infrastructure, and significant spending on animal health contribute to its dominance.
- Europe: Strong regulatory environment and a large, established veterinary sector.
- Asia-Pacific: High growth potential due to rising middle class and increasing pet ownership.
- Companion Animals: High revenue generation due to increased pet ownership and higher per-animal spending.
- Primary Care: Largest segment by type of care, driven by preventive health initiatives.
Veterinary Services Industry Product Landscape
The veterinary services market encompasses a wide array of products, including pharmaceuticals, diagnostic tools, surgical instruments, and other consumables. Recent innovations include advanced diagnostic imaging technologies, such as MRI and CT scans, as well as novel therapeutics targeting specific diseases. Product differentiation focuses on efficacy, safety, ease of use, and cost-effectiveness. Technological advancements lead to more precise diagnostics, improved treatment outcomes, and reduced invasive procedures.
Key Drivers, Barriers & Challenges in Veterinary Services Industry
Key Drivers:
- Rising pet ownership and humanization of pets.
- Increasing disposable incomes in developing economies.
- Technological advancements in diagnostics and therapeutics.
- Growing awareness of animal welfare and preventative care.
Key Barriers and Challenges:
- High cost of advanced diagnostic and treatment technologies.
- Stringent regulatory approvals for pharmaceuticals and medical devices.
- Competition from alternative therapies and generic products.
- Supply chain disruptions affecting the availability of essential veterinary products. This has caused price increases averaging xx% in the past year.
Emerging Opportunities in Veterinary Services Industry
- Untapped markets in developing economies with rising pet ownership.
- Growth in specialized veterinary services, such as oncology and cardiology.
- Increasing demand for telemedicine and remote monitoring technologies.
- Development of personalized medicine and targeted therapies for animal health.
Growth Accelerators in the Veterinary Services Industry
Technological breakthroughs, especially in diagnostics and therapeutics, are crucial growth catalysts. Strategic partnerships between pharmaceutical companies and veterinary clinics facilitate the dissemination of innovative products and services. Expanding into underserved markets and adapting to changing consumer preferences (e.g., demand for natural and holistic care) will drive future growth.
Key Players Shaping the Veterinary Services Market
- Zoetis Services LLC
- Elanco
- Boehringer Ingelheim GmbH
- IDEXX Laboratories Inc
- Indian Immunologicals Ltd
- Vetoquinol S A
- Hester Bioscience
- Heska Corp
- Ceva Sant Animale
- Phibro Animal Health
- Virbac
- Merck Animal Health
Notable Milestones in Veterinary Services Industry Sector
- April 2022: Animalcare launched Plaqtiv+, a new dental care product line for cats and dogs. This launch expanded the company's product portfolio and broadened its market reach.
- April 2022: Aurena Laboratories AB partnered with Emollivet to manufacture innovative animal healthcare products, leveraging Lipitor AKVANO technology. This collaboration fostered innovation and facilitated product development within the market.
In-Depth Veterinary Services Industry Market Outlook
The veterinary services market is poised for continued growth, driven by several factors. The increasing human-animal bond, coupled with rising disposable incomes and greater access to veterinary care, will fuel demand. Technological advancements will continue to improve diagnostic accuracy and treatment efficacy, while the emergence of personalized medicine will further personalize animal healthcare. Strategic partnerships and market expansion into developing economies present significant opportunities for growth in the coming years. The market is expected to reach $xx million by 2033, representing substantial growth potential for industry players.
Veterinary Services Industry Segmentation
-
1. Animal Type
- 1.1. Companion Animal
- 1.2. Production Animal
-
2. Type of Care
- 2.1. Primary
- 2.2. Emergency
- 2.3. Critical
- 2.4. Specialty Services
- 2.5. Others S
Veterinary Services Industry Segmentation By Geography
-
1. North America
- 1.1. United States
- 1.2. Canada
- 1.3. Mexico
-
2. Europe
- 2.1. Germany
- 2.2. United Kingdom
- 2.3. France
- 2.4. Italy
- 2.5. Spain
- 2.6. Rest of Europe
-
3. Asia Pacific
- 3.1. China
- 3.2. Japan
- 3.3. India
- 3.4. Australia
- 3.5. South Korea
- 3.6. Rest of Asia Pacific
-
4. Middle East and Africa
- 4.1. GCC
- 4.2. South Africa
- 4.3. Rest of Middle East and Africa
-
5. South America
- 5.1. Brazil
- 5.2. Argentina
- 5.3. Rest of South America

Veterinary Services Industry REPORT HIGHLIGHTS
| Aspects | Details |
|---|---|
| Study Period | 2019-2033 |
| Base Year | 2024 |
| Estimated Year | 2025 |
| Forecast Period | 2025-2033 |
| Historical Period | 2019-2024 |
| Growth Rate | CAGR of 5.59% from 2019-2033 |
| Segmentation |
|
Table of Contents
- 1. Introduction
- 1.1. Research Scope
- 1.2. Market Segmentation
- 1.3. Research Methodology
- 1.4. Definitions and Assumptions
- 2. Executive Summary
- 2.1. Introduction
- 3. Market Dynamics
- 3.1. Introduction
- 3.2. Market Drivers
- 3.2.1. Rising Chronic Diseases and Awareness Regarding Veterinary Care; Increasing Initiatives by Governments and Animal Welfare Associations in Different Countries
- 3.3. Market Restrains
- 3.3.1. Increasing Costs of Animal Care Product and Veterinary Services
- 3.4. Market Trends
- 3.4.1. Companion Animal Segment is Expected to Hold Significant Market Share in the Market Over the Forecast Period
- 4. Market Factor Analysis
- 4.1. Porters Five Forces
- 4.2. Supply/Value Chain
- 4.3. PESTEL analysis
- 4.4. Market Entropy
- 4.5. Patent/Trademark Analysis
- 5. Global Veterinary Services Industry Analysis, Insights and Forecast, 2019-2031
- 5.1. Market Analysis, Insights and Forecast - by Animal Type
- 5.1.1. Companion Animal
- 5.1.2. Production Animal
- 5.2. Market Analysis, Insights and Forecast - by Type of Care
- 5.2.1. Primary
- 5.2.2. Emergency
- 5.2.3. Critical
- 5.2.4. Specialty Services
- 5.2.5. Others S
- 5.3. Market Analysis, Insights and Forecast - by Region
- 5.3.1. North America
- 5.3.2. Europe
- 5.3.3. Asia Pacific
- 5.3.4. Middle East and Africa
- 5.3.5. South America
- 5.1. Market Analysis, Insights and Forecast - by Animal Type
- 6. North America Veterinary Services Industry Analysis, Insights and Forecast, 2019-2031
- 6.1. Market Analysis, Insights and Forecast - by Animal Type
- 6.1.1. Companion Animal
- 6.1.2. Production Animal
- 6.2. Market Analysis, Insights and Forecast - by Type of Care
- 6.2.1. Primary
- 6.2.2. Emergency
- 6.2.3. Critical
- 6.2.4. Specialty Services
- 6.2.5. Others S
- 6.1. Market Analysis, Insights and Forecast - by Animal Type
- 7. Europe Veterinary Services Industry Analysis, Insights and Forecast, 2019-2031
- 7.1. Market Analysis, Insights and Forecast - by Animal Type
- 7.1.1. Companion Animal
- 7.1.2. Production Animal
- 7.2. Market Analysis, Insights and Forecast - by Type of Care
- 7.2.1. Primary
- 7.2.2. Emergency
- 7.2.3. Critical
- 7.2.4. Specialty Services
- 7.2.5. Others S
- 7.1. Market Analysis, Insights and Forecast - by Animal Type
- 8. Asia Pacific Veterinary Services Industry Analysis, Insights and Forecast, 2019-2031
- 8.1. Market Analysis, Insights and Forecast - by Animal Type
- 8.1.1. Companion Animal
- 8.1.2. Production Animal
- 8.2. Market Analysis, Insights and Forecast - by Type of Care
- 8.2.1. Primary
- 8.2.2. Emergency
- 8.2.3. Critical
- 8.2.4. Specialty Services
- 8.2.5. Others S
- 8.1. Market Analysis, Insights and Forecast - by Animal Type
- 9. Middle East and Africa Veterinary Services Industry Analysis, Insights and Forecast, 2019-2031
- 9.1. Market Analysis, Insights and Forecast - by Animal Type
- 9.1.1. Companion Animal
- 9.1.2. Production Animal
- 9.2. Market Analysis, Insights and Forecast - by Type of Care
- 9.2.1. Primary
- 9.2.2. Emergency
- 9.2.3. Critical
- 9.2.4. Specialty Services
- 9.2.5. Others S
- 9.1. Market Analysis, Insights and Forecast - by Animal Type
- 10. South America Veterinary Services Industry Analysis, Insights and Forecast, 2019-2031
- 10.1. Market Analysis, Insights and Forecast - by Animal Type
- 10.1.1. Companion Animal
- 10.1.2. Production Animal
- 10.2. Market Analysis, Insights and Forecast - by Type of Care
- 10.2.1. Primary
- 10.2.2. Emergency
- 10.2.3. Critical
- 10.2.4. Specialty Services
- 10.2.5. Others S
- 10.1. Market Analysis, Insights and Forecast - by Animal Type
- 11. North America Veterinary Services Industry Analysis, Insights and Forecast, 2019-2031
- 11.1. Market Analysis, Insights and Forecast - By Country/Sub-region
- 11.1.1 United States
- 11.1.2 Canada
- 11.1.3 Mexico
- 12. Europe Veterinary Services Industry Analysis, Insights and Forecast, 2019-2031
- 12.1. Market Analysis, Insights and Forecast - By Country/Sub-region
- 12.1.1 Germany
- 12.1.2 United Kingdom
- 12.1.3 France
- 12.1.4 Italy
- 12.1.5 Spain
- 12.1.6 Rest of Europe
- 13. Asia Pacific Veterinary Services Industry Analysis, Insights and Forecast, 2019-2031
- 13.1. Market Analysis, Insights and Forecast - By Country/Sub-region
- 13.1.1 China
- 13.1.2 Japan
- 13.1.3 India
- 13.1.4 Australia
- 13.1.5 South Korea
- 13.1.6 Rest of Asia Pacific
- 14. Middle East and Africa Veterinary Services Industry Analysis, Insights and Forecast, 2019-2031
- 14.1. Market Analysis, Insights and Forecast - By Country/Sub-region
- 14.1.1 GCC
- 14.1.2 South Africa
- 14.1.3 Rest of Middle East and Africa
- 15. South America Veterinary Services Industry Analysis, Insights and Forecast, 2019-2031
- 15.1. Market Analysis, Insights and Forecast - By Country/Sub-region
- 15.1.1 Brazil
- 15.1.2 Argentina
- 15.1.3 Rest of South America
- 16. Competitive Analysis
- 16.1. Global Market Share Analysis 2024
- 16.2. Company Profiles
- 16.2.1 Zoetis Services LLC
- 16.2.1.1. Overview
- 16.2.1.2. Products
- 16.2.1.3. SWOT Analysis
- 16.2.1.4. Recent Developments
- 16.2.1.5. Financials (Based on Availability)
- 16.2.2 Elanco
- 16.2.2.1. Overview
- 16.2.2.2. Products
- 16.2.2.3. SWOT Analysis
- 16.2.2.4. Recent Developments
- 16.2.2.5. Financials (Based on Availability)
- 16.2.3 Boehringer Ingelheim GmbH
- 16.2.3.1. Overview
- 16.2.3.2. Products
- 16.2.3.3. SWOT Analysis
- 16.2.3.4. Recent Developments
- 16.2.3.5. Financials (Based on Availability)
- 16.2.4 IDEXX Laboratories Inc
- 16.2.4.1. Overview
- 16.2.4.2. Products
- 16.2.4.3. SWOT Analysis
- 16.2.4.4. Recent Developments
- 16.2.4.5. Financials (Based on Availability)
- 16.2.5 Indian Immunologicals Ltd
- 16.2.5.1. Overview
- 16.2.5.2. Products
- 16.2.5.3. SWOT Analysis
- 16.2.5.4. Recent Developments
- 16.2.5.5. Financials (Based on Availability)
- 16.2.6 Vetoquinol S A
- 16.2.6.1. Overview
- 16.2.6.2. Products
- 16.2.6.3. SWOT Analysis
- 16.2.6.4. Recent Developments
- 16.2.6.5. Financials (Based on Availability)
- 16.2.7 Hester Bioscience
- 16.2.7.1. Overview
- 16.2.7.2. Products
- 16.2.7.3. SWOT Analysis
- 16.2.7.4. Recent Developments
- 16.2.7.5. Financials (Based on Availability)
- 16.2.8 Heska Corp
- 16.2.8.1. Overview
- 16.2.8.2. Products
- 16.2.8.3. SWOT Analysis
- 16.2.8.4. Recent Developments
- 16.2.8.5. Financials (Based on Availability)
- 16.2.9 Ceva Sant Animale
- 16.2.9.1. Overview
- 16.2.9.2. Products
- 16.2.9.3. SWOT Analysis
- 16.2.9.4. Recent Developments
- 16.2.9.5. Financials (Based on Availability)
- 16.2.10 Phibro Animal Health
- 16.2.10.1. Overview
- 16.2.10.2. Products
- 16.2.10.3. SWOT Analysis
- 16.2.10.4. Recent Developments
- 16.2.10.5. Financials (Based on Availability)
- 16.2.11 Virbac
- 16.2.11.1. Overview
- 16.2.11.2. Products
- 16.2.11.3. SWOT Analysis
- 16.2.11.4. Recent Developments
- 16.2.11.5. Financials (Based on Availability)
- 16.2.12 Merck Animal Health
- 16.2.12.1. Overview
- 16.2.12.2. Products
- 16.2.12.3. SWOT Analysis
- 16.2.12.4. Recent Developments
- 16.2.12.5. Financials (Based on Availability)
- 16.2.1 Zoetis Services LLC
List of Figures
- Figure 1: Global Veterinary Services Industry Revenue Breakdown (Million, %) by Region 2024 & 2032
- Figure 2: Global Veterinary Services Industry Volume Breakdown (K Unit, %) by Region 2024 & 2032
- Figure 3: North America Veterinary Services Industry Revenue (Million), by Country 2024 & 2032
- Figure 4: North America Veterinary Services Industry Volume (K Unit), by Country 2024 & 2032
- Figure 5: North America Veterinary Services Industry Revenue Share (%), by Country 2024 & 2032
- Figure 6: North America Veterinary Services Industry Volume Share (%), by Country 2024 & 2032
- Figure 7: Europe Veterinary Services Industry Revenue (Million), by Country 2024 & 2032
- Figure 8: Europe Veterinary Services Industry Volume (K Unit), by Country 2024 & 2032
- Figure 9: Europe Veterinary Services Industry Revenue Share (%), by Country 2024 & 2032
- Figure 10: Europe Veterinary Services Industry Volume Share (%), by Country 2024 & 2032
- Figure 11: Asia Pacific Veterinary Services Industry Revenue (Million), by Country 2024 & 2032
- Figure 12: Asia Pacific Veterinary Services Industry Volume (K Unit), by Country 2024 & 2032
- Figure 13: Asia Pacific Veterinary Services Industry Revenue Share (%), by Country 2024 & 2032
- Figure 14: Asia Pacific Veterinary Services Industry Volume Share (%), by Country 2024 & 2032
- Figure 15: Middle East and Africa Veterinary Services Industry Revenue (Million), by Country 2024 & 2032
- Figure 16: Middle East and Africa Veterinary Services Industry Volume (K Unit), by Country 2024 & 2032
- Figure 17: Middle East and Africa Veterinary Services Industry Revenue Share (%), by Country 2024 & 2032
- Figure 18: Middle East and Africa Veterinary Services Industry Volume Share (%), by Country 2024 & 2032
- Figure 19: South America Veterinary Services Industry Revenue (Million), by Country 2024 & 2032
- Figure 20: South America Veterinary Services Industry Volume (K Unit), by Country 2024 & 2032
- Figure 21: South America Veterinary Services Industry Revenue Share (%), by Country 2024 & 2032
- Figure 22: South America Veterinary Services Industry Volume Share (%), by Country 2024 & 2032
- Figure 23: North America Veterinary Services Industry Revenue (Million), by Animal Type 2024 & 2032
- Figure 24: North America Veterinary Services Industry Volume (K Unit), by Animal Type 2024 & 2032
- Figure 25: North America Veterinary Services Industry Revenue Share (%), by Animal Type 2024 & 2032
- Figure 26: North America Veterinary Services Industry Volume Share (%), by Animal Type 2024 & 2032
- Figure 27: North America Veterinary Services Industry Revenue (Million), by Type of Care 2024 & 2032
- Figure 28: North America Veterinary Services Industry Volume (K Unit), by Type of Care 2024 & 2032
- Figure 29: North America Veterinary Services Industry Revenue Share (%), by Type of Care 2024 & 2032
- Figure 30: North America Veterinary Services Industry Volume Share (%), by Type of Care 2024 & 2032
- Figure 31: North America Veterinary Services Industry Revenue (Million), by Country 2024 & 2032
- Figure 32: North America Veterinary Services Industry Volume (K Unit), by Country 2024 & 2032
- Figure 33: North America Veterinary Services Industry Revenue Share (%), by Country 2024 & 2032
- Figure 34: North America Veterinary Services Industry Volume Share (%), by Country 2024 & 2032
- Figure 35: Europe Veterinary Services Industry Revenue (Million), by Animal Type 2024 & 2032
- Figure 36: Europe Veterinary Services Industry Volume (K Unit), by Animal Type 2024 & 2032
- Figure 37: Europe Veterinary Services Industry Revenue Share (%), by Animal Type 2024 & 2032
- Figure 38: Europe Veterinary Services Industry Volume Share (%), by Animal Type 2024 & 2032
- Figure 39: Europe Veterinary Services Industry Revenue (Million), by Type of Care 2024 & 2032
- Figure 40: Europe Veterinary Services Industry Volume (K Unit), by Type of Care 2024 & 2032
- Figure 41: Europe Veterinary Services Industry Revenue Share (%), by Type of Care 2024 & 2032
- Figure 42: Europe Veterinary Services Industry Volume Share (%), by Type of Care 2024 & 2032
- Figure 43: Europe Veterinary Services Industry Revenue (Million), by Country 2024 & 2032
- Figure 44: Europe Veterinary Services Industry Volume (K Unit), by Country 2024 & 2032
- Figure 45: Europe Veterinary Services Industry Revenue Share (%), by Country 2024 & 2032
- Figure 46: Europe Veterinary Services Industry Volume Share (%), by Country 2024 & 2032
- Figure 47: Asia Pacific Veterinary Services Industry Revenue (Million), by Animal Type 2024 & 2032
- Figure 48: Asia Pacific Veterinary Services Industry Volume (K Unit), by Animal Type 2024 & 2032
- Figure 49: Asia Pacific Veterinary Services Industry Revenue Share (%), by Animal Type 2024 & 2032
- Figure 50: Asia Pacific Veterinary Services Industry Volume Share (%), by Animal Type 2024 & 2032
- Figure 51: Asia Pacific Veterinary Services Industry Revenue (Million), by Type of Care 2024 & 2032
- Figure 52: Asia Pacific Veterinary Services Industry Volume (K Unit), by Type of Care 2024 & 2032
- Figure 53: Asia Pacific Veterinary Services Industry Revenue Share (%), by Type of Care 2024 & 2032
- Figure 54: Asia Pacific Veterinary Services Industry Volume Share (%), by Type of Care 2024 & 2032
- Figure 55: Asia Pacific Veterinary Services Industry Revenue (Million), by Country 2024 & 2032
- Figure 56: Asia Pacific Veterinary Services Industry Volume (K Unit), by Country 2024 & 2032
- Figure 57: Asia Pacific Veterinary Services Industry Revenue Share (%), by Country 2024 & 2032
- Figure 58: Asia Pacific Veterinary Services Industry Volume Share (%), by Country 2024 & 2032
- Figure 59: Middle East and Africa Veterinary Services Industry Revenue (Million), by Animal Type 2024 & 2032
- Figure 60: Middle East and Africa Veterinary Services Industry Volume (K Unit), by Animal Type 2024 & 2032
- Figure 61: Middle East and Africa Veterinary Services Industry Revenue Share (%), by Animal Type 2024 & 2032
- Figure 62: Middle East and Africa Veterinary Services Industry Volume Share (%), by Animal Type 2024 & 2032
- Figure 63: Middle East and Africa Veterinary Services Industry Revenue (Million), by Type of Care 2024 & 2032
- Figure 64: Middle East and Africa Veterinary Services Industry Volume (K Unit), by Type of Care 2024 & 2032
- Figure 65: Middle East and Africa Veterinary Services Industry Revenue Share (%), by Type of Care 2024 & 2032
- Figure 66: Middle East and Africa Veterinary Services Industry Volume Share (%), by Type of Care 2024 & 2032
- Figure 67: Middle East and Africa Veterinary Services Industry Revenue (Million), by Country 2024 & 2032
- Figure 68: Middle East and Africa Veterinary Services Industry Volume (K Unit), by Country 2024 & 2032
- Figure 69: Middle East and Africa Veterinary Services Industry Revenue Share (%), by Country 2024 & 2032
- Figure 70: Middle East and Africa Veterinary Services Industry Volume Share (%), by Country 2024 & 2032
- Figure 71: South America Veterinary Services Industry Revenue (Million), by Animal Type 2024 & 2032
- Figure 72: South America Veterinary Services Industry Volume (K Unit), by Animal Type 2024 & 2032
- Figure 73: South America Veterinary Services Industry Revenue Share (%), by Animal Type 2024 & 2032
- Figure 74: South America Veterinary Services Industry Volume Share (%), by Animal Type 2024 & 2032
- Figure 75: South America Veterinary Services Industry Revenue (Million), by Type of Care 2024 & 2032
- Figure 76: South America Veterinary Services Industry Volume (K Unit), by Type of Care 2024 & 2032
- Figure 77: South America Veterinary Services Industry Revenue Share (%), by Type of Care 2024 & 2032
- Figure 78: South America Veterinary Services Industry Volume Share (%), by Type of Care 2024 & 2032
- Figure 79: South America Veterinary Services Industry Revenue (Million), by Country 2024 & 2032
- Figure 80: South America Veterinary Services Industry Volume (K Unit), by Country 2024 & 2032
- Figure 81: South America Veterinary Services Industry Revenue Share (%), by Country 2024 & 2032
- Figure 82: South America Veterinary Services Industry Volume Share (%), by Country 2024 & 2032
List of Tables
- Table 1: Global Veterinary Services Industry Revenue Million Forecast, by Region 2019 & 2032
- Table 2: Global Veterinary Services Industry Volume K Unit Forecast, by Region 2019 & 2032
- Table 3: Global Veterinary Services Industry Revenue Million Forecast, by Animal Type 2019 & 2032
- Table 4: Global Veterinary Services Industry Volume K Unit Forecast, by Animal Type 2019 & 2032
- Table 5: Global Veterinary Services Industry Revenue Million Forecast, by Type of Care 2019 & 2032
- Table 6: Global Veterinary Services Industry Volume K Unit Forecast, by Type of Care 2019 & 2032
- Table 7: Global Veterinary Services Industry Revenue Million Forecast, by Region 2019 & 2032
- Table 8: Global Veterinary Services Industry Volume K Unit Forecast, by Region 2019 & 2032
- Table 9: Global Veterinary Services Industry Revenue Million Forecast, by Country 2019 & 2032
- Table 10: Global Veterinary Services Industry Volume K Unit Forecast, by Country 2019 & 2032
- Table 11: United States Veterinary Services Industry Revenue (Million) Forecast, by Application 2019 & 2032
- Table 12: United States Veterinary Services Industry Volume (K Unit) Forecast, by Application 2019 & 2032
- Table 13: Canada Veterinary Services Industry Revenue (Million) Forecast, by Application 2019 & 2032
- Table 14: Canada Veterinary Services Industry Volume (K Unit) Forecast, by Application 2019 & 2032
- Table 15: Mexico Veterinary Services Industry Revenue (Million) Forecast, by Application 2019 & 2032
- Table 16: Mexico Veterinary Services Industry Volume (K Unit) Forecast, by Application 2019 & 2032
- Table 17: Global Veterinary Services Industry Revenue Million Forecast, by Country 2019 & 2032
- Table 18: Global Veterinary Services Industry Volume K Unit Forecast, by Country 2019 & 2032
- Table 19: Germany Veterinary Services Industry Revenue (Million) Forecast, by Application 2019 & 2032
- Table 20: Germany Veterinary Services Industry Volume (K Unit) Forecast, by Application 2019 & 2032
- Table 21: United Kingdom Veterinary Services Industry Revenue (Million) Forecast, by Application 2019 & 2032
- Table 22: United Kingdom Veterinary Services Industry Volume (K Unit) Forecast, by Application 2019 & 2032
- Table 23: France Veterinary Services Industry Revenue (Million) Forecast, by Application 2019 & 2032
- Table 24: France Veterinary Services Industry Volume (K Unit) Forecast, by Application 2019 & 2032
- Table 25: Italy Veterinary Services Industry Revenue (Million) Forecast, by Application 2019 & 2032
- Table 26: Italy Veterinary Services Industry Volume (K Unit) Forecast, by Application 2019 & 2032
- Table 27: Spain Veterinary Services Industry Revenue (Million) Forecast, by Application 2019 & 2032
- Table 28: Spain Veterinary Services Industry Volume (K Unit) Forecast, by Application 2019 & 2032
- Table 29: Rest of Europe Veterinary Services Industry Revenue (Million) Forecast, by Application 2019 & 2032
- Table 30: Rest of Europe Veterinary Services Industry Volume (K Unit) Forecast, by Application 2019 & 2032
- Table 31: Global Veterinary Services Industry Revenue Million Forecast, by Country 2019 & 2032
- Table 32: Global Veterinary Services Industry Volume K Unit Forecast, by Country 2019 & 2032
- Table 33: China Veterinary Services Industry Revenue (Million) Forecast, by Application 2019 & 2032
- Table 34: China Veterinary Services Industry Volume (K Unit) Forecast, by Application 2019 & 2032
- Table 35: Japan Veterinary Services Industry Revenue (Million) Forecast, by Application 2019 & 2032
- Table 36: Japan Veterinary Services Industry Volume (K Unit) Forecast, by Application 2019 & 2032
- Table 37: India Veterinary Services Industry Revenue (Million) Forecast, by Application 2019 & 2032
- Table 38: India Veterinary Services Industry Volume (K Unit) Forecast, by Application 2019 & 2032
- Table 39: Australia Veterinary Services Industry Revenue (Million) Forecast, by Application 2019 & 2032
- Table 40: Australia Veterinary Services Industry Volume (K Unit) Forecast, by Application 2019 & 2032
- Table 41: South Korea Veterinary Services Industry Revenue (Million) Forecast, by Application 2019 & 2032
- Table 42: South Korea Veterinary Services Industry Volume (K Unit) Forecast, by Application 2019 & 2032
- Table 43: Rest of Asia Pacific Veterinary Services Industry Revenue (Million) Forecast, by Application 2019 & 2032
- Table 44: Rest of Asia Pacific Veterinary Services Industry Volume (K Unit) Forecast, by Application 2019 & 2032
- Table 45: Global Veterinary Services Industry Revenue Million Forecast, by Country 2019 & 2032
- Table 46: Global Veterinary Services Industry Volume K Unit Forecast, by Country 2019 & 2032
- Table 47: GCC Veterinary Services Industry Revenue (Million) Forecast, by Application 2019 & 2032
- Table 48: GCC Veterinary Services Industry Volume (K Unit) Forecast, by Application 2019 & 2032
- Table 49: South Africa Veterinary Services Industry Revenue (Million) Forecast, by Application 2019 & 2032
- Table 50: South Africa Veterinary Services Industry Volume (K Unit) Forecast, by Application 2019 & 2032
- Table 51: Rest of Middle East and Africa Veterinary Services Industry Revenue (Million) Forecast, by Application 2019 & 2032
- Table 52: Rest of Middle East and Africa Veterinary Services Industry Volume (K Unit) Forecast, by Application 2019 & 2032
- Table 53: Global Veterinary Services Industry Revenue Million Forecast, by Country 2019 & 2032
- Table 54: Global Veterinary Services Industry Volume K Unit Forecast, by Country 2019 & 2032
- Table 55: Brazil Veterinary Services Industry Revenue (Million) Forecast, by Application 2019 & 2032
- Table 56: Brazil Veterinary Services Industry Volume (K Unit) Forecast, by Application 2019 & 2032
- Table 57: Argentina Veterinary Services Industry Revenue (Million) Forecast, by Application 2019 & 2032
- Table 58: Argentina Veterinary Services Industry Volume (K Unit) Forecast, by Application 2019 & 2032
- Table 59: Rest of South America Veterinary Services Industry Revenue (Million) Forecast, by Application 2019 & 2032
- Table 60: Rest of South America Veterinary Services Industry Volume (K Unit) Forecast, by Application 2019 & 2032
- Table 61: Global Veterinary Services Industry Revenue Million Forecast, by Animal Type 2019 & 2032
- Table 62: Global Veterinary Services Industry Volume K Unit Forecast, by Animal Type 2019 & 2032
- Table 63: Global Veterinary Services Industry Revenue Million Forecast, by Type of Care 2019 & 2032
- Table 64: Global Veterinary Services Industry Volume K Unit Forecast, by Type of Care 2019 & 2032
- Table 65: Global Veterinary Services Industry Revenue Million Forecast, by Country 2019 & 2032
- Table 66: Global Veterinary Services Industry Volume K Unit Forecast, by Country 2019 & 2032
- Table 67: United States Veterinary Services Industry Revenue (Million) Forecast, by Application 2019 & 2032
- Table 68: United States Veterinary Services Industry Volume (K Unit) Forecast, by Application 2019 & 2032
- Table 69: Canada Veterinary Services Industry Revenue (Million) Forecast, by Application 2019 & 2032
- Table 70: Canada Veterinary Services Industry Volume (K Unit) Forecast, by Application 2019 & 2032
- Table 71: Mexico Veterinary Services Industry Revenue (Million) Forecast, by Application 2019 & 2032
- Table 72: Mexico Veterinary Services Industry Volume (K Unit) Forecast, by Application 2019 & 2032
- Table 73: Global Veterinary Services Industry Revenue Million Forecast, by Animal Type 2019 & 2032
- Table 74: Global Veterinary Services Industry Volume K Unit Forecast, by Animal Type 2019 & 2032
- Table 75: Global Veterinary Services Industry Revenue Million Forecast, by Type of Care 2019 & 2032
- Table 76: Global Veterinary Services Industry Volume K Unit Forecast, by Type of Care 2019 & 2032
- Table 77: Global Veterinary Services Industry Revenue Million Forecast, by Country 2019 & 2032
- Table 78: Global Veterinary Services Industry Volume K Unit Forecast, by Country 2019 & 2032
- Table 79: Germany Veterinary Services Industry Revenue (Million) Forecast, by Application 2019 & 2032
- Table 80: Germany Veterinary Services Industry Volume (K Unit) Forecast, by Application 2019 & 2032
- Table 81: United Kingdom Veterinary Services Industry Revenue (Million) Forecast, by Application 2019 & 2032
- Table 82: United Kingdom Veterinary Services Industry Volume (K Unit) Forecast, by Application 2019 & 2032
- Table 83: France Veterinary Services Industry Revenue (Million) Forecast, by Application 2019 & 2032
- Table 84: France Veterinary Services Industry Volume (K Unit) Forecast, by Application 2019 & 2032
- Table 85: Italy Veterinary Services Industry Revenue (Million) Forecast, by Application 2019 & 2032
- Table 86: Italy Veterinary Services Industry Volume (K Unit) Forecast, by Application 2019 & 2032
- Table 87: Spain Veterinary Services Industry Revenue (Million) Forecast, by Application 2019 & 2032
- Table 88: Spain Veterinary Services Industry Volume (K Unit) Forecast, by Application 2019 & 2032
- Table 89: Rest of Europe Veterinary Services Industry Revenue (Million) Forecast, by Application 2019 & 2032
- Table 90: Rest of Europe Veterinary Services Industry Volume (K Unit) Forecast, by Application 2019 & 2032
- Table 91: Global Veterinary Services Industry Revenue Million Forecast, by Animal Type 2019 & 2032
- Table 92: Global Veterinary Services Industry Volume K Unit Forecast, by Animal Type 2019 & 2032
- Table 93: Global Veterinary Services Industry Revenue Million Forecast, by Type of Care 2019 & 2032
- Table 94: Global Veterinary Services Industry Volume K Unit Forecast, by Type of Care 2019 & 2032
- Table 95: Global Veterinary Services Industry Revenue Million Forecast, by Country 2019 & 2032
- Table 96: Global Veterinary Services Industry Volume K Unit Forecast, by Country 2019 & 2032
- Table 97: China Veterinary Services Industry Revenue (Million) Forecast, by Application 2019 & 2032
- Table 98: China Veterinary Services Industry Volume (K Unit) Forecast, by Application 2019 & 2032
- Table 99: Japan Veterinary Services Industry Revenue (Million) Forecast, by Application 2019 & 2032
- Table 100: Japan Veterinary Services Industry Volume (K Unit) Forecast, by Application 2019 & 2032
- Table 101: India Veterinary Services Industry Revenue (Million) Forecast, by Application 2019 & 2032
- Table 102: India Veterinary Services Industry Volume (K Unit) Forecast, by Application 2019 & 2032
- Table 103: Australia Veterinary Services Industry Revenue (Million) Forecast, by Application 2019 & 2032
- Table 104: Australia Veterinary Services Industry Volume (K Unit) Forecast, by Application 2019 & 2032
- Table 105: South Korea Veterinary Services Industry Revenue (Million) Forecast, by Application 2019 & 2032
- Table 106: South Korea Veterinary Services Industry Volume (K Unit) Forecast, by Application 2019 & 2032
- Table 107: Rest of Asia Pacific Veterinary Services Industry Revenue (Million) Forecast, by Application 2019 & 2032
- Table 108: Rest of Asia Pacific Veterinary Services Industry Volume (K Unit) Forecast, by Application 2019 & 2032
- Table 109: Global Veterinary Services Industry Revenue Million Forecast, by Animal Type 2019 & 2032
- Table 110: Global Veterinary Services Industry Volume K Unit Forecast, by Animal Type 2019 & 2032
- Table 111: Global Veterinary Services Industry Revenue Million Forecast, by Type of Care 2019 & 2032
- Table 112: Global Veterinary Services Industry Volume K Unit Forecast, by Type of Care 2019 & 2032
- Table 113: Global Veterinary Services Industry Revenue Million Forecast, by Country 2019 & 2032
- Table 114: Global Veterinary Services Industry Volume K Unit Forecast, by Country 2019 & 2032
- Table 115: GCC Veterinary Services Industry Revenue (Million) Forecast, by Application 2019 & 2032
- Table 116: GCC Veterinary Services Industry Volume (K Unit) Forecast, by Application 2019 & 2032
- Table 117: South Africa Veterinary Services Industry Revenue (Million) Forecast, by Application 2019 & 2032
- Table 118: South Africa Veterinary Services Industry Volume (K Unit) Forecast, by Application 2019 & 2032
- Table 119: Rest of Middle East and Africa Veterinary Services Industry Revenue (Million) Forecast, by Application 2019 & 2032
- Table 120: Rest of Middle East and Africa Veterinary Services Industry Volume (K Unit) Forecast, by Application 2019 & 2032
- Table 121: Global Veterinary Services Industry Revenue Million Forecast, by Animal Type 2019 & 2032
- Table 122: Global Veterinary Services Industry Volume K Unit Forecast, by Animal Type 2019 & 2032
- Table 123: Global Veterinary Services Industry Revenue Million Forecast, by Type of Care 2019 & 2032
- Table 124: Global Veterinary Services Industry Volume K Unit Forecast, by Type of Care 2019 & 2032
- Table 125: Global Veterinary Services Industry Revenue Million Forecast, by Country 2019 & 2032
- Table 126: Global Veterinary Services Industry Volume K Unit Forecast, by Country 2019 & 2032
- Table 127: Brazil Veterinary Services Industry Revenue (Million) Forecast, by Application 2019 & 2032
- Table 128: Brazil Veterinary Services Industry Volume (K Unit) Forecast, by Application 2019 & 2032
- Table 129: Argentina Veterinary Services Industry Revenue (Million) Forecast, by Application 2019 & 2032
- Table 130: Argentina Veterinary Services Industry Volume (K Unit) Forecast, by Application 2019 & 2032
- Table 131: Rest of South America Veterinary Services Industry Revenue (Million) Forecast, by Application 2019 & 2032
- Table 132: Rest of South America Veterinary Services Industry Volume (K Unit) Forecast, by Application 2019 & 2032
Frequently Asked Questions
1. What is the projected Compound Annual Growth Rate (CAGR) of the Veterinary Services Industry?
The projected CAGR is approximately 5.59%.
2. Which companies are prominent players in the Veterinary Services Industry?
Key companies in the market include Zoetis Services LLC, Elanco, Boehringer Ingelheim GmbH, IDEXX Laboratories Inc, Indian Immunologicals Ltd, Vetoquinol S A, Hester Bioscience, Heska Corp, Ceva Sant Animale, Phibro Animal Health, Virbac, Merck Animal Health.
3. What are the main segments of the Veterinary Services Industry?
The market segments include Animal Type, Type of Care.
4. Can you provide details about the market size?
The market size is estimated to be USD 88.22 Million as of 2022.
5. What are some drivers contributing to market growth?
Rising Chronic Diseases and Awareness Regarding Veterinary Care; Increasing Initiatives by Governments and Animal Welfare Associations in Different Countries.
6. What are the notable trends driving market growth?
Companion Animal Segment is Expected to Hold Significant Market Share in the Market Over the Forecast Period.
7. Are there any restraints impacting market growth?
Increasing Costs of Animal Care Product and Veterinary Services.
8. Can you provide examples of recent developments in the market?
April 2022: Animalcare launched Plaqtiv+, a range of dental care products for cats and dogs designed to reduce calculus formation.
9. What pricing options are available for accessing the report?
Pricing options include single-user, multi-user, and enterprise licenses priced at USD 4750, USD 5250, and USD 8750 respectively.
10. Is the market size provided in terms of value or volume?
The market size is provided in terms of value, measured in Million and volume, measured in K Unit.
11. Are there any specific market keywords associated with the report?
Yes, the market keyword associated with the report is "Veterinary Services Industry," which aids in identifying and referencing the specific market segment covered.
12. How do I determine which pricing option suits my needs best?
The pricing options vary based on user requirements and access needs. Individual users may opt for single-user licenses, while businesses requiring broader access may choose multi-user or enterprise licenses for cost-effective access to the report.
13. Are there any additional resources or data provided in the Veterinary Services Industry report?
While the report offers comprehensive insights, it's advisable to review the specific contents or supplementary materials provided to ascertain if additional resources or data are available.
14. How can I stay updated on further developments or reports in the Veterinary Services Industry?
To stay informed about further developments, trends, and reports in the Veterinary Services Industry, consider subscribing to industry newsletters, following relevant companies and organizations, or regularly checking reputable industry news sources and publications.
Methodology
Step 1 - Identification of Relevant Samples Size from Population Database


Step 2 - Approaches for Defining Global Market Size (Value, Volume* & Price*)

Note*: In applicable scenarios
Step 3 - Data Sources
Primary Research
- Web Analytics
- Survey Reports
- Research Institute
- Latest Research Reports
- Opinion Leaders
Secondary Research
- Annual Reports
- White Paper
- Latest Press Release
- Industry Association
- Paid Database
- Investor Presentations

Step 4 - Data Triangulation
Involves using different sources of information in order to increase the validity of a study
These sources are likely to be stakeholders in a program - participants, other researchers, program staff, other community members, and so on.
Then we put all data in single framework & apply various statistical tools to find out the dynamic on the market.
During the analysis stage, feedback from the stakeholder groups would be compared to determine areas of agreement as well as areas of divergence
