

Key Insights
The global wireless IP phone market is experiencing robust growth, driven by the increasing adoption of VoIP technology and the rising demand for flexible and mobile communication solutions across various sectors. The market's expansion is fueled by several key factors, including the decreasing cost of wireless IP phones, improved network infrastructure, and the enhanced features offered by these devices compared to traditional wired phones. Businesses are increasingly adopting wireless IP phones to improve employee mobility, enhance collaboration, and reduce communication costs. The integration of advanced features like HD audio, video conferencing capabilities, and seamless integration with other communication platforms further boosts market appeal. Key players like Snom, Grandstream, Yealink, and Cisco are driving innovation through the development of feature-rich devices and strategic partnerships, fostering competition and driving down prices. The market is segmented by features (e.g., DECT, Wi-Fi), deployment (e.g., office, home), and end-user (e.g., enterprises, SMEs). Geographic growth varies, with regions like North America and Europe leading the market due to higher adoption rates of advanced communication technologies and a robust infrastructure.
While the market shows strong growth potential, challenges remain. Security concerns associated with wireless communication and the need for robust network infrastructure in certain regions pose constraints. Furthermore, the high initial investment cost for implementation can be a deterrent for smaller businesses. However, ongoing technological advancements addressing security concerns and the development of cost-effective solutions are mitigating these limitations. The forecast period (2025-2033) is expected to witness a sustained growth trajectory, driven by the aforementioned factors and the increasing adoption of hybrid work models that necessitate flexible communication solutions. Competition among vendors is expected to intensify, leading to product innovation and further price reductions, making wireless IP phones accessible to a wider range of users.
Wireless IP Phone Market Report: 2019-2033
This comprehensive report delivers an in-depth analysis of the wireless IP phone market, encompassing market dynamics, growth trends, regional analysis, product landscape, key players, and future outlook. The study period covers 2019-2033, with a base year of 2025 and a forecast period of 2025-2033. This report is crucial for industry professionals, investors, and businesses seeking to understand and capitalize on opportunities within this dynamic market segment of the broader Unified Communications (UC) and VoIP phone systems market. The report projects the global market to reach xx million units by 2033.
Wireless IP Phone Market Dynamics & Structure
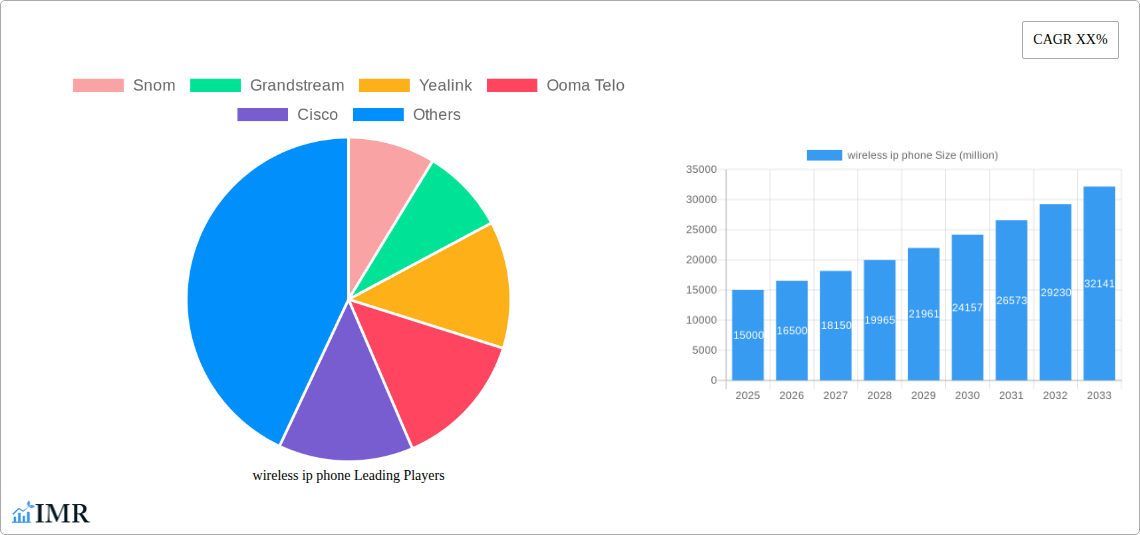
The wireless IP phone market exhibits a moderately concentrated structure, with key players like Cisco, Yealink, Grandstream, and Panasonic holding significant market share. Technological innovation, particularly in DECT (Digital Enhanced Cordless Telecommunications) technology and integration with cloud-based communication platforms, is a major driver. Regulatory frameworks concerning data privacy and security compliance significantly influence market dynamics. Competitive substitutes include traditional landline phones and mobile devices, though the convergence of features and cost-effectiveness of wireless IP phones remains a strong advantage. End-user demographics are diverse, ranging from small businesses to large enterprises and government agencies, with demand driven by the need for mobility, flexibility, and enhanced communication efficiency. M&A activity in the sector has been moderate in recent years, with a predicted xx deals annually, focused primarily on consolidating smaller players or acquiring specialized technology.
- Market Concentration: Moderately concentrated, with top 5 players holding approximately 60% market share in 2025.
- Technological Innovation: Focus on DECT 6.0, Wi-Fi 6, and seamless integration with VoIP platforms.
- Regulatory Frameworks: Compliance with data privacy regulations (GDPR, CCPA) impacts product design and deployment.
- Competitive Substitutes: Mobile phones, traditional landlines, and softphones pose competition.
- End-User Demographics: Small and medium businesses (SMBs), large enterprises, and government agencies.
- M&A Activity: xx deals annually predicted, primarily driven by consolidation and technology acquisition.
Wireless IP Phone Growth Trends & Insights
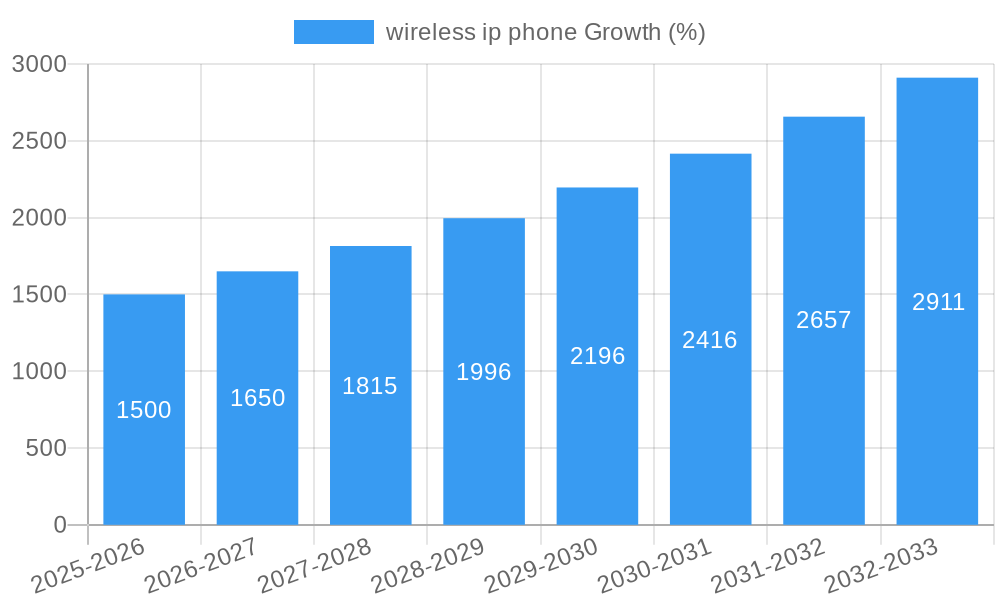
The global wireless IP phone market experienced significant growth during the historical period (2019-2024), driven by the increasing adoption of VoIP technology and the demand for mobility within the workplace. The market size has expanded steadily, with a Compound Annual Growth Rate (CAGR) of xx% during this period, reaching xx million units in 2024. The adoption rate is particularly high in developed economies, reflecting a shift towards flexible work arrangements and enhanced communication capabilities. Technological disruptions, such as the introduction of advanced DECT and Wi-Fi standards, are further accelerating market growth. Consumer behavior shifts towards cloud-based communication solutions and a preference for integrated communication platforms are also contributing factors. We project the market to reach xx million units in 2025, with a projected CAGR of xx% from 2025 to 2033. The market penetration is expected to increase to xx% globally by 2033, driven primarily by adoption in emerging markets.
Dominant Regions, Countries, or Segments in Wireless IP Phone
North America currently dominates the wireless IP phone market, driven by strong demand from large enterprises and early adoption of advanced communication technologies. The region’s robust infrastructure and advanced technological ecosystem contribute significantly to this dominance. Europe follows closely, with significant growth potential in Southern and Eastern European countries. Asia-Pacific is witnessing rapid expansion, particularly in countries like China and India, fuelled by a burgeoning SMB sector and increasing digitalization.
- North America: Strong demand from large enterprises, robust infrastructure, early technology adoption.
- Europe: Significant growth potential in Southern and Eastern European countries.
- Asia-Pacific: Rapid expansion in China and India, driven by SMB growth and digitalization.
- Key Drivers: Government initiatives supporting digital infrastructure, increasing internet penetration, and rising disposable incomes.
Wireless IP Phone Product Landscape
Wireless IP phones are evolving rapidly, incorporating features such as high-definition audio, advanced call management capabilities, enhanced security protocols, and seamless integration with various communication platforms (CRM, ERP). Many models offer unique selling propositions like improved battery life, extended range, and robust encryption. Technological advancements focus on improved audio quality, enhanced security, and better integration with cloud-based services. The market offers a variety of products catering to different needs and price points, from basic models to sophisticated devices with advanced features.
Key Drivers, Barriers & Challenges in Wireless IP Phone
Key Drivers:
- Increasing demand for mobility and flexibility in communication.
- Growing adoption of VoIP and cloud-based communication solutions.
- Technological advancements in DECT and Wi-Fi standards.
- Government initiatives supporting digital infrastructure in many regions.
Key Challenges:
- Competition from mobile phones and other communication devices.
- Concerns about data security and privacy.
- High initial investment costs for some businesses.
- Supply chain disruptions impacting manufacturing and distribution. These disruptions reduced production by an estimated xx% in 2022, impacting overall market growth.
Emerging Opportunities in Wireless IP Phone
- Growing demand for wireless IP phones in healthcare and education sectors.
- Integration with IoT devices for enhanced workplace communication.
- Development of specialized wireless IP phones for specific industry applications.
- Expansion into untapped markets in developing economies.
Growth Accelerators in the Wireless IP Phone Industry
Technological breakthroughs in battery technology, DECT and Wi-Fi standards, and improved security protocols are key growth accelerators. Strategic partnerships between manufacturers and communication service providers are enhancing market penetration. Expansion into new markets, particularly in developing economies with growing internet penetration, offers substantial growth opportunities.
Key Players Shaping the Wireless IP Phone Market
Notable Milestones in Wireless IP Phone Sector
- 2020: Yealink launches its first 5G-enabled wireless IP phone.
- 2021: Grandstream introduces a new series of DECT 6.0-compliant wireless IP phones with enhanced security features.
- 2022: Cisco acquires a smaller wireless IP phone manufacturer, expanding its product portfolio.
- 2023: Industry-wide adoption of enhanced security protocols in response to increasing cyber threats.
In-Depth Wireless IP Phone Market Outlook
The wireless IP phone market is poised for continued growth, driven by several factors including technological advancements, increasing demand from various sectors, and expansion into new markets. The convergence of communication technologies, such as VoIP and cloud-based solutions, presents considerable opportunities for manufacturers to develop innovative products and services. Strategic partnerships and focused marketing efforts will play a crucial role in shaping the future of this market. The focus on improved security, seamless integration, and enhanced user experience will continue to drive demand and shape the industry’s evolution.
wireless ip phone Segmentation
-
1. Application
- 1.1. Retail
- 1.2. Logistics
- 1.3. Medical
- 1.4. Security
- 1.5. Hospitality
- 1.6. Manufacturing
- 1.7. Other
-
2. Types
- 2.1. 4 SIP Accounts
- 2.2. 6 SIP Accounts
- 2.3. 8 SIP Accounts
- 2.4. 10 SIP Accounts
wireless ip phone Segmentation By Geography
-
1. North America
- 1.1. United States
- 1.2. Canada
- 1.3. Mexico
-
2. South America
- 2.1. Brazil
- 2.2. Argentina
- 2.3. Rest of South America
-
3. Europe
- 3.1. United Kingdom
- 3.2. Germany
- 3.3. France
- 3.4. Italy
- 3.5. Spain
- 3.6. Russia
- 3.7. Benelux
- 3.8. Nordics
- 3.9. Rest of Europe
-
4. Middle East & Africa
- 4.1. Turkey
- 4.2. Israel
- 4.3. GCC
- 4.4. North Africa
- 4.5. South Africa
- 4.6. Rest of Middle East & Africa
-
5. Asia Pacific
- 5.1. China
- 5.2. India
- 5.3. Japan
- 5.4. South Korea
- 5.5. ASEAN
- 5.6. Oceania
- 5.7. Rest of Asia Pacific

wireless ip phone REPORT HIGHLIGHTS
| Aspects | Details |
|---|---|
| Study Period | 2019-2033 |
| Base Year | 2024 |
| Estimated Year | 2025 |
| Forecast Period | 2025-2033 |
| Historical Period | 2019-2024 |
| Growth Rate | CAGR of XX% from 2019-2033 |
| Segmentation |
|
Table of Contents
- 1. Introduction
- 1.1. Research Scope
- 1.2. Market Segmentation
- 1.3. Research Methodology
- 1.4. Definitions and Assumptions
- 2. Executive Summary
- 2.1. Introduction
- 3. Market Dynamics
- 3.1. Introduction
- 3.2. Market Drivers
- 3.3. Market Restrains
- 3.4. Market Trends
- 4. Market Factor Analysis
- 4.1. Porters Five Forces
- 4.2. Supply/Value Chain
- 4.3. PESTEL analysis
- 4.4. Market Entropy
- 4.5. Patent/Trademark Analysis
- 5. Global wireless ip phone Analysis, Insights and Forecast, 2019-2031
- 5.1. Market Analysis, Insights and Forecast - by Application
- 5.1.1. Retail
- 5.1.2. Logistics
- 5.1.3. Medical
- 5.1.4. Security
- 5.1.5. Hospitality
- 5.1.6. Manufacturing
- 5.1.7. Other
- 5.2. Market Analysis, Insights and Forecast - by Types
- 5.2.1. 4 SIP Accounts
- 5.2.2. 6 SIP Accounts
- 5.2.3. 8 SIP Accounts
- 5.2.4. 10 SIP Accounts
- 5.3. Market Analysis, Insights and Forecast - by Region
- 5.3.1. North America
- 5.3.2. South America
- 5.3.3. Europe
- 5.3.4. Middle East & Africa
- 5.3.5. Asia Pacific
- 5.1. Market Analysis, Insights and Forecast - by Application
- 6. North America wireless ip phone Analysis, Insights and Forecast, 2019-2031
- 6.1. Market Analysis, Insights and Forecast - by Application
- 6.1.1. Retail
- 6.1.2. Logistics
- 6.1.3. Medical
- 6.1.4. Security
- 6.1.5. Hospitality
- 6.1.6. Manufacturing
- 6.1.7. Other
- 6.2. Market Analysis, Insights and Forecast - by Types
- 6.2.1. 4 SIP Accounts
- 6.2.2. 6 SIP Accounts
- 6.2.3. 8 SIP Accounts
- 6.2.4. 10 SIP Accounts
- 6.1. Market Analysis, Insights and Forecast - by Application
- 7. South America wireless ip phone Analysis, Insights and Forecast, 2019-2031
- 7.1. Market Analysis, Insights and Forecast - by Application
- 7.1.1. Retail
- 7.1.2. Logistics
- 7.1.3. Medical
- 7.1.4. Security
- 7.1.5. Hospitality
- 7.1.6. Manufacturing
- 7.1.7. Other
- 7.2. Market Analysis, Insights and Forecast - by Types
- 7.2.1. 4 SIP Accounts
- 7.2.2. 6 SIP Accounts
- 7.2.3. 8 SIP Accounts
- 7.2.4. 10 SIP Accounts
- 7.1. Market Analysis, Insights and Forecast - by Application
- 8. Europe wireless ip phone Analysis, Insights and Forecast, 2019-2031
- 8.1. Market Analysis, Insights and Forecast - by Application
- 8.1.1. Retail
- 8.1.2. Logistics
- 8.1.3. Medical
- 8.1.4. Security
- 8.1.5. Hospitality
- 8.1.6. Manufacturing
- 8.1.7. Other
- 8.2. Market Analysis, Insights and Forecast - by Types
- 8.2.1. 4 SIP Accounts
- 8.2.2. 6 SIP Accounts
- 8.2.3. 8 SIP Accounts
- 8.2.4. 10 SIP Accounts
- 8.1. Market Analysis, Insights and Forecast - by Application
- 9. Middle East & Africa wireless ip phone Analysis, Insights and Forecast, 2019-2031
- 9.1. Market Analysis, Insights and Forecast - by Application
- 9.1.1. Retail
- 9.1.2. Logistics
- 9.1.3. Medical
- 9.1.4. Security
- 9.1.5. Hospitality
- 9.1.6. Manufacturing
- 9.1.7. Other
- 9.2. Market Analysis, Insights and Forecast - by Types
- 9.2.1. 4 SIP Accounts
- 9.2.2. 6 SIP Accounts
- 9.2.3. 8 SIP Accounts
- 9.2.4. 10 SIP Accounts
- 9.1. Market Analysis, Insights and Forecast - by Application
- 10. Asia Pacific wireless ip phone Analysis, Insights and Forecast, 2019-2031
- 10.1. Market Analysis, Insights and Forecast - by Application
- 10.1.1. Retail
- 10.1.2. Logistics
- 10.1.3. Medical
- 10.1.4. Security
- 10.1.5. Hospitality
- 10.1.6. Manufacturing
- 10.1.7. Other
- 10.2. Market Analysis, Insights and Forecast - by Types
- 10.2.1. 4 SIP Accounts
- 10.2.2. 6 SIP Accounts
- 10.2.3. 8 SIP Accounts
- 10.2.4. 10 SIP Accounts
- 10.1. Market Analysis, Insights and Forecast - by Application
- 11. Competitive Analysis
- 11.1. Global Market Share Analysis 2024
- 11.2. Company Profiles
- 11.2.1 Snom
- 11.2.1.1. Overview
- 11.2.1.2. Products
- 11.2.1.3. SWOT Analysis
- 11.2.1.4. Recent Developments
- 11.2.1.5. Financials (Based on Availability)
- 11.2.2 Grandstream
- 11.2.2.1. Overview
- 11.2.2.2. Products
- 11.2.2.3. SWOT Analysis
- 11.2.2.4. Recent Developments
- 11.2.2.5. Financials (Based on Availability)
- 11.2.3 Yealink
- 11.2.3.1. Overview
- 11.2.3.2. Products
- 11.2.3.3. SWOT Analysis
- 11.2.3.4. Recent Developments
- 11.2.3.5. Financials (Based on Availability)
- 11.2.4 Ooma Telo
- 11.2.4.1. Overview
- 11.2.4.2. Products
- 11.2.4.3. SWOT Analysis
- 11.2.4.4. Recent Developments
- 11.2.4.5. Financials (Based on Availability)
- 11.2.5 Cisco
- 11.2.5.1. Overview
- 11.2.5.2. Products
- 11.2.5.3. SWOT Analysis
- 11.2.5.4. Recent Developments
- 11.2.5.5. Financials (Based on Availability)
- 11.2.6 Panasonic
- 11.2.6.1. Overview
- 11.2.6.2. Products
- 11.2.6.3. SWOT Analysis
- 11.2.6.4. Recent Developments
- 11.2.6.5. Financials (Based on Availability)
- 11.2.7 Gigaset
- 11.2.7.1. Overview
- 11.2.7.2. Products
- 11.2.7.3. SWOT Analysis
- 11.2.7.4. Recent Developments
- 11.2.7.5. Financials (Based on Availability)
- 11.2.8 Spectralink
- 11.2.8.1. Overview
- 11.2.8.2. Products
- 11.2.8.3. SWOT Analysis
- 11.2.8.4. Recent Developments
- 11.2.8.5. Financials (Based on Availability)
- 11.2.9 Vtech
- 11.2.9.1. Overview
- 11.2.9.2. Products
- 11.2.9.3. SWOT Analysis
- 11.2.9.4. Recent Developments
- 11.2.9.5. Financials (Based on Availability)
- 11.2.10 Mitel Networks
- 11.2.10.1. Overview
- 11.2.10.2. Products
- 11.2.10.3. SWOT Analysis
- 11.2.10.4. Recent Developments
- 11.2.10.5. Financials (Based on Availability)
- 11.2.1 Snom
List of Figures
- Figure 1: Global wireless ip phone Revenue Breakdown (million, %) by Region 2024 & 2032
- Figure 2: Global wireless ip phone Volume Breakdown (K, %) by Region 2024 & 2032
- Figure 3: North America wireless ip phone Revenue (million), by Application 2024 & 2032
- Figure 4: North America wireless ip phone Volume (K), by Application 2024 & 2032
- Figure 5: North America wireless ip phone Revenue Share (%), by Application 2024 & 2032
- Figure 6: North America wireless ip phone Volume Share (%), by Application 2024 & 2032
- Figure 7: North America wireless ip phone Revenue (million), by Types 2024 & 2032
- Figure 8: North America wireless ip phone Volume (K), by Types 2024 & 2032
- Figure 9: North America wireless ip phone Revenue Share (%), by Types 2024 & 2032
- Figure 10: North America wireless ip phone Volume Share (%), by Types 2024 & 2032
- Figure 11: North America wireless ip phone Revenue (million), by Country 2024 & 2032
- Figure 12: North America wireless ip phone Volume (K), by Country 2024 & 2032
- Figure 13: North America wireless ip phone Revenue Share (%), by Country 2024 & 2032
- Figure 14: North America wireless ip phone Volume Share (%), by Country 2024 & 2032
- Figure 15: South America wireless ip phone Revenue (million), by Application 2024 & 2032
- Figure 16: South America wireless ip phone Volume (K), by Application 2024 & 2032
- Figure 17: South America wireless ip phone Revenue Share (%), by Application 2024 & 2032
- Figure 18: South America wireless ip phone Volume Share (%), by Application 2024 & 2032
- Figure 19: South America wireless ip phone Revenue (million), by Types 2024 & 2032
- Figure 20: South America wireless ip phone Volume (K), by Types 2024 & 2032
- Figure 21: South America wireless ip phone Revenue Share (%), by Types 2024 & 2032
- Figure 22: South America wireless ip phone Volume Share (%), by Types 2024 & 2032
- Figure 23: South America wireless ip phone Revenue (million), by Country 2024 & 2032
- Figure 24: South America wireless ip phone Volume (K), by Country 2024 & 2032
- Figure 25: South America wireless ip phone Revenue Share (%), by Country 2024 & 2032
- Figure 26: South America wireless ip phone Volume Share (%), by Country 2024 & 2032
- Figure 27: Europe wireless ip phone Revenue (million), by Application 2024 & 2032
- Figure 28: Europe wireless ip phone Volume (K), by Application 2024 & 2032
- Figure 29: Europe wireless ip phone Revenue Share (%), by Application 2024 & 2032
- Figure 30: Europe wireless ip phone Volume Share (%), by Application 2024 & 2032
- Figure 31: Europe wireless ip phone Revenue (million), by Types 2024 & 2032
- Figure 32: Europe wireless ip phone Volume (K), by Types 2024 & 2032
- Figure 33: Europe wireless ip phone Revenue Share (%), by Types 2024 & 2032
- Figure 34: Europe wireless ip phone Volume Share (%), by Types 2024 & 2032
- Figure 35: Europe wireless ip phone Revenue (million), by Country 2024 & 2032
- Figure 36: Europe wireless ip phone Volume (K), by Country 2024 & 2032
- Figure 37: Europe wireless ip phone Revenue Share (%), by Country 2024 & 2032
- Figure 38: Europe wireless ip phone Volume Share (%), by Country 2024 & 2032
- Figure 39: Middle East & Africa wireless ip phone Revenue (million), by Application 2024 & 2032
- Figure 40: Middle East & Africa wireless ip phone Volume (K), by Application 2024 & 2032
- Figure 41: Middle East & Africa wireless ip phone Revenue Share (%), by Application 2024 & 2032
- Figure 42: Middle East & Africa wireless ip phone Volume Share (%), by Application 2024 & 2032
- Figure 43: Middle East & Africa wireless ip phone Revenue (million), by Types 2024 & 2032
- Figure 44: Middle East & Africa wireless ip phone Volume (K), by Types 2024 & 2032
- Figure 45: Middle East & Africa wireless ip phone Revenue Share (%), by Types 2024 & 2032
- Figure 46: Middle East & Africa wireless ip phone Volume Share (%), by Types 2024 & 2032
- Figure 47: Middle East & Africa wireless ip phone Revenue (million), by Country 2024 & 2032
- Figure 48: Middle East & Africa wireless ip phone Volume (K), by Country 2024 & 2032
- Figure 49: Middle East & Africa wireless ip phone Revenue Share (%), by Country 2024 & 2032
- Figure 50: Middle East & Africa wireless ip phone Volume Share (%), by Country 2024 & 2032
- Figure 51: Asia Pacific wireless ip phone Revenue (million), by Application 2024 & 2032
- Figure 52: Asia Pacific wireless ip phone Volume (K), by Application 2024 & 2032
- Figure 53: Asia Pacific wireless ip phone Revenue Share (%), by Application 2024 & 2032
- Figure 54: Asia Pacific wireless ip phone Volume Share (%), by Application 2024 & 2032
- Figure 55: Asia Pacific wireless ip phone Revenue (million), by Types 2024 & 2032
- Figure 56: Asia Pacific wireless ip phone Volume (K), by Types 2024 & 2032
- Figure 57: Asia Pacific wireless ip phone Revenue Share (%), by Types 2024 & 2032
- Figure 58: Asia Pacific wireless ip phone Volume Share (%), by Types 2024 & 2032
- Figure 59: Asia Pacific wireless ip phone Revenue (million), by Country 2024 & 2032
- Figure 60: Asia Pacific wireless ip phone Volume (K), by Country 2024 & 2032
- Figure 61: Asia Pacific wireless ip phone Revenue Share (%), by Country 2024 & 2032
- Figure 62: Asia Pacific wireless ip phone Volume Share (%), by Country 2024 & 2032
List of Tables
- Table 1: Global wireless ip phone Revenue million Forecast, by Region 2019 & 2032
- Table 2: Global wireless ip phone Volume K Forecast, by Region 2019 & 2032
- Table 3: Global wireless ip phone Revenue million Forecast, by Application 2019 & 2032
- Table 4: Global wireless ip phone Volume K Forecast, by Application 2019 & 2032
- Table 5: Global wireless ip phone Revenue million Forecast, by Types 2019 & 2032
- Table 6: Global wireless ip phone Volume K Forecast, by Types 2019 & 2032
- Table 7: Global wireless ip phone Revenue million Forecast, by Region 2019 & 2032
- Table 8: Global wireless ip phone Volume K Forecast, by Region 2019 & 2032
- Table 9: Global wireless ip phone Revenue million Forecast, by Application 2019 & 2032
- Table 10: Global wireless ip phone Volume K Forecast, by Application 2019 & 2032
- Table 11: Global wireless ip phone Revenue million Forecast, by Types 2019 & 2032
- Table 12: Global wireless ip phone Volume K Forecast, by Types 2019 & 2032
- Table 13: Global wireless ip phone Revenue million Forecast, by Country 2019 & 2032
- Table 14: Global wireless ip phone Volume K Forecast, by Country 2019 & 2032
- Table 15: United States wireless ip phone Revenue (million) Forecast, by Application 2019 & 2032
- Table 16: United States wireless ip phone Volume (K) Forecast, by Application 2019 & 2032
- Table 17: Canada wireless ip phone Revenue (million) Forecast, by Application 2019 & 2032
- Table 18: Canada wireless ip phone Volume (K) Forecast, by Application 2019 & 2032
- Table 19: Mexico wireless ip phone Revenue (million) Forecast, by Application 2019 & 2032
- Table 20: Mexico wireless ip phone Volume (K) Forecast, by Application 2019 & 2032
- Table 21: Global wireless ip phone Revenue million Forecast, by Application 2019 & 2032
- Table 22: Global wireless ip phone Volume K Forecast, by Application 2019 & 2032
- Table 23: Global wireless ip phone Revenue million Forecast, by Types 2019 & 2032
- Table 24: Global wireless ip phone Volume K Forecast, by Types 2019 & 2032
- Table 25: Global wireless ip phone Revenue million Forecast, by Country 2019 & 2032
- Table 26: Global wireless ip phone Volume K Forecast, by Country 2019 & 2032
- Table 27: Brazil wireless ip phone Revenue (million) Forecast, by Application 2019 & 2032
- Table 28: Brazil wireless ip phone Volume (K) Forecast, by Application 2019 & 2032
- Table 29: Argentina wireless ip phone Revenue (million) Forecast, by Application 2019 & 2032
- Table 30: Argentina wireless ip phone Volume (K) Forecast, by Application 2019 & 2032
- Table 31: Rest of South America wireless ip phone Revenue (million) Forecast, by Application 2019 & 2032
- Table 32: Rest of South America wireless ip phone Volume (K) Forecast, by Application 2019 & 2032
- Table 33: Global wireless ip phone Revenue million Forecast, by Application 2019 & 2032
- Table 34: Global wireless ip phone Volume K Forecast, by Application 2019 & 2032
- Table 35: Global wireless ip phone Revenue million Forecast, by Types 2019 & 2032
- Table 36: Global wireless ip phone Volume K Forecast, by Types 2019 & 2032
- Table 37: Global wireless ip phone Revenue million Forecast, by Country 2019 & 2032
- Table 38: Global wireless ip phone Volume K Forecast, by Country 2019 & 2032
- Table 39: United Kingdom wireless ip phone Revenue (million) Forecast, by Application 2019 & 2032
- Table 40: United Kingdom wireless ip phone Volume (K) Forecast, by Application 2019 & 2032
- Table 41: Germany wireless ip phone Revenue (million) Forecast, by Application 2019 & 2032
- Table 42: Germany wireless ip phone Volume (K) Forecast, by Application 2019 & 2032
- Table 43: France wireless ip phone Revenue (million) Forecast, by Application 2019 & 2032
- Table 44: France wireless ip phone Volume (K) Forecast, by Application 2019 & 2032
- Table 45: Italy wireless ip phone Revenue (million) Forecast, by Application 2019 & 2032
- Table 46: Italy wireless ip phone Volume (K) Forecast, by Application 2019 & 2032
- Table 47: Spain wireless ip phone Revenue (million) Forecast, by Application 2019 & 2032
- Table 48: Spain wireless ip phone Volume (K) Forecast, by Application 2019 & 2032
- Table 49: Russia wireless ip phone Revenue (million) Forecast, by Application 2019 & 2032
- Table 50: Russia wireless ip phone Volume (K) Forecast, by Application 2019 & 2032
- Table 51: Benelux wireless ip phone Revenue (million) Forecast, by Application 2019 & 2032
- Table 52: Benelux wireless ip phone Volume (K) Forecast, by Application 2019 & 2032
- Table 53: Nordics wireless ip phone Revenue (million) Forecast, by Application 2019 & 2032
- Table 54: Nordics wireless ip phone Volume (K) Forecast, by Application 2019 & 2032
- Table 55: Rest of Europe wireless ip phone Revenue (million) Forecast, by Application 2019 & 2032
- Table 56: Rest of Europe wireless ip phone Volume (K) Forecast, by Application 2019 & 2032
- Table 57: Global wireless ip phone Revenue million Forecast, by Application 2019 & 2032
- Table 58: Global wireless ip phone Volume K Forecast, by Application 2019 & 2032
- Table 59: Global wireless ip phone Revenue million Forecast, by Types 2019 & 2032
- Table 60: Global wireless ip phone Volume K Forecast, by Types 2019 & 2032
- Table 61: Global wireless ip phone Revenue million Forecast, by Country 2019 & 2032
- Table 62: Global wireless ip phone Volume K Forecast, by Country 2019 & 2032
- Table 63: Turkey wireless ip phone Revenue (million) Forecast, by Application 2019 & 2032
- Table 64: Turkey wireless ip phone Volume (K) Forecast, by Application 2019 & 2032
- Table 65: Israel wireless ip phone Revenue (million) Forecast, by Application 2019 & 2032
- Table 66: Israel wireless ip phone Volume (K) Forecast, by Application 2019 & 2032
- Table 67: GCC wireless ip phone Revenue (million) Forecast, by Application 2019 & 2032
- Table 68: GCC wireless ip phone Volume (K) Forecast, by Application 2019 & 2032
- Table 69: North Africa wireless ip phone Revenue (million) Forecast, by Application 2019 & 2032
- Table 70: North Africa wireless ip phone Volume (K) Forecast, by Application 2019 & 2032
- Table 71: South Africa wireless ip phone Revenue (million) Forecast, by Application 2019 & 2032
- Table 72: South Africa wireless ip phone Volume (K) Forecast, by Application 2019 & 2032
- Table 73: Rest of Middle East & Africa wireless ip phone Revenue (million) Forecast, by Application 2019 & 2032
- Table 74: Rest of Middle East & Africa wireless ip phone Volume (K) Forecast, by Application 2019 & 2032
- Table 75: Global wireless ip phone Revenue million Forecast, by Application 2019 & 2032
- Table 76: Global wireless ip phone Volume K Forecast, by Application 2019 & 2032
- Table 77: Global wireless ip phone Revenue million Forecast, by Types 2019 & 2032
- Table 78: Global wireless ip phone Volume K Forecast, by Types 2019 & 2032
- Table 79: Global wireless ip phone Revenue million Forecast, by Country 2019 & 2032
- Table 80: Global wireless ip phone Volume K Forecast, by Country 2019 & 2032
- Table 81: China wireless ip phone Revenue (million) Forecast, by Application 2019 & 2032
- Table 82: China wireless ip phone Volume (K) Forecast, by Application 2019 & 2032
- Table 83: India wireless ip phone Revenue (million) Forecast, by Application 2019 & 2032
- Table 84: India wireless ip phone Volume (K) Forecast, by Application 2019 & 2032
- Table 85: Japan wireless ip phone Revenue (million) Forecast, by Application 2019 & 2032
- Table 86: Japan wireless ip phone Volume (K) Forecast, by Application 2019 & 2032
- Table 87: South Korea wireless ip phone Revenue (million) Forecast, by Application 2019 & 2032
- Table 88: South Korea wireless ip phone Volume (K) Forecast, by Application 2019 & 2032
- Table 89: ASEAN wireless ip phone Revenue (million) Forecast, by Application 2019 & 2032
- Table 90: ASEAN wireless ip phone Volume (K) Forecast, by Application 2019 & 2032
- Table 91: Oceania wireless ip phone Revenue (million) Forecast, by Application 2019 & 2032
- Table 92: Oceania wireless ip phone Volume (K) Forecast, by Application 2019 & 2032
- Table 93: Rest of Asia Pacific wireless ip phone Revenue (million) Forecast, by Application 2019 & 2032
- Table 94: Rest of Asia Pacific wireless ip phone Volume (K) Forecast, by Application 2019 & 2032
Frequently Asked Questions
1. What is the projected Compound Annual Growth Rate (CAGR) of the wireless ip phone?
The projected CAGR is approximately XX%.
2. Which companies are prominent players in the wireless ip phone?
Key companies in the market include Snom, Grandstream, Yealink, Ooma Telo, Cisco, Panasonic, Gigaset, Spectralink, Vtech, Mitel Networks.
3. What are the main segments of the wireless ip phone?
The market segments include Application, Types.
4. Can you provide details about the market size?
The market size is estimated to be USD XXX million as of 2022.
5. What are some drivers contributing to market growth?
N/A
6. What are the notable trends driving market growth?
N/A
7. Are there any restraints impacting market growth?
N/A
8. Can you provide examples of recent developments in the market?
N/A
9. What pricing options are available for accessing the report?
Pricing options include single-user, multi-user, and enterprise licenses priced at USD 4350.00, USD 6525.00, and USD 8700.00 respectively.
10. Is the market size provided in terms of value or volume?
The market size is provided in terms of value, measured in million and volume, measured in K.
11. Are there any specific market keywords associated with the report?
Yes, the market keyword associated with the report is "wireless ip phone," which aids in identifying and referencing the specific market segment covered.
12. How do I determine which pricing option suits my needs best?
The pricing options vary based on user requirements and access needs. Individual users may opt for single-user licenses, while businesses requiring broader access may choose multi-user or enterprise licenses for cost-effective access to the report.
13. Are there any additional resources or data provided in the wireless ip phone report?
While the report offers comprehensive insights, it's advisable to review the specific contents or supplementary materials provided to ascertain if additional resources or data are available.
14. How can I stay updated on further developments or reports in the wireless ip phone?
To stay informed about further developments, trends, and reports in the wireless ip phone, consider subscribing to industry newsletters, following relevant companies and organizations, or regularly checking reputable industry news sources and publications.
Methodology
Step 1 - Identification of Relevant Samples Size from Population Database


Step 2 - Approaches for Defining Global Market Size (Value, Volume* & Price*)

Note*: In applicable scenarios
Step 3 - Data Sources
Primary Research
- Web Analytics
- Survey Reports
- Research Institute
- Latest Research Reports
- Opinion Leaders
Secondary Research
- Annual Reports
- White Paper
- Latest Press Release
- Industry Association
- Paid Database
- Investor Presentations

Step 4 - Data Triangulation
Involves using different sources of information in order to increase the validity of a study
These sources are likely to be stakeholders in a program - participants, other researchers, program staff, other community members, and so on.
Then we put all data in single framework & apply various statistical tools to find out the dynamic on the market.
During the analysis stage, feedback from the stakeholder groups would be compared to determine areas of agreement as well as areas of divergence
