

Key Insights
The Wireless Radio Access Network (RAN) market is experiencing robust growth, driven by the escalating demand for high-speed data, increased mobile device penetration, and the expansion of 5G networks globally. The market's Compound Annual Growth Rate (CAGR) is projected to remain strong throughout the forecast period (2025-2033), fueled by continuous technological advancements like virtualization, cloud-native architectures, and the integration of artificial intelligence (AI) for network optimization. Major players like Cisco, Nokia, and Samsung are actively investing in research and development to enhance network capacity, efficiency, and security, leading to a highly competitive yet innovative landscape. The increasing adoption of Open RAN initiatives aims to foster greater interoperability and reduce vendor lock-in, further shaping market dynamics. While challenges remain, such as the high upfront investment costs associated with 5G infrastructure deployment and spectrum scarcity in certain regions, the overall market outlook is positive.
Segment-wise, the market is diversified across various technologies (4G, 5G, etc.), deployment models (macrocell, small cell, etc.), and geographical regions. While North America and Europe currently hold a significant market share, the Asia-Pacific region is expected to demonstrate substantial growth due to rapid urbanization, increasing smartphone adoption, and government initiatives promoting digital infrastructure development. The substantial investments in infrastructure upgrades are propelling growth, with a particular focus on improving network coverage and capacity, especially in rural areas. Furthermore, the integration of private 5G networks in industries like manufacturing, healthcare, and transportation is creating new revenue streams and expanding the market's overall potential. This growth is expected to continue, resulting in significant market expansion in the coming years, particularly with the increasing demand for improved network performance and reliability.
Wireless RAN Market Report: 2019-2033
This comprehensive report provides an in-depth analysis of the Wireless RAN (Radio Access Network) market, encompassing market dynamics, growth trends, regional analysis, product landscape, key players, and future outlook. The report covers the period 2019-2033, with a focus on the forecast period 2025-2033, using 2025 as the base and estimated year. The parent market is the broader telecommunications infrastructure market, while the child market is specifically Wireless RAN solutions. Market values are presented in million units.
Wireless RAN Market Dynamics & Structure
The Wireless RAN market is characterized by a dynamic interplay of technological innovation, regulatory changes, and intense competition. Market concentration is moderate, with a few dominant players and several smaller, specialized firms. Technological advancements, such as the deployment of 5G and beyond, are driving significant growth, while regulatory frameworks, particularly spectrum allocation policies, influence market expansion. The market experiences continuous innovation with the introduction of virtualized RAN (vRAN) and open RAN architectures. Substitutes include traditional wired infrastructure, though their relevance is decreasing with the growing demand for wireless connectivity. The end-user demographics include telecommunication service providers, enterprises, and government agencies. M&A activity has been moderate, with xx deals recorded between 2019-2024, representing a xx% increase compared to the previous period. Market share is approximately distributed as follows: Top 3 players hold xx%, followed by xx% for the next 5, with the remaining xx% held by smaller entities. Barriers to innovation include high initial investment costs, complex integration challenges, and the need for skilled workforce.
- Market Concentration: Moderately concentrated.
- Technological Innovation Drivers: 5G, vRAN, Open RAN.
- Regulatory Frameworks: Spectrum allocation, licensing requirements.
- Competitive Product Substitutes: Wired infrastructure.
- End-User Demographics: Telecom providers, enterprises, government.
- M&A Trends: xx deals (2019-2024), xx% increase compared to previous period.
Wireless RAN Growth Trends & Insights
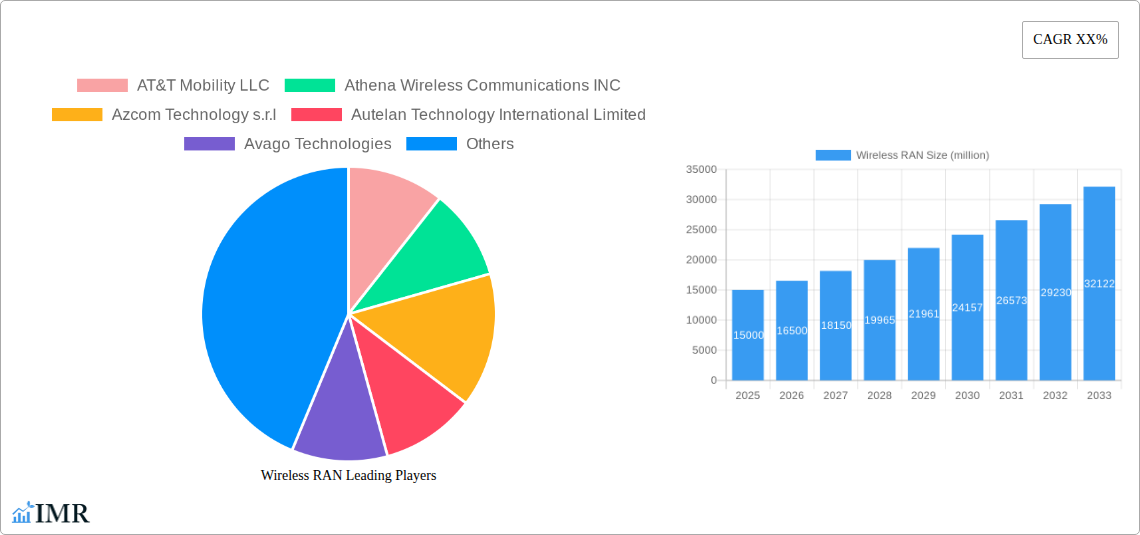
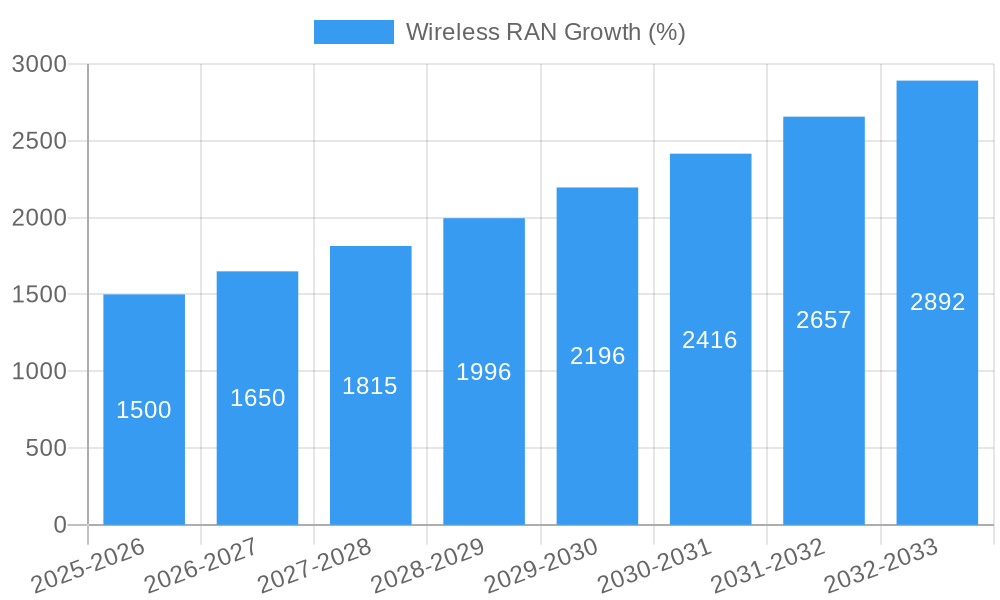
The Wireless RAN market experienced significant growth during the historical period (2019-2024), with a Compound Annual Growth Rate (CAGR) of xx%. This growth is fueled by increasing demand for high-speed data, expanding mobile broadband adoption, and the proliferation of connected devices. The market size in 2024 was estimated at $xx million, and is projected to reach $xx million in 2025 and $xx million by 2033, exhibiting a CAGR of xx% during the forecast period (2025-2033). Market penetration of 5G is a crucial factor, accelerating the transition from 4G/LTE. Technological disruptions, including the adoption of software-defined networking (SDN) and network function virtualization (NFV), are further driving growth. Consumer behavior shifts towards increased mobile data consumption and demand for enhanced user experiences are crucial factors.
Dominant Regions, Countries, or Segments in Wireless RAN
North America currently dominates the Wireless RAN market, driven by early 5G deployments and robust infrastructure investments. Asia-Pacific is expected to experience the fastest growth in the coming years, propelled by the increasing adoption of mobile services, expanding mobile infrastructure, and government initiatives promoting digital transformation. Europe is expected to show steady growth due to the investments in 5G networks and government support.
- North America: High adoption of 5G, strong infrastructure investment.
- Asia-Pacific: Fastest growth, driven by increasing mobile penetration and government support.
- Europe: Steady growth, driven by 5G rollouts and government initiatives.
- Other Regions: Emerging markets with significant growth potential.
Wireless RAN Product Landscape
The Wireless RAN product landscape comprises a range of hardware and software solutions, including base stations, antennas, small cells, and core network equipment. Recent innovations focus on virtualized RAN (vRAN), open RAN architectures, and improved energy efficiency. These advancements offer enhanced flexibility, scalability, and cost-effectiveness. Unique selling propositions include improved network performance, reduced latency, and simplified deployment. Technological advancements include AI-powered network optimization and automation, along with advanced antenna technologies such as massive MIMO.
Key Drivers, Barriers & Challenges in Wireless RAN
Key Drivers:
- The increasing demand for higher bandwidth and lower latency.
- The expansion of 5G networks globally.
- The growth of IoT and M2M devices.
- Government support for digital transformation initiatives.
Key Challenges & Restraints:
- High initial investment costs for 5G infrastructure.
- The complexity of deploying and integrating new technologies.
- Supply chain disruptions causing component shortages.
- Regulatory hurdles and spectrum allocation policies impact market expansion.
Emerging Opportunities in Wireless RAN
Emerging opportunities include private 5G networks for enterprises, edge computing deployments to support real-time applications, and the expansion of 5G services in rural areas. Further growth is expected in software-defined networking (SDN) and network function virtualization (NFV). The increasing demand for private 5G and the development of open RAN architectures also represent significant growth opportunities.
Growth Accelerators in the Wireless RAN Industry
Long-term growth will be driven by technological breakthroughs such as 6G development, strategic partnerships between equipment vendors and network operators, and expansion into new markets. Government support for digitalization and increased private sector investments will further accelerate growth.
Key Players Shaping the Wireless RAN Market
- AT&T Mobility LLC
- Athena Wireless Communications INC
- Azcom Technology s.r.l
- Autelan Technology International Limited
- Avago Technologies
- Aviat Networks
- AVM GmbH
- Axell Wireless ltd
- BandwidthX,Inc
- China United network communications group co.ltd
- Celtro communication Ltd
- Cisco Systems Inc
- Ceragon Networks Ltd
- Kpn International
- NTT Docomo,Inc
- Nokia Corporation
- Nomadix,Inc
- Red Hat,Inc
- Redline Communications
- Reverb Networks Inc
- RF DSP Inc
- RF Window
- Saguna Networks Ltd
- Samsung Electronics Co.,Ltd
- Telstra Corporation Limited
Notable Milestones in Wireless RAN Sector
- 2020: Increased investments in 5G infrastructure across multiple regions.
- 2021: Launch of several new vRAN and open RAN solutions by key players.
- 2022: Significant progress in the development and deployment of private 5G networks.
- 2023: Continued research and development of 6G technologies.
- 2024: Merger and acquisition activity in the wireless RAN sector.
In-Depth Wireless RAN Market Outlook
The Wireless RAN market is poised for continued strong growth, driven by the sustained expansion of 5G networks, the emergence of private 5G, and the increasing adoption of IoT devices. Strategic partnerships and technological innovations will further accelerate market growth. The market presents significant opportunities for companies to capitalize on the growing demand for high-speed, reliable wireless connectivity. The long-term outlook is optimistic, with substantial potential for market expansion across various segments and regions.
Wireless RAN Segmentation
-
1. Application
- 1.1. Healthcare
- 1.2. Automotive
- 1.3. Consumer Electronics
- 1.4. Defence
- 1.5. Industries
-
2. Types
- 2.1. Broadcast Radio
- 2.2. Cellular Radio
Wireless RAN Segmentation By Geography
-
1. North America
- 1.1. United States
- 1.2. Canada
- 1.3. Mexico
-
2. South America
- 2.1. Brazil
- 2.2. Argentina
- 2.3. Rest of South America
-
3. Europe
- 3.1. United Kingdom
- 3.2. Germany
- 3.3. France
- 3.4. Italy
- 3.5. Spain
- 3.6. Russia
- 3.7. Benelux
- 3.8. Nordics
- 3.9. Rest of Europe
-
4. Middle East & Africa
- 4.1. Turkey
- 4.2. Israel
- 4.3. GCC
- 4.4. North Africa
- 4.5. South Africa
- 4.6. Rest of Middle East & Africa
-
5. Asia Pacific
- 5.1. China
- 5.2. India
- 5.3. Japan
- 5.4. South Korea
- 5.5. ASEAN
- 5.6. Oceania
- 5.7. Rest of Asia Pacific

Wireless RAN REPORT HIGHLIGHTS
| Aspects | Details |
|---|---|
| Study Period | 2019-2033 |
| Base Year | 2024 |
| Estimated Year | 2025 |
| Forecast Period | 2025-2033 |
| Historical Period | 2019-2024 |
| Growth Rate | CAGR of XX% from 2019-2033 |
| Segmentation |
|
Table of Contents
- 1. Introduction
- 1.1. Research Scope
- 1.2. Market Segmentation
- 1.3. Research Methodology
- 1.4. Definitions and Assumptions
- 2. Executive Summary
- 2.1. Introduction
- 3. Market Dynamics
- 3.1. Introduction
- 3.2. Market Drivers
- 3.3. Market Restrains
- 3.4. Market Trends
- 4. Market Factor Analysis
- 4.1. Porters Five Forces
- 4.2. Supply/Value Chain
- 4.3. PESTEL analysis
- 4.4. Market Entropy
- 4.5. Patent/Trademark Analysis
- 5. Global Wireless RAN Analysis, Insights and Forecast, 2019-2031
- 5.1. Market Analysis, Insights and Forecast - by Application
- 5.1.1. Healthcare
- 5.1.2. Automotive
- 5.1.3. Consumer Electronics
- 5.1.4. Defence
- 5.1.5. Industries
- 5.2. Market Analysis, Insights and Forecast - by Types
- 5.2.1. Broadcast Radio
- 5.2.2. Cellular Radio
- 5.3. Market Analysis, Insights and Forecast - by Region
- 5.3.1. North America
- 5.3.2. South America
- 5.3.3. Europe
- 5.3.4. Middle East & Africa
- 5.3.5. Asia Pacific
- 5.1. Market Analysis, Insights and Forecast - by Application
- 6. North America Wireless RAN Analysis, Insights and Forecast, 2019-2031
- 6.1. Market Analysis, Insights and Forecast - by Application
- 6.1.1. Healthcare
- 6.1.2. Automotive
- 6.1.3. Consumer Electronics
- 6.1.4. Defence
- 6.1.5. Industries
- 6.2. Market Analysis, Insights and Forecast - by Types
- 6.2.1. Broadcast Radio
- 6.2.2. Cellular Radio
- 6.1. Market Analysis, Insights and Forecast - by Application
- 7. South America Wireless RAN Analysis, Insights and Forecast, 2019-2031
- 7.1. Market Analysis, Insights and Forecast - by Application
- 7.1.1. Healthcare
- 7.1.2. Automotive
- 7.1.3. Consumer Electronics
- 7.1.4. Defence
- 7.1.5. Industries
- 7.2. Market Analysis, Insights and Forecast - by Types
- 7.2.1. Broadcast Radio
- 7.2.2. Cellular Radio
- 7.1. Market Analysis, Insights and Forecast - by Application
- 8. Europe Wireless RAN Analysis, Insights and Forecast, 2019-2031
- 8.1. Market Analysis, Insights and Forecast - by Application
- 8.1.1. Healthcare
- 8.1.2. Automotive
- 8.1.3. Consumer Electronics
- 8.1.4. Defence
- 8.1.5. Industries
- 8.2. Market Analysis, Insights and Forecast - by Types
- 8.2.1. Broadcast Radio
- 8.2.2. Cellular Radio
- 8.1. Market Analysis, Insights and Forecast - by Application
- 9. Middle East & Africa Wireless RAN Analysis, Insights and Forecast, 2019-2031
- 9.1. Market Analysis, Insights and Forecast - by Application
- 9.1.1. Healthcare
- 9.1.2. Automotive
- 9.1.3. Consumer Electronics
- 9.1.4. Defence
- 9.1.5. Industries
- 9.2. Market Analysis, Insights and Forecast - by Types
- 9.2.1. Broadcast Radio
- 9.2.2. Cellular Radio
- 9.1. Market Analysis, Insights and Forecast - by Application
- 10. Asia Pacific Wireless RAN Analysis, Insights and Forecast, 2019-2031
- 10.1. Market Analysis, Insights and Forecast - by Application
- 10.1.1. Healthcare
- 10.1.2. Automotive
- 10.1.3. Consumer Electronics
- 10.1.4. Defence
- 10.1.5. Industries
- 10.2. Market Analysis, Insights and Forecast - by Types
- 10.2.1. Broadcast Radio
- 10.2.2. Cellular Radio
- 10.1. Market Analysis, Insights and Forecast - by Application
- 11. Competitive Analysis
- 11.1. Global Market Share Analysis 2024
- 11.2. Company Profiles
- 11.2.1 AT&T Mobility LLC
- 11.2.1.1. Overview
- 11.2.1.2. Products
- 11.2.1.3. SWOT Analysis
- 11.2.1.4. Recent Developments
- 11.2.1.5. Financials (Based on Availability)
- 11.2.2 Athena Wireless Communications INC
- 11.2.2.1. Overview
- 11.2.2.2. Products
- 11.2.2.3. SWOT Analysis
- 11.2.2.4. Recent Developments
- 11.2.2.5. Financials (Based on Availability)
- 11.2.3 Azcom Technology s.r.l
- 11.2.3.1. Overview
- 11.2.3.2. Products
- 11.2.3.3. SWOT Analysis
- 11.2.3.4. Recent Developments
- 11.2.3.5. Financials (Based on Availability)
- 11.2.4 Autelan Technology International Limited
- 11.2.4.1. Overview
- 11.2.4.2. Products
- 11.2.4.3. SWOT Analysis
- 11.2.4.4. Recent Developments
- 11.2.4.5. Financials (Based on Availability)
- 11.2.5 Avago Technologies
- 11.2.5.1. Overview
- 11.2.5.2. Products
- 11.2.5.3. SWOT Analysis
- 11.2.5.4. Recent Developments
- 11.2.5.5. Financials (Based on Availability)
- 11.2.6 Aviat Networks
- 11.2.6.1. Overview
- 11.2.6.2. Products
- 11.2.6.3. SWOT Analysis
- 11.2.6.4. Recent Developments
- 11.2.6.5. Financials (Based on Availability)
- 11.2.7 AVM GmbH
- 11.2.7.1. Overview
- 11.2.7.2. Products
- 11.2.7.3. SWOT Analysis
- 11.2.7.4. Recent Developments
- 11.2.7.5. Financials (Based on Availability)
- 11.2.8 Axell Wireless ltd
- 11.2.8.1. Overview
- 11.2.8.2. Products
- 11.2.8.3. SWOT Analysis
- 11.2.8.4. Recent Developments
- 11.2.8.5. Financials (Based on Availability)
- 11.2.9 BandwidthX
- 11.2.9.1. Overview
- 11.2.9.2. Products
- 11.2.9.3. SWOT Analysis
- 11.2.9.4. Recent Developments
- 11.2.9.5. Financials (Based on Availability)
- 11.2.10 Inc
- 11.2.10.1. Overview
- 11.2.10.2. Products
- 11.2.10.3. SWOT Analysis
- 11.2.10.4. Recent Developments
- 11.2.10.5. Financials (Based on Availability)
- 11.2.11 China United network communications group co.ltd
- 11.2.11.1. Overview
- 11.2.11.2. Products
- 11.2.11.3. SWOT Analysis
- 11.2.11.4. Recent Developments
- 11.2.11.5. Financials (Based on Availability)
- 11.2.12 Celtro communication Ltd
- 11.2.12.1. Overview
- 11.2.12.2. Products
- 11.2.12.3. SWOT Analysis
- 11.2.12.4. Recent Developments
- 11.2.12.5. Financials (Based on Availability)
- 11.2.13 Cisco Systems Inc
- 11.2.13.1. Overview
- 11.2.13.2. Products
- 11.2.13.3. SWOT Analysis
- 11.2.13.4. Recent Developments
- 11.2.13.5. Financials (Based on Availability)
- 11.2.14 Ceragon Networks Ltd
- 11.2.14.1. Overview
- 11.2.14.2. Products
- 11.2.14.3. SWOT Analysis
- 11.2.14.4. Recent Developments
- 11.2.14.5. Financials (Based on Availability)
- 11.2.15 Kpn International
- 11.2.15.1. Overview
- 11.2.15.2. Products
- 11.2.15.3. SWOT Analysis
- 11.2.15.4. Recent Developments
- 11.2.15.5. Financials (Based on Availability)
- 11.2.16 NTT Docomo
- 11.2.16.1. Overview
- 11.2.16.2. Products
- 11.2.16.3. SWOT Analysis
- 11.2.16.4. Recent Developments
- 11.2.16.5. Financials (Based on Availability)
- 11.2.17 Inc
- 11.2.17.1. Overview
- 11.2.17.2. Products
- 11.2.17.3. SWOT Analysis
- 11.2.17.4. Recent Developments
- 11.2.17.5. Financials (Based on Availability)
- 11.2.18 Nokia Corporation
- 11.2.18.1. Overview
- 11.2.18.2. Products
- 11.2.18.3. SWOT Analysis
- 11.2.18.4. Recent Developments
- 11.2.18.5. Financials (Based on Availability)
- 11.2.19 Nomadix
- 11.2.19.1. Overview
- 11.2.19.2. Products
- 11.2.19.3. SWOT Analysis
- 11.2.19.4. Recent Developments
- 11.2.19.5. Financials (Based on Availability)
- 11.2.20 Inc
- 11.2.20.1. Overview
- 11.2.20.2. Products
- 11.2.20.3. SWOT Analysis
- 11.2.20.4. Recent Developments
- 11.2.20.5. Financials (Based on Availability)
- 11.2.21 Red Hat
- 11.2.21.1. Overview
- 11.2.21.2. Products
- 11.2.21.3. SWOT Analysis
- 11.2.21.4. Recent Developments
- 11.2.21.5. Financials (Based on Availability)
- 11.2.22 Inc
- 11.2.22.1. Overview
- 11.2.22.2. Products
- 11.2.22.3. SWOT Analysis
- 11.2.22.4. Recent Developments
- 11.2.22.5. Financials (Based on Availability)
- 11.2.23 Redline Communications
- 11.2.23.1. Overview
- 11.2.23.2. Products
- 11.2.23.3. SWOT Analysis
- 11.2.23.4. Recent Developments
- 11.2.23.5. Financials (Based on Availability)
- 11.2.24 Reverb Networks Inc
- 11.2.24.1. Overview
- 11.2.24.2. Products
- 11.2.24.3. SWOT Analysis
- 11.2.24.4. Recent Developments
- 11.2.24.5. Financials (Based on Availability)
- 11.2.25 RF DSP Inc
- 11.2.25.1. Overview
- 11.2.25.2. Products
- 11.2.25.3. SWOT Analysis
- 11.2.25.4. Recent Developments
- 11.2.25.5. Financials (Based on Availability)
- 11.2.26 RF Window
- 11.2.26.1. Overview
- 11.2.26.2. Products
- 11.2.26.3. SWOT Analysis
- 11.2.26.4. Recent Developments
- 11.2.26.5. Financials (Based on Availability)
- 11.2.27 Saguna Networks Ltd
- 11.2.27.1. Overview
- 11.2.27.2. Products
- 11.2.27.3. SWOT Analysis
- 11.2.27.4. Recent Developments
- 11.2.27.5. Financials (Based on Availability)
- 11.2.28 Samsung Electronics Co.
- 11.2.28.1. Overview
- 11.2.28.2. Products
- 11.2.28.3. SWOT Analysis
- 11.2.28.4. Recent Developments
- 11.2.28.5. Financials (Based on Availability)
- 11.2.29 Ltd
- 11.2.29.1. Overview
- 11.2.29.2. Products
- 11.2.29.3. SWOT Analysis
- 11.2.29.4. Recent Developments
- 11.2.29.5. Financials (Based on Availability)
- 11.2.30 Telstra Corporation Limited
- 11.2.30.1. Overview
- 11.2.30.2. Products
- 11.2.30.3. SWOT Analysis
- 11.2.30.4. Recent Developments
- 11.2.30.5. Financials (Based on Availability)
- 11.2.1 AT&T Mobility LLC
List of Figures
- Figure 1: Global Wireless RAN Revenue Breakdown (million, %) by Region 2024 & 2032
- Figure 2: North America Wireless RAN Revenue (million), by Application 2024 & 2032
- Figure 3: North America Wireless RAN Revenue Share (%), by Application 2024 & 2032
- Figure 4: North America Wireless RAN Revenue (million), by Types 2024 & 2032
- Figure 5: North America Wireless RAN Revenue Share (%), by Types 2024 & 2032
- Figure 6: North America Wireless RAN Revenue (million), by Country 2024 & 2032
- Figure 7: North America Wireless RAN Revenue Share (%), by Country 2024 & 2032
- Figure 8: South America Wireless RAN Revenue (million), by Application 2024 & 2032
- Figure 9: South America Wireless RAN Revenue Share (%), by Application 2024 & 2032
- Figure 10: South America Wireless RAN Revenue (million), by Types 2024 & 2032
- Figure 11: South America Wireless RAN Revenue Share (%), by Types 2024 & 2032
- Figure 12: South America Wireless RAN Revenue (million), by Country 2024 & 2032
- Figure 13: South America Wireless RAN Revenue Share (%), by Country 2024 & 2032
- Figure 14: Europe Wireless RAN Revenue (million), by Application 2024 & 2032
- Figure 15: Europe Wireless RAN Revenue Share (%), by Application 2024 & 2032
- Figure 16: Europe Wireless RAN Revenue (million), by Types 2024 & 2032
- Figure 17: Europe Wireless RAN Revenue Share (%), by Types 2024 & 2032
- Figure 18: Europe Wireless RAN Revenue (million), by Country 2024 & 2032
- Figure 19: Europe Wireless RAN Revenue Share (%), by Country 2024 & 2032
- Figure 20: Middle East & Africa Wireless RAN Revenue (million), by Application 2024 & 2032
- Figure 21: Middle East & Africa Wireless RAN Revenue Share (%), by Application 2024 & 2032
- Figure 22: Middle East & Africa Wireless RAN Revenue (million), by Types 2024 & 2032
- Figure 23: Middle East & Africa Wireless RAN Revenue Share (%), by Types 2024 & 2032
- Figure 24: Middle East & Africa Wireless RAN Revenue (million), by Country 2024 & 2032
- Figure 25: Middle East & Africa Wireless RAN Revenue Share (%), by Country 2024 & 2032
- Figure 26: Asia Pacific Wireless RAN Revenue (million), by Application 2024 & 2032
- Figure 27: Asia Pacific Wireless RAN Revenue Share (%), by Application 2024 & 2032
- Figure 28: Asia Pacific Wireless RAN Revenue (million), by Types 2024 & 2032
- Figure 29: Asia Pacific Wireless RAN Revenue Share (%), by Types 2024 & 2032
- Figure 30: Asia Pacific Wireless RAN Revenue (million), by Country 2024 & 2032
- Figure 31: Asia Pacific Wireless RAN Revenue Share (%), by Country 2024 & 2032
List of Tables
- Table 1: Global Wireless RAN Revenue million Forecast, by Region 2019 & 2032
- Table 2: Global Wireless RAN Revenue million Forecast, by Application 2019 & 2032
- Table 3: Global Wireless RAN Revenue million Forecast, by Types 2019 & 2032
- Table 4: Global Wireless RAN Revenue million Forecast, by Region 2019 & 2032
- Table 5: Global Wireless RAN Revenue million Forecast, by Application 2019 & 2032
- Table 6: Global Wireless RAN Revenue million Forecast, by Types 2019 & 2032
- Table 7: Global Wireless RAN Revenue million Forecast, by Country 2019 & 2032
- Table 8: United States Wireless RAN Revenue (million) Forecast, by Application 2019 & 2032
- Table 9: Canada Wireless RAN Revenue (million) Forecast, by Application 2019 & 2032
- Table 10: Mexico Wireless RAN Revenue (million) Forecast, by Application 2019 & 2032
- Table 11: Global Wireless RAN Revenue million Forecast, by Application 2019 & 2032
- Table 12: Global Wireless RAN Revenue million Forecast, by Types 2019 & 2032
- Table 13: Global Wireless RAN Revenue million Forecast, by Country 2019 & 2032
- Table 14: Brazil Wireless RAN Revenue (million) Forecast, by Application 2019 & 2032
- Table 15: Argentina Wireless RAN Revenue (million) Forecast, by Application 2019 & 2032
- Table 16: Rest of South America Wireless RAN Revenue (million) Forecast, by Application 2019 & 2032
- Table 17: Global Wireless RAN Revenue million Forecast, by Application 2019 & 2032
- Table 18: Global Wireless RAN Revenue million Forecast, by Types 2019 & 2032
- Table 19: Global Wireless RAN Revenue million Forecast, by Country 2019 & 2032
- Table 20: United Kingdom Wireless RAN Revenue (million) Forecast, by Application 2019 & 2032
- Table 21: Germany Wireless RAN Revenue (million) Forecast, by Application 2019 & 2032
- Table 22: France Wireless RAN Revenue (million) Forecast, by Application 2019 & 2032
- Table 23: Italy Wireless RAN Revenue (million) Forecast, by Application 2019 & 2032
- Table 24: Spain Wireless RAN Revenue (million) Forecast, by Application 2019 & 2032
- Table 25: Russia Wireless RAN Revenue (million) Forecast, by Application 2019 & 2032
- Table 26: Benelux Wireless RAN Revenue (million) Forecast, by Application 2019 & 2032
- Table 27: Nordics Wireless RAN Revenue (million) Forecast, by Application 2019 & 2032
- Table 28: Rest of Europe Wireless RAN Revenue (million) Forecast, by Application 2019 & 2032
- Table 29: Global Wireless RAN Revenue million Forecast, by Application 2019 & 2032
- Table 30: Global Wireless RAN Revenue million Forecast, by Types 2019 & 2032
- Table 31: Global Wireless RAN Revenue million Forecast, by Country 2019 & 2032
- Table 32: Turkey Wireless RAN Revenue (million) Forecast, by Application 2019 & 2032
- Table 33: Israel Wireless RAN Revenue (million) Forecast, by Application 2019 & 2032
- Table 34: GCC Wireless RAN Revenue (million) Forecast, by Application 2019 & 2032
- Table 35: North Africa Wireless RAN Revenue (million) Forecast, by Application 2019 & 2032
- Table 36: South Africa Wireless RAN Revenue (million) Forecast, by Application 2019 & 2032
- Table 37: Rest of Middle East & Africa Wireless RAN Revenue (million) Forecast, by Application 2019 & 2032
- Table 38: Global Wireless RAN Revenue million Forecast, by Application 2019 & 2032
- Table 39: Global Wireless RAN Revenue million Forecast, by Types 2019 & 2032
- Table 40: Global Wireless RAN Revenue million Forecast, by Country 2019 & 2032
- Table 41: China Wireless RAN Revenue (million) Forecast, by Application 2019 & 2032
- Table 42: India Wireless RAN Revenue (million) Forecast, by Application 2019 & 2032
- Table 43: Japan Wireless RAN Revenue (million) Forecast, by Application 2019 & 2032
- Table 44: South Korea Wireless RAN Revenue (million) Forecast, by Application 2019 & 2032
- Table 45: ASEAN Wireless RAN Revenue (million) Forecast, by Application 2019 & 2032
- Table 46: Oceania Wireless RAN Revenue (million) Forecast, by Application 2019 & 2032
- Table 47: Rest of Asia Pacific Wireless RAN Revenue (million) Forecast, by Application 2019 & 2032
Frequently Asked Questions
1. What is the projected Compound Annual Growth Rate (CAGR) of the Wireless RAN?
The projected CAGR is approximately XX%.
2. Which companies are prominent players in the Wireless RAN?
Key companies in the market include AT&T Mobility LLC, Athena Wireless Communications INC, Azcom Technology s.r.l, Autelan Technology International Limited, Avago Technologies, Aviat Networks, AVM GmbH, Axell Wireless ltd, BandwidthX, Inc, China United network communications group co.ltd, Celtro communication Ltd, Cisco Systems Inc, Ceragon Networks Ltd, Kpn International, NTT Docomo, Inc, Nokia Corporation, Nomadix, Inc, Red Hat, Inc, Redline Communications, Reverb Networks Inc, RF DSP Inc, RF Window, Saguna Networks Ltd, Samsung Electronics Co., Ltd, Telstra Corporation Limited.
3. What are the main segments of the Wireless RAN?
The market segments include Application, Types.
4. Can you provide details about the market size?
The market size is estimated to be USD XXX million as of 2022.
5. What are some drivers contributing to market growth?
N/A
6. What are the notable trends driving market growth?
N/A
7. Are there any restraints impacting market growth?
N/A
8. Can you provide examples of recent developments in the market?
N/A
9. What pricing options are available for accessing the report?
Pricing options include single-user, multi-user, and enterprise licenses priced at USD 4900.00, USD 7350.00, and USD 9800.00 respectively.
10. Is the market size provided in terms of value or volume?
The market size is provided in terms of value, measured in million.
11. Are there any specific market keywords associated with the report?
Yes, the market keyword associated with the report is "Wireless RAN," which aids in identifying and referencing the specific market segment covered.
12. How do I determine which pricing option suits my needs best?
The pricing options vary based on user requirements and access needs. Individual users may opt for single-user licenses, while businesses requiring broader access may choose multi-user or enterprise licenses for cost-effective access to the report.
13. Are there any additional resources or data provided in the Wireless RAN report?
While the report offers comprehensive insights, it's advisable to review the specific contents or supplementary materials provided to ascertain if additional resources or data are available.
14. How can I stay updated on further developments or reports in the Wireless RAN?
To stay informed about further developments, trends, and reports in the Wireless RAN, consider subscribing to industry newsletters, following relevant companies and organizations, or regularly checking reputable industry news sources and publications.
Methodology
Step 1 - Identification of Relevant Samples Size from Population Database


Step 2 - Approaches for Defining Global Market Size (Value, Volume* & Price*)

Note*: In applicable scenarios
Step 3 - Data Sources
Primary Research
- Web Analytics
- Survey Reports
- Research Institute
- Latest Research Reports
- Opinion Leaders
Secondary Research
- Annual Reports
- White Paper
- Latest Press Release
- Industry Association
- Paid Database
- Investor Presentations

Step 4 - Data Triangulation
Involves using different sources of information in order to increase the validity of a study
These sources are likely to be stakeholders in a program - participants, other researchers, program staff, other community members, and so on.
Then we put all data in single framework & apply various statistical tools to find out the dynamic on the market.
During the analysis stage, feedback from the stakeholder groups would be compared to determine areas of agreement as well as areas of divergence
