

Key Insights
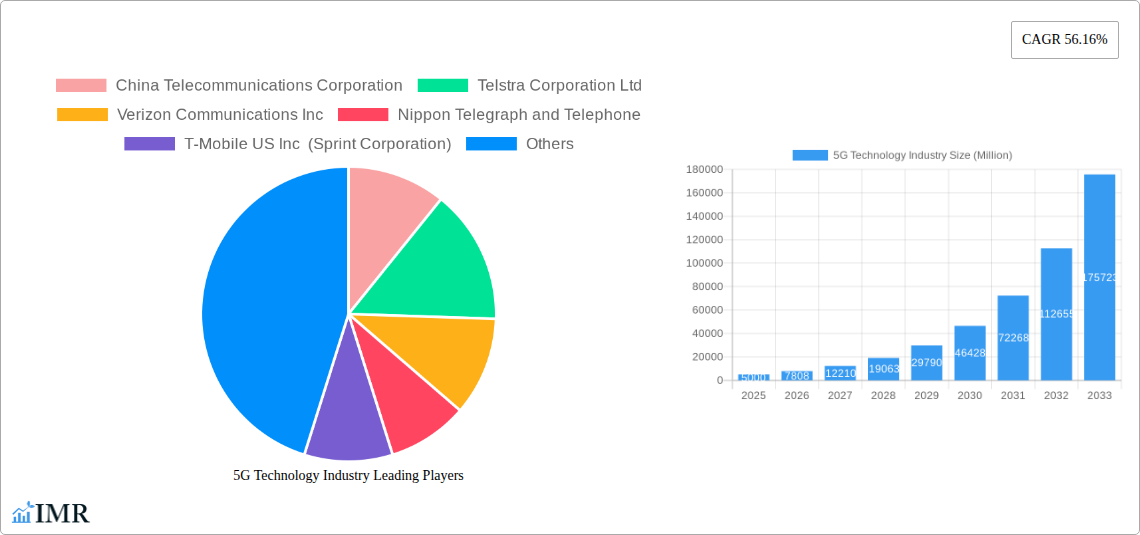
The 5G technology industry is experiencing explosive growth, driven by increasing demand for high-speed, low-latency connectivity across various sectors. With a Compound Annual Growth Rate (CAGR) of 56.16%, the market exhibits substantial potential. This rapid expansion is fueled by several key drivers, including the proliferation of smart devices, the rise of the Internet of Things (IoT), and the growing need for enhanced mobile broadband capabilities in both consumer and enterprise applications. The deployment of 5G networks is transforming industries like healthcare, manufacturing, and transportation, enabling innovative applications such as remote surgery, automated factories, and autonomous vehicles. While challenges remain, such as infrastructure development costs and spectrum allocation complexities, the long-term outlook for 5G remains exceptionally positive. Key market segments including mobile broadband, fixed wireless access, M2M/IoT, and mission-critical communications are all contributing to this growth. The competitive landscape is characterized by a mix of established telecommunication giants like Verizon, AT&T, and Vodafone, alongside technology providers such as IDEMIA, vying for market share through network deployments and innovative service offerings. Geographical distribution shows strong growth across North America, Europe, and the Asia-Pacific region, reflecting the varying stages of 5G deployment and adoption in these areas. The forecast period (2025-2033) anticipates continued robust growth, driven by ongoing technological advancements and increasing global adoption.
The substantial growth projected for the 5G market underscores its transformative impact on the global economy. The competitive landscape is dynamic, with both established telecommunication players and new entrants striving to establish themselves in this lucrative sector. Regional variations in market growth reflect differences in regulatory environments, infrastructure development, and consumer demand. While challenges like regulatory hurdles and the cost of infrastructure development exist, the positive market dynamics and growing adoption across diverse sectors suggest that the 5G market will continue its impressive growth trajectory. The diversification across segments, including M2M/IoT and mission-critical applications, hints at the technology's potential beyond just enhancing consumer mobile experiences. Continuous innovation in 5G technology and its applications is set to drive further expansion in the coming years. A strong focus on delivering enhanced network performance, security, and reliability will be crucial for maintaining market momentum and capturing the full potential of this transformative technology.
5G Technology Industry Market Report: 2019-2033
This comprehensive report provides a deep dive into the 5G technology industry, analyzing market dynamics, growth trends, key players, and future opportunities. With a focus on the parent market of telecommunications and the child markets of mobile broadband, fixed wireless access, M2M/IoT, and mission-critical applications, this report offers invaluable insights for industry professionals, investors, and strategists. The study period spans 2019-2033, with 2025 as the base and estimated year. The forecast period is 2025-2033, and the historical period covers 2019-2024.
5G Technology Industry Market Dynamics & Structure
The 5G technology market is characterized by a moderately concentrated structure, with key players like Verizon, AT&T, and China Telecom holding significant market share. Technological innovation, driven by advancements in antenna design, spectrum efficiency, and network slicing, is a primary growth driver. Stringent regulatory frameworks and licensing processes influence market entry and expansion, while competitive pressures from existing 4G LTE technology and emerging 6G technologies create dynamic market conditions. M&A activity is moderate, with deals focused on acquiring spectrum licenses and enhancing technological capabilities. The end-user demographics are broad, encompassing individual consumers, businesses, and government entities across various sectors.
- Market Concentration: High (xx%), driven by established players.
- Innovation Drivers: Advancements in antenna technology, spectrum efficiency, network slicing, and edge computing.
- Regulatory Frameworks: Stringent licensing and spectrum allocation policies vary by region.
- Competitive Substitutes: Existing 4G LTE networks, emerging 6G technologies.
- End-User Demographics: Diverse, including individual consumers, businesses (various sectors), and government.
- M&A Trends: Moderate activity, focused on spectrum acquisition and technology enhancement; xx deals in the last 5 years.
5G Technology Industry Growth Trends & Insights
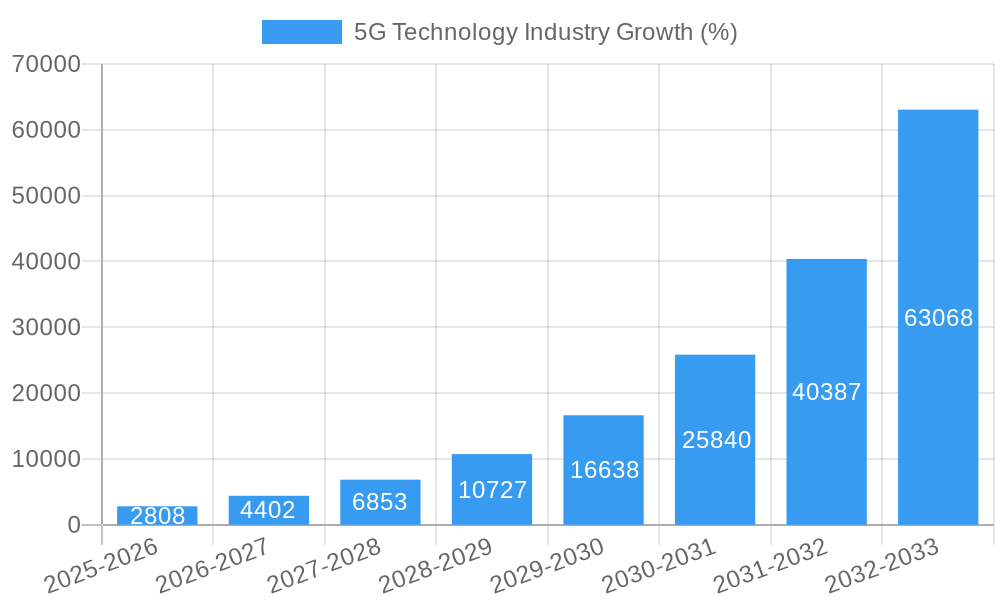
The global 5G technology market has witnessed exponential growth since its inception. Market size has increased significantly, driven by increasing adoption rates across various sectors. Technological disruptions, like the development of 5G-enabled devices and the deployment of standalone (SA) 5G networks, further fuel this expansion. Consumer behavior shifts towards higher data consumption and demand for faster speeds significantly impact market growth. This trend is projected to continue with a Compound Annual Growth Rate (CAGR) of xx% during the forecast period (2025-2033), resulting in a market size of xx Million units by 2033. Market penetration is increasing rapidly, particularly in developed economies, but significant growth potential remains in emerging markets.
Dominant Regions, Countries, or Segments in 5G Technology Industry
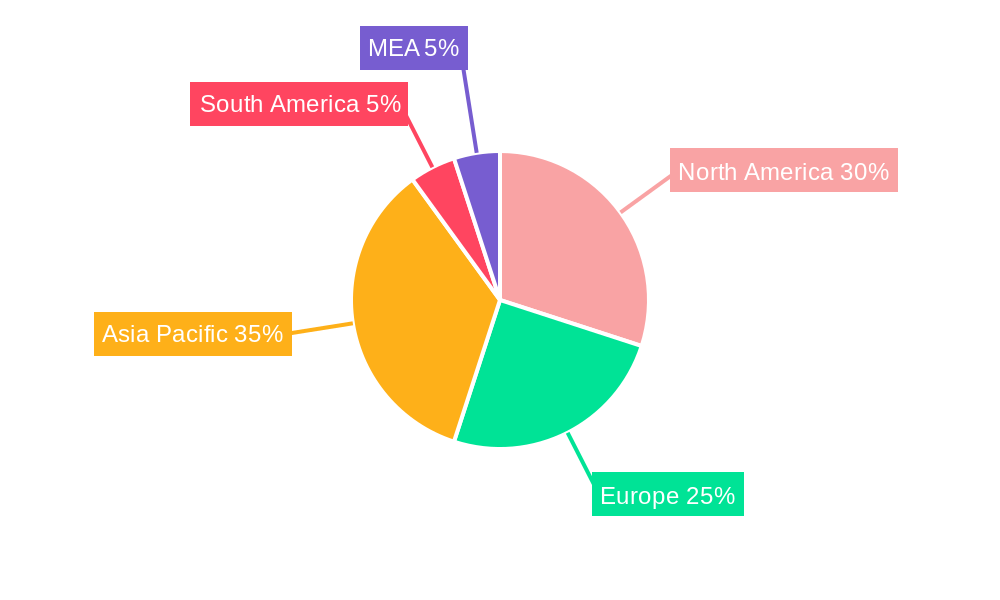
The Asia-Pacific region, particularly China and South Korea, is currently the dominant market for 5G technology, owing to substantial investments in infrastructure development and government support. North America (US) is also a key region with high market penetration and strong technological advancements. Within connection types, Mobile Broadband is the leading segment due to its widespread adoption for consumer applications.
Key Drivers:
- Asia-Pacific: Significant investments in 5G infrastructure, strong government support.
- North America: High consumer demand, advanced technology adoption.
- Mobile Broadband: Widespread consumer adoption, high demand for data and speed.
Dominance Factors: Market size, infrastructure investment, consumer demand, technological advancements.
Growth Potential: Significant opportunities remain in emerging markets and for Fixed Wireless Access and M2M/IoT segments.
5G Technology Industry Product Landscape
The 5G product landscape is dynamic, featuring a wide range of devices, infrastructure components, and software solutions. These products are characterized by enhanced speed, low latency, high capacity, and advanced network slicing capabilities. Unique selling propositions include improved user experience, enhanced connectivity for IoT applications, and support for mission-critical services. Technological advancements include the development of Massive MIMO (multiple-input and multiple-output) antennas and advanced network virtualization techniques.
Key Drivers, Barriers & Challenges in 5G Technology Industry
Key Drivers:
- Increased demand for high-speed mobile internet.
- Technological advancements enabling faster speeds and lower latency.
- Government investments in 5G infrastructure development.
- Growing adoption of IoT devices requiring enhanced connectivity.
Key Barriers & Challenges:
- High initial infrastructure deployment costs.
- Spectrum allocation limitations.
- Interoperability concerns and standardization challenges.
- Security risks related to increased connectivity.
- Supply chain vulnerabilities impacting equipment availability. (Estimated impact: xx% increase in costs in 2023)
Emerging Opportunities in 5G Technology Industry
Emerging opportunities are present in the private networks sector, which offers tailored 5G solutions for specific industries. Furthermore, 5G's integration with other technologies like AI and edge computing opens up new applications in areas like autonomous driving, remote surgery, and industrial automation. Untapped markets include rural and underdeveloped regions where 5G can bridge the digital divide.
Growth Accelerators in the 5G Technology Industry
Long-term growth will be fueled by ongoing technological breakthroughs in network optimization, edge computing, and AI integration. Strategic partnerships between telecom operators, technology providers, and industry verticals will accelerate deployment and drive innovation. Market expansion into underserved regions will significantly boost overall growth, particularly in emerging economies.
Key Players Shaping the 5G Technology Industry Market
- China Telecommunications Corporation
- Telstra Corporation Ltd
- Verizon Communications Inc
- Nippon Telegraph and Telephone
- T-Mobile US Inc (Sprint Corporation)
- Vodafone Group Plc
- IDEMIA
- AT&T Inc
- Deutsche Telekom
- Telefonica SA
Notable Milestones in 5G Technology Industry Sector
- Oct 2022: 5G rollout in India during the India Mobile Congress, demonstrating speeds of up to 10 Gbps. Bharti Airtel launched public services.
- Oct 2022: Hyundai Mobis developed a 5G communication module for automotive use, projecting 52 million vehicle deployments by 2028.
- Jan 2023: Bharti Airtel, in partnership with Apollo Hospitals, developed and tested 5G-connected ambulances and conducted an AI-guided colonoscopy trial using 5G ultra-low latency technology.
In-Depth 5G Technology Industry Market Outlook
The future of the 5G technology market is bright, with significant growth potential across various segments and regions. Continuous technological advancements and the increasing adoption of innovative applications will drive demand for 5G solutions. Strategic partnerships and investments in infrastructure development will further accelerate market growth. Emerging applications in areas like autonomous vehicles, industrial automation, and healthcare will create significant opportunities for market players. The market is poised for substantial expansion, offering considerable potential for both established players and new entrants.
5G Technology Industry Segmentation
-
1. Connection Type
- 1.1. Mobile Broadband
- 1.2. Fixed Wireless Access
- 1.3. M2M and IoT
- 1.4. Mission-critical
-
2. Application
- 2.1. Consumer Services
- 2.2. Enterprise Services
- 2.3. Industrial Services
5G Technology Industry Segmentation By Geography
-
1. North America
- 1.1. United States
- 1.2. Canada
-
2. Europe
- 2.1. Germany
- 2.2. France
- 2.3. United Kingdom
- 2.4. Rest of Europe
-
3. Asia Pacific
- 3.1. India
- 3.2. China
- 3.3. Japan
- 3.4. Rest of Asia Pacific
- 4. Rest of the World
5G Technology Industry REPORT HIGHLIGHTS
| Aspects | Details |
|---|---|
| Study Period | 2019-2033 |
| Base Year | 2024 |
| Estimated Year | 2025 |
| Forecast Period | 2025-2033 |
| Historical Period | 2019-2024 |
| Growth Rate | CAGR of 56.16% from 2019-2033 |
| Segmentation |
|
Table of Contents
- 1. Introduction
- 1.1. Research Scope
- 1.2. Market Segmentation
- 1.3. Research Methodology
- 1.4. Definitions and Assumptions
- 2. Executive Summary
- 2.1. Introduction
- 3. Market Dynamics
- 3.1. Introduction
- 3.2. Market Drivers
- 3.2.1 Increase in Demand for Wireless Broadband Services Needing Faster
- 3.2.2 Higher-Capacity Networks
- 3.3. Market Restrains
- 3.3.1. Availability of Limited Spectrum
- 3.4. Market Trends
- 3.4.1. M2M Connectivity Expected to Witness Significant Growth
- 4. Market Factor Analysis
- 4.1. Porters Five Forces
- 4.2. Supply/Value Chain
- 4.3. PESTEL analysis
- 4.4. Market Entropy
- 4.5. Patent/Trademark Analysis
- 5. Global 5G Technology Industry Analysis, Insights and Forecast, 2019-2031
- 5.1. Market Analysis, Insights and Forecast - by Connection Type
- 5.1.1. Mobile Broadband
- 5.1.2. Fixed Wireless Access
- 5.1.3. M2M and IoT
- 5.1.4. Mission-critical
- 5.2. Market Analysis, Insights and Forecast - by Application
- 5.2.1. Consumer Services
- 5.2.2. Enterprise Services
- 5.2.3. Industrial Services
- 5.3. Market Analysis, Insights and Forecast - by Region
- 5.3.1. North America
- 5.3.2. Europe
- 5.3.3. Asia Pacific
- 5.3.4. Rest of the World
- 5.1. Market Analysis, Insights and Forecast - by Connection Type
- 6. North America 5G Technology Industry Analysis, Insights and Forecast, 2019-2031
- 6.1. Market Analysis, Insights and Forecast - by Connection Type
- 6.1.1. Mobile Broadband
- 6.1.2. Fixed Wireless Access
- 6.1.3. M2M and IoT
- 6.1.4. Mission-critical
- 6.2. Market Analysis, Insights and Forecast - by Application
- 6.2.1. Consumer Services
- 6.2.2. Enterprise Services
- 6.2.3. Industrial Services
- 6.1. Market Analysis, Insights and Forecast - by Connection Type
- 7. Europe 5G Technology Industry Analysis, Insights and Forecast, 2019-2031
- 7.1. Market Analysis, Insights and Forecast - by Connection Type
- 7.1.1. Mobile Broadband
- 7.1.2. Fixed Wireless Access
- 7.1.3. M2M and IoT
- 7.1.4. Mission-critical
- 7.2. Market Analysis, Insights and Forecast - by Application
- 7.2.1. Consumer Services
- 7.2.2. Enterprise Services
- 7.2.3. Industrial Services
- 7.1. Market Analysis, Insights and Forecast - by Connection Type
- 8. Asia Pacific 5G Technology Industry Analysis, Insights and Forecast, 2019-2031
- 8.1. Market Analysis, Insights and Forecast - by Connection Type
- 8.1.1. Mobile Broadband
- 8.1.2. Fixed Wireless Access
- 8.1.3. M2M and IoT
- 8.1.4. Mission-critical
- 8.2. Market Analysis, Insights and Forecast - by Application
- 8.2.1. Consumer Services
- 8.2.2. Enterprise Services
- 8.2.3. Industrial Services
- 8.1. Market Analysis, Insights and Forecast - by Connection Type
- 9. Rest of the World 5G Technology Industry Analysis, Insights and Forecast, 2019-2031
- 9.1. Market Analysis, Insights and Forecast - by Connection Type
- 9.1.1. Mobile Broadband
- 9.1.2. Fixed Wireless Access
- 9.1.3. M2M and IoT
- 9.1.4. Mission-critical
- 9.2. Market Analysis, Insights and Forecast - by Application
- 9.2.1. Consumer Services
- 9.2.2. Enterprise Services
- 9.2.3. Industrial Services
- 9.1. Market Analysis, Insights and Forecast - by Connection Type
- 10. North America 5G Technology Industry Analysis, Insights and Forecast, 2019-2031
- 10.1. Market Analysis, Insights and Forecast - By Country/Sub-region
- 10.1.1 United States
- 10.1.2 Canada
- 10.1.3 Mexico
- 11. Europe 5G Technology Industry Analysis, Insights and Forecast, 2019-2031
- 11.1. Market Analysis, Insights and Forecast - By Country/Sub-region
- 11.1.1 Germany
- 11.1.2 United Kingdom
- 11.1.3 France
- 11.1.4 Spain
- 11.1.5 Italy
- 11.1.6 Spain
- 11.1.7 Belgium
- 11.1.8 Netherland
- 11.1.9 Nordics
- 11.1.10 Rest of Europe
- 12. Asia Pacific 5G Technology Industry Analysis, Insights and Forecast, 2019-2031
- 12.1. Market Analysis, Insights and Forecast - By Country/Sub-region
- 12.1.1 China
- 12.1.2 Japan
- 12.1.3 India
- 12.1.4 South Korea
- 12.1.5 Southeast Asia
- 12.1.6 Australia
- 12.1.7 Indonesia
- 12.1.8 Phillipes
- 12.1.9 Singapore
- 12.1.10 Thailandc
- 12.1.11 Rest of Asia Pacific
- 13. South America 5G Technology Industry Analysis, Insights and Forecast, 2019-2031
- 13.1. Market Analysis, Insights and Forecast - By Country/Sub-region
- 13.1.1 Brazil
- 13.1.2 Argentina
- 13.1.3 Peru
- 13.1.4 Chile
- 13.1.5 Colombia
- 13.1.6 Ecuador
- 13.1.7 Venezuela
- 13.1.8 Rest of South America
- 14. North America 5G Technology Industry Analysis, Insights and Forecast, 2019-2031
- 14.1. Market Analysis, Insights and Forecast - By Country/Sub-region
- 14.1.1 United States
- 14.1.2 Canada
- 14.1.3 Mexico
- 15. MEA 5G Technology Industry Analysis, Insights and Forecast, 2019-2031
- 15.1. Market Analysis, Insights and Forecast - By Country/Sub-region
- 15.1.1 United Arab Emirates
- 15.1.2 Saudi Arabia
- 15.1.3 South Africa
- 15.1.4 Rest of Middle East and Africa
- 16. Competitive Analysis
- 16.1. Global Market Share Analysis 2024
- 16.2. Company Profiles
- 16.2.1 China Telecommunications Corporation
- 16.2.1.1. Overview
- 16.2.1.2. Products
- 16.2.1.3. SWOT Analysis
- 16.2.1.4. Recent Developments
- 16.2.1.5. Financials (Based on Availability)
- 16.2.2 Telstra Corporation Ltd
- 16.2.2.1. Overview
- 16.2.2.2. Products
- 16.2.2.3. SWOT Analysis
- 16.2.2.4. Recent Developments
- 16.2.2.5. Financials (Based on Availability)
- 16.2.3 Verizon Communications Inc
- 16.2.3.1. Overview
- 16.2.3.2. Products
- 16.2.3.3. SWOT Analysis
- 16.2.3.4. Recent Developments
- 16.2.3.5. Financials (Based on Availability)
- 16.2.4 Nippon Telegraph and Telephone
- 16.2.4.1. Overview
- 16.2.4.2. Products
- 16.2.4.3. SWOT Analysis
- 16.2.4.4. Recent Developments
- 16.2.4.5. Financials (Based on Availability)
- 16.2.5 T-Mobile US Inc (Sprint Corporation)
- 16.2.5.1. Overview
- 16.2.5.2. Products
- 16.2.5.3. SWOT Analysis
- 16.2.5.4. Recent Developments
- 16.2.5.5. Financials (Based on Availability)
- 16.2.6 Vodafone Group Plc
- 16.2.6.1. Overview
- 16.2.6.2. Products
- 16.2.6.3. SWOT Analysis
- 16.2.6.4. Recent Developments
- 16.2.6.5. Financials (Based on Availability)
- 16.2.7 IDEMIA
- 16.2.7.1. Overview
- 16.2.7.2. Products
- 16.2.7.3. SWOT Analysis
- 16.2.7.4. Recent Developments
- 16.2.7.5. Financials (Based on Availability)
- 16.2.8 AT&T Inc
- 16.2.8.1. Overview
- 16.2.8.2. Products
- 16.2.8.3. SWOT Analysis
- 16.2.8.4. Recent Developments
- 16.2.8.5. Financials (Based on Availability)
- 16.2.9 Deutsche Telekom
- 16.2.9.1. Overview
- 16.2.9.2. Products
- 16.2.9.3. SWOT Analysis
- 16.2.9.4. Recent Developments
- 16.2.9.5. Financials (Based on Availability)
- 16.2.10 Telefonica SA
- 16.2.10.1. Overview
- 16.2.10.2. Products
- 16.2.10.3. SWOT Analysis
- 16.2.10.4. Recent Developments
- 16.2.10.5. Financials (Based on Availability)
- 16.2.1 China Telecommunications Corporation
List of Figures
- Figure 1: Global 5G Technology Industry Revenue Breakdown (Million, %) by Region 2024 & 2032
- Figure 2: Global 5G Technology Industry Volume Breakdown (K Unit, %) by Region 2024 & 2032
- Figure 3: North America 5G Technology Industry Revenue (Million), by Country 2024 & 2032
- Figure 4: North America 5G Technology Industry Volume (K Unit), by Country 2024 & 2032
- Figure 5: North America 5G Technology Industry Revenue Share (%), by Country 2024 & 2032
- Figure 6: North America 5G Technology Industry Volume Share (%), by Country 2024 & 2032
- Figure 7: Europe 5G Technology Industry Revenue (Million), by Country 2024 & 2032
- Figure 8: Europe 5G Technology Industry Volume (K Unit), by Country 2024 & 2032
- Figure 9: Europe 5G Technology Industry Revenue Share (%), by Country 2024 & 2032
- Figure 10: Europe 5G Technology Industry Volume Share (%), by Country 2024 & 2032
- Figure 11: Asia Pacific 5G Technology Industry Revenue (Million), by Country 2024 & 2032
- Figure 12: Asia Pacific 5G Technology Industry Volume (K Unit), by Country 2024 & 2032
- Figure 13: Asia Pacific 5G Technology Industry Revenue Share (%), by Country 2024 & 2032
- Figure 14: Asia Pacific 5G Technology Industry Volume Share (%), by Country 2024 & 2032
- Figure 15: South America 5G Technology Industry Revenue (Million), by Country 2024 & 2032
- Figure 16: South America 5G Technology Industry Volume (K Unit), by Country 2024 & 2032
- Figure 17: South America 5G Technology Industry Revenue Share (%), by Country 2024 & 2032
- Figure 18: South America 5G Technology Industry Volume Share (%), by Country 2024 & 2032
- Figure 19: North America 5G Technology Industry Revenue (Million), by Country 2024 & 2032
- Figure 20: North America 5G Technology Industry Volume (K Unit), by Country 2024 & 2032
- Figure 21: North America 5G Technology Industry Revenue Share (%), by Country 2024 & 2032
- Figure 22: North America 5G Technology Industry Volume Share (%), by Country 2024 & 2032
- Figure 23: MEA 5G Technology Industry Revenue (Million), by Country 2024 & 2032
- Figure 24: MEA 5G Technology Industry Volume (K Unit), by Country 2024 & 2032
- Figure 25: MEA 5G Technology Industry Revenue Share (%), by Country 2024 & 2032
- Figure 26: MEA 5G Technology Industry Volume Share (%), by Country 2024 & 2032
- Figure 27: North America 5G Technology Industry Revenue (Million), by Connection Type 2024 & 2032
- Figure 28: North America 5G Technology Industry Volume (K Unit), by Connection Type 2024 & 2032
- Figure 29: North America 5G Technology Industry Revenue Share (%), by Connection Type 2024 & 2032
- Figure 30: North America 5G Technology Industry Volume Share (%), by Connection Type 2024 & 2032
- Figure 31: North America 5G Technology Industry Revenue (Million), by Application 2024 & 2032
- Figure 32: North America 5G Technology Industry Volume (K Unit), by Application 2024 & 2032
- Figure 33: North America 5G Technology Industry Revenue Share (%), by Application 2024 & 2032
- Figure 34: North America 5G Technology Industry Volume Share (%), by Application 2024 & 2032
- Figure 35: North America 5G Technology Industry Revenue (Million), by Country 2024 & 2032
- Figure 36: North America 5G Technology Industry Volume (K Unit), by Country 2024 & 2032
- Figure 37: North America 5G Technology Industry Revenue Share (%), by Country 2024 & 2032
- Figure 38: North America 5G Technology Industry Volume Share (%), by Country 2024 & 2032
- Figure 39: Europe 5G Technology Industry Revenue (Million), by Connection Type 2024 & 2032
- Figure 40: Europe 5G Technology Industry Volume (K Unit), by Connection Type 2024 & 2032
- Figure 41: Europe 5G Technology Industry Revenue Share (%), by Connection Type 2024 & 2032
- Figure 42: Europe 5G Technology Industry Volume Share (%), by Connection Type 2024 & 2032
- Figure 43: Europe 5G Technology Industry Revenue (Million), by Application 2024 & 2032
- Figure 44: Europe 5G Technology Industry Volume (K Unit), by Application 2024 & 2032
- Figure 45: Europe 5G Technology Industry Revenue Share (%), by Application 2024 & 2032
- Figure 46: Europe 5G Technology Industry Volume Share (%), by Application 2024 & 2032
- Figure 47: Europe 5G Technology Industry Revenue (Million), by Country 2024 & 2032
- Figure 48: Europe 5G Technology Industry Volume (K Unit), by Country 2024 & 2032
- Figure 49: Europe 5G Technology Industry Revenue Share (%), by Country 2024 & 2032
- Figure 50: Europe 5G Technology Industry Volume Share (%), by Country 2024 & 2032
- Figure 51: Asia Pacific 5G Technology Industry Revenue (Million), by Connection Type 2024 & 2032
- Figure 52: Asia Pacific 5G Technology Industry Volume (K Unit), by Connection Type 2024 & 2032
- Figure 53: Asia Pacific 5G Technology Industry Revenue Share (%), by Connection Type 2024 & 2032
- Figure 54: Asia Pacific 5G Technology Industry Volume Share (%), by Connection Type 2024 & 2032
- Figure 55: Asia Pacific 5G Technology Industry Revenue (Million), by Application 2024 & 2032
- Figure 56: Asia Pacific 5G Technology Industry Volume (K Unit), by Application 2024 & 2032
- Figure 57: Asia Pacific 5G Technology Industry Revenue Share (%), by Application 2024 & 2032
- Figure 58: Asia Pacific 5G Technology Industry Volume Share (%), by Application 2024 & 2032
- Figure 59: Asia Pacific 5G Technology Industry Revenue (Million), by Country 2024 & 2032
- Figure 60: Asia Pacific 5G Technology Industry Volume (K Unit), by Country 2024 & 2032
- Figure 61: Asia Pacific 5G Technology Industry Revenue Share (%), by Country 2024 & 2032
- Figure 62: Asia Pacific 5G Technology Industry Volume Share (%), by Country 2024 & 2032
- Figure 63: Rest of the World 5G Technology Industry Revenue (Million), by Connection Type 2024 & 2032
- Figure 64: Rest of the World 5G Technology Industry Volume (K Unit), by Connection Type 2024 & 2032
- Figure 65: Rest of the World 5G Technology Industry Revenue Share (%), by Connection Type 2024 & 2032
- Figure 66: Rest of the World 5G Technology Industry Volume Share (%), by Connection Type 2024 & 2032
- Figure 67: Rest of the World 5G Technology Industry Revenue (Million), by Application 2024 & 2032
- Figure 68: Rest of the World 5G Technology Industry Volume (K Unit), by Application 2024 & 2032
- Figure 69: Rest of the World 5G Technology Industry Revenue Share (%), by Application 2024 & 2032
- Figure 70: Rest of the World 5G Technology Industry Volume Share (%), by Application 2024 & 2032
- Figure 71: Rest of the World 5G Technology Industry Revenue (Million), by Country 2024 & 2032
- Figure 72: Rest of the World 5G Technology Industry Volume (K Unit), by Country 2024 & 2032
- Figure 73: Rest of the World 5G Technology Industry Revenue Share (%), by Country 2024 & 2032
- Figure 74: Rest of the World 5G Technology Industry Volume Share (%), by Country 2024 & 2032
List of Tables
- Table 1: Global 5G Technology Industry Revenue Million Forecast, by Region 2019 & 2032
- Table 2: Global 5G Technology Industry Volume K Unit Forecast, by Region 2019 & 2032
- Table 3: Global 5G Technology Industry Revenue Million Forecast, by Connection Type 2019 & 2032
- Table 4: Global 5G Technology Industry Volume K Unit Forecast, by Connection Type 2019 & 2032
- Table 5: Global 5G Technology Industry Revenue Million Forecast, by Application 2019 & 2032
- Table 6: Global 5G Technology Industry Volume K Unit Forecast, by Application 2019 & 2032
- Table 7: Global 5G Technology Industry Revenue Million Forecast, by Region 2019 & 2032
- Table 8: Global 5G Technology Industry Volume K Unit Forecast, by Region 2019 & 2032
- Table 9: Global 5G Technology Industry Revenue Million Forecast, by Country 2019 & 2032
- Table 10: Global 5G Technology Industry Volume K Unit Forecast, by Country 2019 & 2032
- Table 11: United States 5G Technology Industry Revenue (Million) Forecast, by Application 2019 & 2032
- Table 12: United States 5G Technology Industry Volume (K Unit) Forecast, by Application 2019 & 2032
- Table 13: Canada 5G Technology Industry Revenue (Million) Forecast, by Application 2019 & 2032
- Table 14: Canada 5G Technology Industry Volume (K Unit) Forecast, by Application 2019 & 2032
- Table 15: Mexico 5G Technology Industry Revenue (Million) Forecast, by Application 2019 & 2032
- Table 16: Mexico 5G Technology Industry Volume (K Unit) Forecast, by Application 2019 & 2032
- Table 17: Global 5G Technology Industry Revenue Million Forecast, by Country 2019 & 2032
- Table 18: Global 5G Technology Industry Volume K Unit Forecast, by Country 2019 & 2032
- Table 19: Germany 5G Technology Industry Revenue (Million) Forecast, by Application 2019 & 2032
- Table 20: Germany 5G Technology Industry Volume (K Unit) Forecast, by Application 2019 & 2032
- Table 21: United Kingdom 5G Technology Industry Revenue (Million) Forecast, by Application 2019 & 2032
- Table 22: United Kingdom 5G Technology Industry Volume (K Unit) Forecast, by Application 2019 & 2032
- Table 23: France 5G Technology Industry Revenue (Million) Forecast, by Application 2019 & 2032
- Table 24: France 5G Technology Industry Volume (K Unit) Forecast, by Application 2019 & 2032
- Table 25: Spain 5G Technology Industry Revenue (Million) Forecast, by Application 2019 & 2032
- Table 26: Spain 5G Technology Industry Volume (K Unit) Forecast, by Application 2019 & 2032
- Table 27: Italy 5G Technology Industry Revenue (Million) Forecast, by Application 2019 & 2032
- Table 28: Italy 5G Technology Industry Volume (K Unit) Forecast, by Application 2019 & 2032
- Table 29: Spain 5G Technology Industry Revenue (Million) Forecast, by Application 2019 & 2032
- Table 30: Spain 5G Technology Industry Volume (K Unit) Forecast, by Application 2019 & 2032
- Table 31: Belgium 5G Technology Industry Revenue (Million) Forecast, by Application 2019 & 2032
- Table 32: Belgium 5G Technology Industry Volume (K Unit) Forecast, by Application 2019 & 2032
- Table 33: Netherland 5G Technology Industry Revenue (Million) Forecast, by Application 2019 & 2032
- Table 34: Netherland 5G Technology Industry Volume (K Unit) Forecast, by Application 2019 & 2032
- Table 35: Nordics 5G Technology Industry Revenue (Million) Forecast, by Application 2019 & 2032
- Table 36: Nordics 5G Technology Industry Volume (K Unit) Forecast, by Application 2019 & 2032
- Table 37: Rest of Europe 5G Technology Industry Revenue (Million) Forecast, by Application 2019 & 2032
- Table 38: Rest of Europe 5G Technology Industry Volume (K Unit) Forecast, by Application 2019 & 2032
- Table 39: Global 5G Technology Industry Revenue Million Forecast, by Country 2019 & 2032
- Table 40: Global 5G Technology Industry Volume K Unit Forecast, by Country 2019 & 2032
- Table 41: China 5G Technology Industry Revenue (Million) Forecast, by Application 2019 & 2032
- Table 42: China 5G Technology Industry Volume (K Unit) Forecast, by Application 2019 & 2032
- Table 43: Japan 5G Technology Industry Revenue (Million) Forecast, by Application 2019 & 2032
- Table 44: Japan 5G Technology Industry Volume (K Unit) Forecast, by Application 2019 & 2032
- Table 45: India 5G Technology Industry Revenue (Million) Forecast, by Application 2019 & 2032
- Table 46: India 5G Technology Industry Volume (K Unit) Forecast, by Application 2019 & 2032
- Table 47: South Korea 5G Technology Industry Revenue (Million) Forecast, by Application 2019 & 2032
- Table 48: South Korea 5G Technology Industry Volume (K Unit) Forecast, by Application 2019 & 2032
- Table 49: Southeast Asia 5G Technology Industry Revenue (Million) Forecast, by Application 2019 & 2032
- Table 50: Southeast Asia 5G Technology Industry Volume (K Unit) Forecast, by Application 2019 & 2032
- Table 51: Australia 5G Technology Industry Revenue (Million) Forecast, by Application 2019 & 2032
- Table 52: Australia 5G Technology Industry Volume (K Unit) Forecast, by Application 2019 & 2032
- Table 53: Indonesia 5G Technology Industry Revenue (Million) Forecast, by Application 2019 & 2032
- Table 54: Indonesia 5G Technology Industry Volume (K Unit) Forecast, by Application 2019 & 2032
- Table 55: Phillipes 5G Technology Industry Revenue (Million) Forecast, by Application 2019 & 2032
- Table 56: Phillipes 5G Technology Industry Volume (K Unit) Forecast, by Application 2019 & 2032
- Table 57: Singapore 5G Technology Industry Revenue (Million) Forecast, by Application 2019 & 2032
- Table 58: Singapore 5G Technology Industry Volume (K Unit) Forecast, by Application 2019 & 2032
- Table 59: Thailandc 5G Technology Industry Revenue (Million) Forecast, by Application 2019 & 2032
- Table 60: Thailandc 5G Technology Industry Volume (K Unit) Forecast, by Application 2019 & 2032
- Table 61: Rest of Asia Pacific 5G Technology Industry Revenue (Million) Forecast, by Application 2019 & 2032
- Table 62: Rest of Asia Pacific 5G Technology Industry Volume (K Unit) Forecast, by Application 2019 & 2032
- Table 63: Global 5G Technology Industry Revenue Million Forecast, by Country 2019 & 2032
- Table 64: Global 5G Technology Industry Volume K Unit Forecast, by Country 2019 & 2032
- Table 65: Brazil 5G Technology Industry Revenue (Million) Forecast, by Application 2019 & 2032
- Table 66: Brazil 5G Technology Industry Volume (K Unit) Forecast, by Application 2019 & 2032
- Table 67: Argentina 5G Technology Industry Revenue (Million) Forecast, by Application 2019 & 2032
- Table 68: Argentina 5G Technology Industry Volume (K Unit) Forecast, by Application 2019 & 2032
- Table 69: Peru 5G Technology Industry Revenue (Million) Forecast, by Application 2019 & 2032
- Table 70: Peru 5G Technology Industry Volume (K Unit) Forecast, by Application 2019 & 2032
- Table 71: Chile 5G Technology Industry Revenue (Million) Forecast, by Application 2019 & 2032
- Table 72: Chile 5G Technology Industry Volume (K Unit) Forecast, by Application 2019 & 2032
- Table 73: Colombia 5G Technology Industry Revenue (Million) Forecast, by Application 2019 & 2032
- Table 74: Colombia 5G Technology Industry Volume (K Unit) Forecast, by Application 2019 & 2032
- Table 75: Ecuador 5G Technology Industry Revenue (Million) Forecast, by Application 2019 & 2032
- Table 76: Ecuador 5G Technology Industry Volume (K Unit) Forecast, by Application 2019 & 2032
- Table 77: Venezuela 5G Technology Industry Revenue (Million) Forecast, by Application 2019 & 2032
- Table 78: Venezuela 5G Technology Industry Volume (K Unit) Forecast, by Application 2019 & 2032
- Table 79: Rest of South America 5G Technology Industry Revenue (Million) Forecast, by Application 2019 & 2032
- Table 80: Rest of South America 5G Technology Industry Volume (K Unit) Forecast, by Application 2019 & 2032
- Table 81: Global 5G Technology Industry Revenue Million Forecast, by Country 2019 & 2032
- Table 82: Global 5G Technology Industry Volume K Unit Forecast, by Country 2019 & 2032
- Table 83: United States 5G Technology Industry Revenue (Million) Forecast, by Application 2019 & 2032
- Table 84: United States 5G Technology Industry Volume (K Unit) Forecast, by Application 2019 & 2032
- Table 85: Canada 5G Technology Industry Revenue (Million) Forecast, by Application 2019 & 2032
- Table 86: Canada 5G Technology Industry Volume (K Unit) Forecast, by Application 2019 & 2032
- Table 87: Mexico 5G Technology Industry Revenue (Million) Forecast, by Application 2019 & 2032
- Table 88: Mexico 5G Technology Industry Volume (K Unit) Forecast, by Application 2019 & 2032
- Table 89: Global 5G Technology Industry Revenue Million Forecast, by Country 2019 & 2032
- Table 90: Global 5G Technology Industry Volume K Unit Forecast, by Country 2019 & 2032
- Table 91: United Arab Emirates 5G Technology Industry Revenue (Million) Forecast, by Application 2019 & 2032
- Table 92: United Arab Emirates 5G Technology Industry Volume (K Unit) Forecast, by Application 2019 & 2032
- Table 93: Saudi Arabia 5G Technology Industry Revenue (Million) Forecast, by Application 2019 & 2032
- Table 94: Saudi Arabia 5G Technology Industry Volume (K Unit) Forecast, by Application 2019 & 2032
- Table 95: South Africa 5G Technology Industry Revenue (Million) Forecast, by Application 2019 & 2032
- Table 96: South Africa 5G Technology Industry Volume (K Unit) Forecast, by Application 2019 & 2032
- Table 97: Rest of Middle East and Africa 5G Technology Industry Revenue (Million) Forecast, by Application 2019 & 2032
- Table 98: Rest of Middle East and Africa 5G Technology Industry Volume (K Unit) Forecast, by Application 2019 & 2032
- Table 99: Global 5G Technology Industry Revenue Million Forecast, by Connection Type 2019 & 2032
- Table 100: Global 5G Technology Industry Volume K Unit Forecast, by Connection Type 2019 & 2032
- Table 101: Global 5G Technology Industry Revenue Million Forecast, by Application 2019 & 2032
- Table 102: Global 5G Technology Industry Volume K Unit Forecast, by Application 2019 & 2032
- Table 103: Global 5G Technology Industry Revenue Million Forecast, by Country 2019 & 2032
- Table 104: Global 5G Technology Industry Volume K Unit Forecast, by Country 2019 & 2032
- Table 105: United States 5G Technology Industry Revenue (Million) Forecast, by Application 2019 & 2032
- Table 106: United States 5G Technology Industry Volume (K Unit) Forecast, by Application 2019 & 2032
- Table 107: Canada 5G Technology Industry Revenue (Million) Forecast, by Application 2019 & 2032
- Table 108: Canada 5G Technology Industry Volume (K Unit) Forecast, by Application 2019 & 2032
- Table 109: Global 5G Technology Industry Revenue Million Forecast, by Connection Type 2019 & 2032
- Table 110: Global 5G Technology Industry Volume K Unit Forecast, by Connection Type 2019 & 2032
- Table 111: Global 5G Technology Industry Revenue Million Forecast, by Application 2019 & 2032
- Table 112: Global 5G Technology Industry Volume K Unit Forecast, by Application 2019 & 2032
- Table 113: Global 5G Technology Industry Revenue Million Forecast, by Country 2019 & 2032
- Table 114: Global 5G Technology Industry Volume K Unit Forecast, by Country 2019 & 2032
- Table 115: Germany 5G Technology Industry Revenue (Million) Forecast, by Application 2019 & 2032
- Table 116: Germany 5G Technology Industry Volume (K Unit) Forecast, by Application 2019 & 2032
- Table 117: France 5G Technology Industry Revenue (Million) Forecast, by Application 2019 & 2032
- Table 118: France 5G Technology Industry Volume (K Unit) Forecast, by Application 2019 & 2032
- Table 119: United Kingdom 5G Technology Industry Revenue (Million) Forecast, by Application 2019 & 2032
- Table 120: United Kingdom 5G Technology Industry Volume (K Unit) Forecast, by Application 2019 & 2032
- Table 121: Rest of Europe 5G Technology Industry Revenue (Million) Forecast, by Application 2019 & 2032
- Table 122: Rest of Europe 5G Technology Industry Volume (K Unit) Forecast, by Application 2019 & 2032
- Table 123: Global 5G Technology Industry Revenue Million Forecast, by Connection Type 2019 & 2032
- Table 124: Global 5G Technology Industry Volume K Unit Forecast, by Connection Type 2019 & 2032
- Table 125: Global 5G Technology Industry Revenue Million Forecast, by Application 2019 & 2032
- Table 126: Global 5G Technology Industry Volume K Unit Forecast, by Application 2019 & 2032
- Table 127: Global 5G Technology Industry Revenue Million Forecast, by Country 2019 & 2032
- Table 128: Global 5G Technology Industry Volume K Unit Forecast, by Country 2019 & 2032
- Table 129: India 5G Technology Industry Revenue (Million) Forecast, by Application 2019 & 2032
- Table 130: India 5G Technology Industry Volume (K Unit) Forecast, by Application 2019 & 2032
- Table 131: China 5G Technology Industry Revenue (Million) Forecast, by Application 2019 & 2032
- Table 132: China 5G Technology Industry Volume (K Unit) Forecast, by Application 2019 & 2032
- Table 133: Japan 5G Technology Industry Revenue (Million) Forecast, by Application 2019 & 2032
- Table 134: Japan 5G Technology Industry Volume (K Unit) Forecast, by Application 2019 & 2032
- Table 135: Rest of Asia Pacific 5G Technology Industry Revenue (Million) Forecast, by Application 2019 & 2032
- Table 136: Rest of Asia Pacific 5G Technology Industry Volume (K Unit) Forecast, by Application 2019 & 2032
- Table 137: Global 5G Technology Industry Revenue Million Forecast, by Connection Type 2019 & 2032
- Table 138: Global 5G Technology Industry Volume K Unit Forecast, by Connection Type 2019 & 2032
- Table 139: Global 5G Technology Industry Revenue Million Forecast, by Application 2019 & 2032
- Table 140: Global 5G Technology Industry Volume K Unit Forecast, by Application 2019 & 2032
- Table 141: Global 5G Technology Industry Revenue Million Forecast, by Country 2019 & 2032
- Table 142: Global 5G Technology Industry Volume K Unit Forecast, by Country 2019 & 2032
Frequently Asked Questions
1. What is the projected Compound Annual Growth Rate (CAGR) of the 5G Technology Industry?
The projected CAGR is approximately 56.16%.
2. Which companies are prominent players in the 5G Technology Industry?
Key companies in the market include China Telecommunications Corporation, Telstra Corporation Ltd, Verizon Communications Inc, Nippon Telegraph and Telephone, T-Mobile US Inc (Sprint Corporation), Vodafone Group Plc, IDEMIA, AT&T Inc, Deutsche Telekom, Telefonica SA.
3. What are the main segments of the 5G Technology Industry?
The market segments include Connection Type, Application .
4. Can you provide details about the market size?
The market size is estimated to be USD XX Million as of 2022.
5. What are some drivers contributing to market growth?
Increase in Demand for Wireless Broadband Services Needing Faster. Higher-Capacity Networks.
6. What are the notable trends driving market growth?
M2M Connectivity Expected to Witness Significant Growth.
7. Are there any restraints impacting market growth?
Availability of Limited Spectrum.
8. Can you provide examples of recent developments in the market?
Jan 2023: 5G connected ambulances were developed and tested by Bharti Airtel in partnership with Apollo Hospitals. Under this partnership, a 5 G-driven Artificial Intelligence (AI) guided Colonoscopy trial was carried out. HealthNet Global, AWS, and Avesha provided their technical expertise and resources to Airtel's ultra-low latency 5G technology to detect colon cancer at a faster rate and with greater accuracy.
9. What pricing options are available for accessing the report?
Pricing options include single-user, multi-user, and enterprise licenses priced at USD 4750, USD 5250, and USD 8750 respectively.
10. Is the market size provided in terms of value or volume?
The market size is provided in terms of value, measured in Million and volume, measured in K Unit.
11. Are there any specific market keywords associated with the report?
Yes, the market keyword associated with the report is "5G Technology Industry," which aids in identifying and referencing the specific market segment covered.
12. How do I determine which pricing option suits my needs best?
The pricing options vary based on user requirements and access needs. Individual users may opt for single-user licenses, while businesses requiring broader access may choose multi-user or enterprise licenses for cost-effective access to the report.
13. Are there any additional resources or data provided in the 5G Technology Industry report?
While the report offers comprehensive insights, it's advisable to review the specific contents or supplementary materials provided to ascertain if additional resources or data are available.
14. How can I stay updated on further developments or reports in the 5G Technology Industry?
To stay informed about further developments, trends, and reports in the 5G Technology Industry, consider subscribing to industry newsletters, following relevant companies and organizations, or regularly checking reputable industry news sources and publications.
Methodology
Step 1 - Identification of Relevant Samples Size from Population Database


Step 2 - Approaches for Defining Global Market Size (Value, Volume* & Price*)

Note*: In applicable scenarios
Step 3 - Data Sources
Primary Research
- Web Analytics
- Survey Reports
- Research Institute
- Latest Research Reports
- Opinion Leaders
Secondary Research
- Annual Reports
- White Paper
- Latest Press Release
- Industry Association
- Paid Database
- Investor Presentations

Step 4 - Data Triangulation
Involves using different sources of information in order to increase the validity of a study
These sources are likely to be stakeholders in a program - participants, other researchers, program staff, other community members, and so on.
Then we put all data in single framework & apply various statistical tools to find out the dynamic on the market.
During the analysis stage, feedback from the stakeholder groups would be compared to determine areas of agreement as well as areas of divergence
