

Key Insights
The global activated carbon fiber (ACF) market, valued at $414.13 million in 2025, is projected to experience steady growth, driven by increasing demand across diverse sectors. The Compound Annual Growth Rate (CAGR) of 3.71% from 2025 to 2033 signifies a consistent expansion, primarily fueled by the rising adoption of ACF in water purification and environmental remediation applications. The burgeoning renewable energy sector, particularly supercapacitors and energy storage systems, is another significant driver, demanding high-performance ACF materials for enhanced energy density and longer lifespan. Growth in the medical industry, utilizing ACF in drug delivery and medical device applications, further contributes to market expansion. While the raw material segment is dominated by synthetic ACF due to its cost-effectiveness and tailored properties, the natural ACF segment is witnessing growth driven by sustainability concerns and increasing preference for eco-friendly materials. Geographic distribution shows a strong presence in Asia-Pacific, particularly in China and Japan, owing to established manufacturing capabilities and significant downstream demand. North America and Europe also contribute substantially, driven by stringent environmental regulations and technological advancements in the region. However, fluctuating raw material prices and potential competition from alternative materials represent potential restraints on market growth. Technological advancements focusing on enhancing ACF properties such as surface area, porosity, and conductivity are expected to shape future market trends.
The competitive landscape is moderately fragmented, with both large multinational corporations and smaller specialized companies vying for market share. Key players are strategically focusing on R&D to improve ACF performance and explore new applications. Strategic partnerships and mergers & acquisitions are also anticipated to influence the market dynamics. The forecast period, 2025-2033, promises further market expansion, fueled by ongoing technological advancements and the growing adoption of ACF across diverse industry verticals. The market's growth trajectory hinges on overcoming challenges related to production costs, ensuring a sustainable supply of raw materials, and catering to evolving industry-specific demands. Market players must emphasize innovation and strategic collaborations to maintain competitiveness and capitalize on emerging market opportunities.
This comprehensive report provides an in-depth analysis of the Activated Carbon Fiber (ACF) industry, encompassing market dynamics, growth trends, regional analysis, competitive landscape, and future outlook. The study period spans from 2019 to 2033, with 2025 serving as the base and estimated year. This report is invaluable for industry professionals, investors, and researchers seeking a clear understanding of this rapidly evolving market. The total market size in 2025 is estimated at xx Million.

Activated Carbon Fiber Industry Market Dynamics & Structure
The global Activated Carbon Fiber industry, valued at xx Million in 2025, exhibits a moderately concentrated market structure. Key players, including Jiangsu Tongkang Activated Carbon Fiber Co Ltd, Nantong Yongtong Environmental Technology Co Ltd, Kuraray Co Ltd, and others (see complete list in Key Players section), compete based on product quality, innovation, and pricing strategies. Technological advancements, primarily focused on enhancing adsorption capacity and durability, are driving market growth. Stringent environmental regulations, particularly regarding water and air purification, are creating significant demand for ACF. The industry faces competition from alternative filtration technologies, but ACF's superior performance in specific applications maintains its strong market position. Mergers and acquisitions (M&A) activity within the industry remains moderate, with xx deals recorded in the past five years, primarily focused on consolidating market share and expanding geographical reach.
- Market Concentration: Moderately concentrated, with top 5 players holding approximately xx% market share in 2025.
- Technological Innovation: Focus on enhancing adsorption capacity, chemical stability, and manufacturing efficiency.
- Regulatory Framework: Stringent environmental regulations are a key growth driver.
- Competitive Substitutes: Activated alumina, zeolites, and other adsorbents pose some competition.
- End-User Demographics: Primarily industrial users (water treatment, chemical processing), with growing medical and energy storage applications.
- M&A Trends: Moderate activity, focused on market consolidation and expansion.
Activated Carbon Fiber Industry Growth Trends & Insights
The Activated Carbon Fiber industry has witnessed robust growth over the past five years (2019-2024), exhibiting a Compound Annual Growth Rate (CAGR) of xx%. This growth is primarily fueled by increasing industrial demand for water purification and air pollution control, coupled with the rising adoption of ACF in emerging applications like supercapacitors and protective clothing. Technological advancements, leading to improved product performance and cost-effectiveness, have further boosted market penetration. Consumer behavior shifts towards environmentally conscious products are also contributing positively to market expansion. We project a CAGR of xx% from 2025 to 2033, driven by expanding applications in diverse sectors and increasing government support for clean technologies. Market penetration is expected to reach xx% by 2033.

Dominant Regions, Countries, or Segments in Activated Carbon Fiber Industry
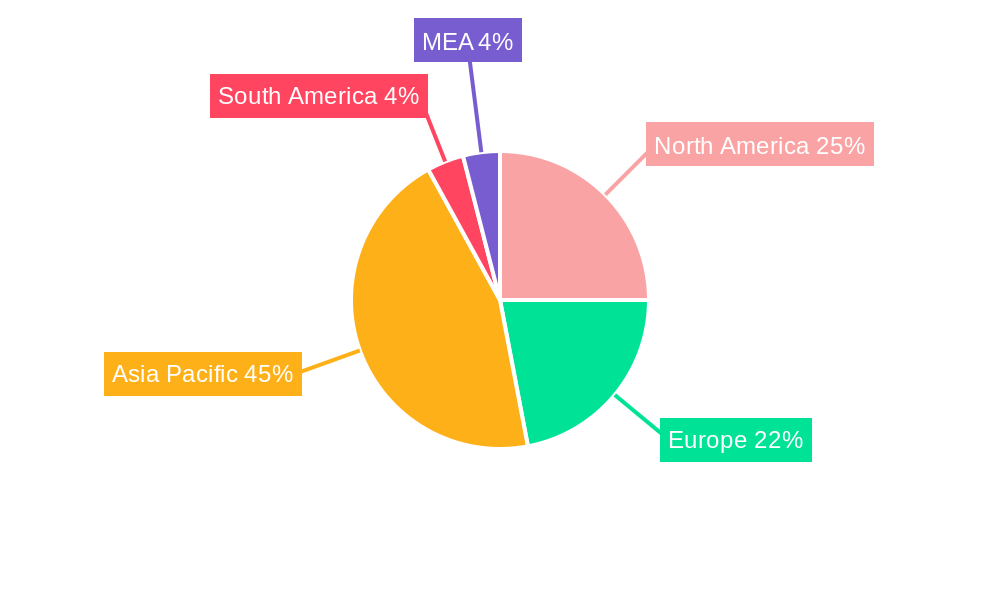
The Asia-Pacific region, particularly China and Japan, dominates the global ACF market, accounting for xx% of the total market share in 2025. This dominance is driven by robust industrial growth, significant government investment in clean technologies, and a large manufacturing base. The purification application segment holds the largest market share (xx%), followed by chemical separation and catalysis (xx%).
- Key Drivers in Asia-Pacific: Rapid industrialization, supportive government policies, and a well-established manufacturing sector.
- Purification Segment Dominance: Driven by the burgeoning need for clean water and air in both developed and developing nations.
- Growth Potential: Significant opportunities exist in North America and Europe, driven by increasing environmental regulations and technological advancements.
Activated Carbon Fiber Industry Product Landscape
The ACF market offers a range of products tailored to various applications. Recent innovations include high-surface area fibers with enhanced adsorption capabilities and improved chemical resistance. The industry is focused on developing more efficient and sustainable manufacturing processes to reduce costs and improve environmental performance. Unique selling propositions include superior adsorption capacity, high selectivity, and recyclability, making ACF a cost-effective solution in several industries.
Key Drivers, Barriers & Challenges in Activated Carbon Fiber Industry
Key Drivers:
- Increasing environmental regulations and pollution control measures.
- Growing demand for advanced filtration and separation technologies.
- Rise in the adoption of ACF in supercapacitors and energy storage devices.
- Technological advancements leading to improved product performance and reduced costs.
Key Challenges and Restraints:
- Fluctuations in raw material prices (e.g., carbon sources).
- High manufacturing costs compared to alternative filtration technologies.
- Competition from established players and emerging technologies.
- Potential supply chain disruptions impacting the availability of raw materials.
Emerging Opportunities in Activated Carbon Fiber Industry
- Expanding applications in emerging markets like water treatment in developing countries.
- Growing demand for ACF in advanced biomedical applications (drug delivery, wound healing).
- Development of novel ACF-based materials for specialized applications (e.g., gas separation, sensors).
- Integration of ACF with other advanced technologies for enhanced performance.
Growth Accelerators in the Activated Carbon Fiber Industry Industry
Long-term growth will be propelled by several factors, including technological breakthroughs in enhancing ACF's adsorption capacity and creating new applications. Strategic partnerships between ACF manufacturers and end-users in diverse sectors will facilitate market expansion. Government initiatives promoting sustainable technologies and investments in R&D will also play a significant role in accelerating market growth.
Key Players Shaping the Activated Carbon Fiber Industry Market
- Kuraray Co Ltd
- Jiangsu Tongkang Activated Carbon Fiber Co Ltd
- Nantong Yongtong Environmental Technology Co Ltd
- Hangzhou Nature Technology Co Ltd (Nature Carbon)
- Anshan Sinocarb Carbon Fibers Co Ltd
- Unitika LTD
- China Beihai Fiberglass Co Ltd
- Toyobo Co Ltd
- Osaka Gas Chemicals Co Ltd
- Evertech Envisafe Ecology Co Ltd
- HPMS Graphite
Notable Milestones in Activated Carbon Fiber Industry Sector
- 2022-Q3: Kuraray Co Ltd launched a new ACF product with enhanced adsorption capacity for water purification.
- 2021-Q4: A significant merger took place between two major ACF manufacturers in China, leading to increased market consolidation.
- 2020-Q1: A new government initiative in Japan provided funding for R&D in advanced ACF materials. (Further milestones to be added based on available data)
In-Depth Activated Carbon Fiber Industry Market Outlook
The future of the ACF market is promising, with continued growth expected over the next decade. Strategic investments in R&D, coupled with expanding applications across diverse industries, will drive market expansion. The focus on sustainable and eco-friendly technologies will further enhance ACF's appeal. Emerging markets represent significant growth opportunities, and collaborations between key players will accelerate innovation and market penetration.
Activated Carbon Fiber Industry Segmentation
-
1. Raw Material
- 1.1. Natural
-
1.2. Synthetic
- 1.2.1. Pitch-based
- 1.2.2. Pan-based
- 1.2.3. Phenolic-based
- 1.2.4. Viscose-based
- 1.2.5. Other Materials
-
2. Application
- 2.1. Purification
- 2.2. Chemical Separation and Catalysis
- 2.3. Protective Clothing
- 2.4. Medical
- 2.5. Super Capacitors
- 2.6. Other Applications
Activated Carbon Fiber Industry Segmentation By Geography
-
1. Asia Pacific
- 1.1. China
- 1.2. India
- 1.3. Japan
- 1.4. South Korea
- 1.5. Rest of Asia Pacific
-
2. North America
- 2.1. United States
- 2.2. Mexico
- 2.3. Canada
-
3. Europe
- 3.1. Germany
- 3.2. United Kingdom
- 3.3. France
- 3.4. Italy
- 3.5. Rest of Europe
- 4. Middle East
-
5. Saudi Arabia
- 5.1. South Africa
- 5.2. Rest of Middle East
Activated Carbon Fiber Industry REPORT HIGHLIGHTS
| Aspects | Details |
|---|---|
| Study Period | 2019-2033 |
| Base Year | 2024 |
| Estimated Year | 2025 |
| Forecast Period | 2025-2033 |
| Historical Period | 2019-2024 |
| Growth Rate | CAGR of 3.71% from 2019-2033 |
| Segmentation |
|
Table of Contents
- 1. Introduction
- 1.1. Research Scope
- 1.2. Market Segmentation
- 1.3. Research Methodology
- 1.4. Definitions and Assumptions
- 2. Executive Summary
- 2.1. Introduction
- 3. Market Dynamics
- 3.1. Introduction
- 3.2. Market Drivers
- 3.2.1. Increasing Environmental Concerns Related to Air and Water Pollution; Superior Properties of Activated Carbon Fiber
- 3.3. Market Restrains
- 3.3.1. Concerns Related to Raw Materials
- 3.4. Market Trends
- 3.4.1. Increasing Demand from the Purification Industry
- 4. Market Factor Analysis
- 4.1. Porters Five Forces
- 4.2. Supply/Value Chain
- 4.3. PESTEL analysis
- 4.4. Market Entropy
- 4.5. Patent/Trademark Analysis
- 5. Global Activated Carbon Fiber Industry Analysis, Insights and Forecast, 2019-2031
- 5.1. Market Analysis, Insights and Forecast - by Raw Material
- 5.1.1. Natural
- 5.1.2. Synthetic
- 5.1.2.1. Pitch-based
- 5.1.2.2. Pan-based
- 5.1.2.3. Phenolic-based
- 5.1.2.4. Viscose-based
- 5.1.2.5. Other Materials
- 5.2. Market Analysis, Insights and Forecast - by Application
- 5.2.1. Purification
- 5.2.2. Chemical Separation and Catalysis
- 5.2.3. Protective Clothing
- 5.2.4. Medical
- 5.2.5. Super Capacitors
- 5.2.6. Other Applications
- 5.3. Market Analysis, Insights and Forecast - by Region
- 5.3.1. Asia Pacific
- 5.3.2. North America
- 5.3.3. Europe
- 5.3.4. Middle East
- 5.3.5. Saudi Arabia
- 5.1. Market Analysis, Insights and Forecast - by Raw Material
- 6. Asia Pacific Activated Carbon Fiber Industry Analysis, Insights and Forecast, 2019-2031
- 6.1. Market Analysis, Insights and Forecast - by Raw Material
- 6.1.1. Natural
- 6.1.2. Synthetic
- 6.1.2.1. Pitch-based
- 6.1.2.2. Pan-based
- 6.1.2.3. Phenolic-based
- 6.1.2.4. Viscose-based
- 6.1.2.5. Other Materials
- 6.2. Market Analysis, Insights and Forecast - by Application
- 6.2.1. Purification
- 6.2.2. Chemical Separation and Catalysis
- 6.2.3. Protective Clothing
- 6.2.4. Medical
- 6.2.5. Super Capacitors
- 6.2.6. Other Applications
- 6.1. Market Analysis, Insights and Forecast - by Raw Material
- 7. North America Activated Carbon Fiber Industry Analysis, Insights and Forecast, 2019-2031
- 7.1. Market Analysis, Insights and Forecast - by Raw Material
- 7.1.1. Natural
- 7.1.2. Synthetic
- 7.1.2.1. Pitch-based
- 7.1.2.2. Pan-based
- 7.1.2.3. Phenolic-based
- 7.1.2.4. Viscose-based
- 7.1.2.5. Other Materials
- 7.2. Market Analysis, Insights and Forecast - by Application
- 7.2.1. Purification
- 7.2.2. Chemical Separation and Catalysis
- 7.2.3. Protective Clothing
- 7.2.4. Medical
- 7.2.5. Super Capacitors
- 7.2.6. Other Applications
- 7.1. Market Analysis, Insights and Forecast - by Raw Material
- 8. Europe Activated Carbon Fiber Industry Analysis, Insights and Forecast, 2019-2031
- 8.1. Market Analysis, Insights and Forecast - by Raw Material
- 8.1.1. Natural
- 8.1.2. Synthetic
- 8.1.2.1. Pitch-based
- 8.1.2.2. Pan-based
- 8.1.2.3. Phenolic-based
- 8.1.2.4. Viscose-based
- 8.1.2.5. Other Materials
- 8.2. Market Analysis, Insights and Forecast - by Application
- 8.2.1. Purification
- 8.2.2. Chemical Separation and Catalysis
- 8.2.3. Protective Clothing
- 8.2.4. Medical
- 8.2.5. Super Capacitors
- 8.2.6. Other Applications
- 8.1. Market Analysis, Insights and Forecast - by Raw Material
- 9. Middle East Activated Carbon Fiber Industry Analysis, Insights and Forecast, 2019-2031
- 9.1. Market Analysis, Insights and Forecast - by Raw Material
- 9.1.1. Natural
- 9.1.2. Synthetic
- 9.1.2.1. Pitch-based
- 9.1.2.2. Pan-based
- 9.1.2.3. Phenolic-based
- 9.1.2.4. Viscose-based
- 9.1.2.5. Other Materials
- 9.2. Market Analysis, Insights and Forecast - by Application
- 9.2.1. Purification
- 9.2.2. Chemical Separation and Catalysis
- 9.2.3. Protective Clothing
- 9.2.4. Medical
- 9.2.5. Super Capacitors
- 9.2.6. Other Applications
- 9.1. Market Analysis, Insights and Forecast - by Raw Material
- 10. Saudi Arabia Activated Carbon Fiber Industry Analysis, Insights and Forecast, 2019-2031
- 10.1. Market Analysis, Insights and Forecast - by Raw Material
- 10.1.1. Natural
- 10.1.2. Synthetic
- 10.1.2.1. Pitch-based
- 10.1.2.2. Pan-based
- 10.1.2.3. Phenolic-based
- 10.1.2.4. Viscose-based
- 10.1.2.5. Other Materials
- 10.2. Market Analysis, Insights and Forecast - by Application
- 10.2.1. Purification
- 10.2.2. Chemical Separation and Catalysis
- 10.2.3. Protective Clothing
- 10.2.4. Medical
- 10.2.5. Super Capacitors
- 10.2.6. Other Applications
- 10.1. Market Analysis, Insights and Forecast - by Raw Material
- 11. North America Activated Carbon Fiber Industry Analysis, Insights and Forecast, 2019-2031
- 11.1. Market Analysis, Insights and Forecast - By Country/Sub-region
- 11.1.1 United States
- 11.1.2 Canada
- 11.1.3 Mexico
- 12. Europe Activated Carbon Fiber Industry Analysis, Insights and Forecast, 2019-2031
- 12.1. Market Analysis, Insights and Forecast - By Country/Sub-region
- 12.1.1 Germany
- 12.1.2 United Kingdom
- 12.1.3 France
- 12.1.4 Spain
- 12.1.5 Italy
- 12.1.6 Spain
- 12.1.7 Belgium
- 12.1.8 Netherland
- 12.1.9 Nordics
- 12.1.10 Rest of Europe
- 13. Asia Pacific Activated Carbon Fiber Industry Analysis, Insights and Forecast, 2019-2031
- 13.1. Market Analysis, Insights and Forecast - By Country/Sub-region
- 13.1.1 China
- 13.1.2 Japan
- 13.1.3 India
- 13.1.4 South Korea
- 13.1.5 Southeast Asia
- 13.1.6 Australia
- 13.1.7 Indonesia
- 13.1.8 Phillipes
- 13.1.9 Singapore
- 13.1.10 Thailandc
- 13.1.11 Rest of Asia Pacific
- 14. South America Activated Carbon Fiber Industry Analysis, Insights and Forecast, 2019-2031
- 14.1. Market Analysis, Insights and Forecast - By Country/Sub-region
- 14.1.1 Brazil
- 14.1.2 Argentina
- 14.1.3 Peru
- 14.1.4 Chile
- 14.1.5 Colombia
- 14.1.6 Ecuador
- 14.1.7 Venezuela
- 14.1.8 Rest of South America
- 15. North America Activated Carbon Fiber Industry Analysis, Insights and Forecast, 2019-2031
- 15.1. Market Analysis, Insights and Forecast - By Country/Sub-region
- 15.1.1 United States
- 15.1.2 Canada
- 15.1.3 Mexico
- 16. MEA Activated Carbon Fiber Industry Analysis, Insights and Forecast, 2019-2031
- 16.1. Market Analysis, Insights and Forecast - By Country/Sub-region
- 16.1.1 United Arab Emirates
- 16.1.2 Saudi Arabia
- 16.1.3 South Africa
- 16.1.4 Rest of Middle East and Africa
- 17. Competitive Analysis
- 17.1. Global Market Share Analysis 2024
- 17.2. Company Profiles
- 17.2.1 Jiangsu Tongkang Activated Carbon Fiber Co Ltd
- 17.2.1.1. Overview
- 17.2.1.2. Products
- 17.2.1.3. SWOT Analysis
- 17.2.1.4. Recent Developments
- 17.2.1.5. Financials (Based on Availability)
- 17.2.2 Nantong Yongtong Environmental Technology Co Ltd
- 17.2.2.1. Overview
- 17.2.2.2. Products
- 17.2.2.3. SWOT Analysis
- 17.2.2.4. Recent Developments
- 17.2.2.5. Financials (Based on Availability)
- 17.2.3 Kuraray Co Ltd
- 17.2.3.1. Overview
- 17.2.3.2. Products
- 17.2.3.3. SWOT Analysis
- 17.2.3.4. Recent Developments
- 17.2.3.5. Financials (Based on Availability)
- 17.2.4 Hangzhou Nature Technology Co Ltd (Nature Carbon)
- 17.2.4.1. Overview
- 17.2.4.2. Products
- 17.2.4.3. SWOT Analysis
- 17.2.4.4. Recent Developments
- 17.2.4.5. Financials (Based on Availability)
- 17.2.5 Anshan Sinocarb Carbon Fibers Co Ltd
- 17.2.5.1. Overview
- 17.2.5.2. Products
- 17.2.5.3. SWOT Analysis
- 17.2.5.4. Recent Developments
- 17.2.5.5. Financials (Based on Availability)
- 17.2.6 Unitika LTD*List Not Exhaustive
- 17.2.6.1. Overview
- 17.2.6.2. Products
- 17.2.6.3. SWOT Analysis
- 17.2.6.4. Recent Developments
- 17.2.6.5. Financials (Based on Availability)
- 17.2.7 China Beihai Fiberglass Co Ltd
- 17.2.7.1. Overview
- 17.2.7.2. Products
- 17.2.7.3. SWOT Analysis
- 17.2.7.4. Recent Developments
- 17.2.7.5. Financials (Based on Availability)
- 17.2.8 Toyobo Co Ltd
- 17.2.8.1. Overview
- 17.2.8.2. Products
- 17.2.8.3. SWOT Analysis
- 17.2.8.4. Recent Developments
- 17.2.8.5. Financials (Based on Availability)
- 17.2.9 Osaka Gas Chemicals Co Ltd
- 17.2.9.1. Overview
- 17.2.9.2. Products
- 17.2.9.3. SWOT Analysis
- 17.2.9.4. Recent Developments
- 17.2.9.5. Financials (Based on Availability)
- 17.2.10 Evertech Envisafe Ecology Co Ltd
- 17.2.10.1. Overview
- 17.2.10.2. Products
- 17.2.10.3. SWOT Analysis
- 17.2.10.4. Recent Developments
- 17.2.10.5. Financials (Based on Availability)
- 17.2.11 HPMS Graphite
- 17.2.11.1. Overview
- 17.2.11.2. Products
- 17.2.11.3. SWOT Analysis
- 17.2.11.4. Recent Developments
- 17.2.11.5. Financials (Based on Availability)
- 17.2.1 Jiangsu Tongkang Activated Carbon Fiber Co Ltd
List of Figures
- Figure 1: Global Activated Carbon Fiber Industry Revenue Breakdown (Million, %) by Region 2024 & 2032
- Figure 2: North America Activated Carbon Fiber Industry Revenue (Million), by Country 2024 & 2032
- Figure 3: North America Activated Carbon Fiber Industry Revenue Share (%), by Country 2024 & 2032
- Figure 4: Europe Activated Carbon Fiber Industry Revenue (Million), by Country 2024 & 2032
- Figure 5: Europe Activated Carbon Fiber Industry Revenue Share (%), by Country 2024 & 2032
- Figure 6: Asia Pacific Activated Carbon Fiber Industry Revenue (Million), by Country 2024 & 2032
- Figure 7: Asia Pacific Activated Carbon Fiber Industry Revenue Share (%), by Country 2024 & 2032
- Figure 8: South America Activated Carbon Fiber Industry Revenue (Million), by Country 2024 & 2032
- Figure 9: South America Activated Carbon Fiber Industry Revenue Share (%), by Country 2024 & 2032
- Figure 10: North America Activated Carbon Fiber Industry Revenue (Million), by Country 2024 & 2032
- Figure 11: North America Activated Carbon Fiber Industry Revenue Share (%), by Country 2024 & 2032
- Figure 12: MEA Activated Carbon Fiber Industry Revenue (Million), by Country 2024 & 2032
- Figure 13: MEA Activated Carbon Fiber Industry Revenue Share (%), by Country 2024 & 2032
- Figure 14: Asia Pacific Activated Carbon Fiber Industry Revenue (Million), by Raw Material 2024 & 2032
- Figure 15: Asia Pacific Activated Carbon Fiber Industry Revenue Share (%), by Raw Material 2024 & 2032
- Figure 16: Asia Pacific Activated Carbon Fiber Industry Revenue (Million), by Application 2024 & 2032
- Figure 17: Asia Pacific Activated Carbon Fiber Industry Revenue Share (%), by Application 2024 & 2032
- Figure 18: Asia Pacific Activated Carbon Fiber Industry Revenue (Million), by Country 2024 & 2032
- Figure 19: Asia Pacific Activated Carbon Fiber Industry Revenue Share (%), by Country 2024 & 2032
- Figure 20: North America Activated Carbon Fiber Industry Revenue (Million), by Raw Material 2024 & 2032
- Figure 21: North America Activated Carbon Fiber Industry Revenue Share (%), by Raw Material 2024 & 2032
- Figure 22: North America Activated Carbon Fiber Industry Revenue (Million), by Application 2024 & 2032
- Figure 23: North America Activated Carbon Fiber Industry Revenue Share (%), by Application 2024 & 2032
- Figure 24: North America Activated Carbon Fiber Industry Revenue (Million), by Country 2024 & 2032
- Figure 25: North America Activated Carbon Fiber Industry Revenue Share (%), by Country 2024 & 2032
- Figure 26: Europe Activated Carbon Fiber Industry Revenue (Million), by Raw Material 2024 & 2032
- Figure 27: Europe Activated Carbon Fiber Industry Revenue Share (%), by Raw Material 2024 & 2032
- Figure 28: Europe Activated Carbon Fiber Industry Revenue (Million), by Application 2024 & 2032
- Figure 29: Europe Activated Carbon Fiber Industry Revenue Share (%), by Application 2024 & 2032
- Figure 30: Europe Activated Carbon Fiber Industry Revenue (Million), by Country 2024 & 2032
- Figure 31: Europe Activated Carbon Fiber Industry Revenue Share (%), by Country 2024 & 2032
- Figure 32: Middle East Activated Carbon Fiber Industry Revenue (Million), by Raw Material 2024 & 2032
- Figure 33: Middle East Activated Carbon Fiber Industry Revenue Share (%), by Raw Material 2024 & 2032
- Figure 34: Middle East Activated Carbon Fiber Industry Revenue (Million), by Application 2024 & 2032
- Figure 35: Middle East Activated Carbon Fiber Industry Revenue Share (%), by Application 2024 & 2032
- Figure 36: Middle East Activated Carbon Fiber Industry Revenue (Million), by Country 2024 & 2032
- Figure 37: Middle East Activated Carbon Fiber Industry Revenue Share (%), by Country 2024 & 2032
- Figure 38: Saudi Arabia Activated Carbon Fiber Industry Revenue (Million), by Raw Material 2024 & 2032
- Figure 39: Saudi Arabia Activated Carbon Fiber Industry Revenue Share (%), by Raw Material 2024 & 2032
- Figure 40: Saudi Arabia Activated Carbon Fiber Industry Revenue (Million), by Application 2024 & 2032
- Figure 41: Saudi Arabia Activated Carbon Fiber Industry Revenue Share (%), by Application 2024 & 2032
- Figure 42: Saudi Arabia Activated Carbon Fiber Industry Revenue (Million), by Country 2024 & 2032
- Figure 43: Saudi Arabia Activated Carbon Fiber Industry Revenue Share (%), by Country 2024 & 2032
List of Tables
- Table 1: Global Activated Carbon Fiber Industry Revenue Million Forecast, by Region 2019 & 2032
- Table 2: Global Activated Carbon Fiber Industry Revenue Million Forecast, by Raw Material 2019 & 2032
- Table 3: Global Activated Carbon Fiber Industry Revenue Million Forecast, by Application 2019 & 2032
- Table 4: Global Activated Carbon Fiber Industry Revenue Million Forecast, by Region 2019 & 2032
- Table 5: Global Activated Carbon Fiber Industry Revenue Million Forecast, by Country 2019 & 2032
- Table 6: United States Activated Carbon Fiber Industry Revenue (Million) Forecast, by Application 2019 & 2032
- Table 7: Canada Activated Carbon Fiber Industry Revenue (Million) Forecast, by Application 2019 & 2032
- Table 8: Mexico Activated Carbon Fiber Industry Revenue (Million) Forecast, by Application 2019 & 2032
- Table 9: Global Activated Carbon Fiber Industry Revenue Million Forecast, by Country 2019 & 2032
- Table 10: Germany Activated Carbon Fiber Industry Revenue (Million) Forecast, by Application 2019 & 2032
- Table 11: United Kingdom Activated Carbon Fiber Industry Revenue (Million) Forecast, by Application 2019 & 2032
- Table 12: France Activated Carbon Fiber Industry Revenue (Million) Forecast, by Application 2019 & 2032
- Table 13: Spain Activated Carbon Fiber Industry Revenue (Million) Forecast, by Application 2019 & 2032
- Table 14: Italy Activated Carbon Fiber Industry Revenue (Million) Forecast, by Application 2019 & 2032
- Table 15: Spain Activated Carbon Fiber Industry Revenue (Million) Forecast, by Application 2019 & 2032
- Table 16: Belgium Activated Carbon Fiber Industry Revenue (Million) Forecast, by Application 2019 & 2032
- Table 17: Netherland Activated Carbon Fiber Industry Revenue (Million) Forecast, by Application 2019 & 2032
- Table 18: Nordics Activated Carbon Fiber Industry Revenue (Million) Forecast, by Application 2019 & 2032
- Table 19: Rest of Europe Activated Carbon Fiber Industry Revenue (Million) Forecast, by Application 2019 & 2032
- Table 20: Global Activated Carbon Fiber Industry Revenue Million Forecast, by Country 2019 & 2032
- Table 21: China Activated Carbon Fiber Industry Revenue (Million) Forecast, by Application 2019 & 2032
- Table 22: Japan Activated Carbon Fiber Industry Revenue (Million) Forecast, by Application 2019 & 2032
- Table 23: India Activated Carbon Fiber Industry Revenue (Million) Forecast, by Application 2019 & 2032
- Table 24: South Korea Activated Carbon Fiber Industry Revenue (Million) Forecast, by Application 2019 & 2032
- Table 25: Southeast Asia Activated Carbon Fiber Industry Revenue (Million) Forecast, by Application 2019 & 2032
- Table 26: Australia Activated Carbon Fiber Industry Revenue (Million) Forecast, by Application 2019 & 2032
- Table 27: Indonesia Activated Carbon Fiber Industry Revenue (Million) Forecast, by Application 2019 & 2032
- Table 28: Phillipes Activated Carbon Fiber Industry Revenue (Million) Forecast, by Application 2019 & 2032
- Table 29: Singapore Activated Carbon Fiber Industry Revenue (Million) Forecast, by Application 2019 & 2032
- Table 30: Thailandc Activated Carbon Fiber Industry Revenue (Million) Forecast, by Application 2019 & 2032
- Table 31: Rest of Asia Pacific Activated Carbon Fiber Industry Revenue (Million) Forecast, by Application 2019 & 2032
- Table 32: Global Activated Carbon Fiber Industry Revenue Million Forecast, by Country 2019 & 2032
- Table 33: Brazil Activated Carbon Fiber Industry Revenue (Million) Forecast, by Application 2019 & 2032
- Table 34: Argentina Activated Carbon Fiber Industry Revenue (Million) Forecast, by Application 2019 & 2032
- Table 35: Peru Activated Carbon Fiber Industry Revenue (Million) Forecast, by Application 2019 & 2032
- Table 36: Chile Activated Carbon Fiber Industry Revenue (Million) Forecast, by Application 2019 & 2032
- Table 37: Colombia Activated Carbon Fiber Industry Revenue (Million) Forecast, by Application 2019 & 2032
- Table 38: Ecuador Activated Carbon Fiber Industry Revenue (Million) Forecast, by Application 2019 & 2032
- Table 39: Venezuela Activated Carbon Fiber Industry Revenue (Million) Forecast, by Application 2019 & 2032
- Table 40: Rest of South America Activated Carbon Fiber Industry Revenue (Million) Forecast, by Application 2019 & 2032
- Table 41: Global Activated Carbon Fiber Industry Revenue Million Forecast, by Country 2019 & 2032
- Table 42: United States Activated Carbon Fiber Industry Revenue (Million) Forecast, by Application 2019 & 2032
- Table 43: Canada Activated Carbon Fiber Industry Revenue (Million) Forecast, by Application 2019 & 2032
- Table 44: Mexico Activated Carbon Fiber Industry Revenue (Million) Forecast, by Application 2019 & 2032
- Table 45: Global Activated Carbon Fiber Industry Revenue Million Forecast, by Country 2019 & 2032
- Table 46: United Arab Emirates Activated Carbon Fiber Industry Revenue (Million) Forecast, by Application 2019 & 2032
- Table 47: Saudi Arabia Activated Carbon Fiber Industry Revenue (Million) Forecast, by Application 2019 & 2032
- Table 48: South Africa Activated Carbon Fiber Industry Revenue (Million) Forecast, by Application 2019 & 2032
- Table 49: Rest of Middle East and Africa Activated Carbon Fiber Industry Revenue (Million) Forecast, by Application 2019 & 2032
- Table 50: Global Activated Carbon Fiber Industry Revenue Million Forecast, by Raw Material 2019 & 2032
- Table 51: Global Activated Carbon Fiber Industry Revenue Million Forecast, by Application 2019 & 2032
- Table 52: Global Activated Carbon Fiber Industry Revenue Million Forecast, by Country 2019 & 2032
- Table 53: China Activated Carbon Fiber Industry Revenue (Million) Forecast, by Application 2019 & 2032
- Table 54: India Activated Carbon Fiber Industry Revenue (Million) Forecast, by Application 2019 & 2032
- Table 55: Japan Activated Carbon Fiber Industry Revenue (Million) Forecast, by Application 2019 & 2032
- Table 56: South Korea Activated Carbon Fiber Industry Revenue (Million) Forecast, by Application 2019 & 2032
- Table 57: Rest of Asia Pacific Activated Carbon Fiber Industry Revenue (Million) Forecast, by Application 2019 & 2032
- Table 58: Global Activated Carbon Fiber Industry Revenue Million Forecast, by Raw Material 2019 & 2032
- Table 59: Global Activated Carbon Fiber Industry Revenue Million Forecast, by Application 2019 & 2032
- Table 60: Global Activated Carbon Fiber Industry Revenue Million Forecast, by Country 2019 & 2032
- Table 61: United States Activated Carbon Fiber Industry Revenue (Million) Forecast, by Application 2019 & 2032
- Table 62: Mexico Activated Carbon Fiber Industry Revenue (Million) Forecast, by Application 2019 & 2032
- Table 63: Canada Activated Carbon Fiber Industry Revenue (Million) Forecast, by Application 2019 & 2032
- Table 64: Global Activated Carbon Fiber Industry Revenue Million Forecast, by Raw Material 2019 & 2032
- Table 65: Global Activated Carbon Fiber Industry Revenue Million Forecast, by Application 2019 & 2032
- Table 66: Global Activated Carbon Fiber Industry Revenue Million Forecast, by Country 2019 & 2032
- Table 67: Germany Activated Carbon Fiber Industry Revenue (Million) Forecast, by Application 2019 & 2032
- Table 68: United Kingdom Activated Carbon Fiber Industry Revenue (Million) Forecast, by Application 2019 & 2032
- Table 69: France Activated Carbon Fiber Industry Revenue (Million) Forecast, by Application 2019 & 2032
- Table 70: Italy Activated Carbon Fiber Industry Revenue (Million) Forecast, by Application 2019 & 2032
- Table 71: Rest of Europe Activated Carbon Fiber Industry Revenue (Million) Forecast, by Application 2019 & 2032
- Table 72: Global Activated Carbon Fiber Industry Revenue Million Forecast, by Raw Material 2019 & 2032
- Table 73: Global Activated Carbon Fiber Industry Revenue Million Forecast, by Application 2019 & 2032
- Table 74: Global Activated Carbon Fiber Industry Revenue Million Forecast, by Country 2019 & 2032
- Table 75: Global Activated Carbon Fiber Industry Revenue Million Forecast, by Raw Material 2019 & 2032
- Table 76: Global Activated Carbon Fiber Industry Revenue Million Forecast, by Application 2019 & 2032
- Table 77: Global Activated Carbon Fiber Industry Revenue Million Forecast, by Country 2019 & 2032
- Table 78: South Africa Activated Carbon Fiber Industry Revenue (Million) Forecast, by Application 2019 & 2032
- Table 79: Rest of Middle East Activated Carbon Fiber Industry Revenue (Million) Forecast, by Application 2019 & 2032
Frequently Asked Questions
1. What is the projected Compound Annual Growth Rate (CAGR) of the Activated Carbon Fiber Industry?
The projected CAGR is approximately 3.71%.
2. Which companies are prominent players in the Activated Carbon Fiber Industry?
Key companies in the market include Jiangsu Tongkang Activated Carbon Fiber Co Ltd, Nantong Yongtong Environmental Technology Co Ltd, Kuraray Co Ltd, Hangzhou Nature Technology Co Ltd (Nature Carbon), Anshan Sinocarb Carbon Fibers Co Ltd, Unitika LTD*List Not Exhaustive, China Beihai Fiberglass Co Ltd, Toyobo Co Ltd, Osaka Gas Chemicals Co Ltd, Evertech Envisafe Ecology Co Ltd, HPMS Graphite.
3. What are the main segments of the Activated Carbon Fiber Industry?
The market segments include Raw Material, Application.
4. Can you provide details about the market size?
The market size is estimated to be USD 414.13 Million as of 2022.
5. What are some drivers contributing to market growth?
Increasing Environmental Concerns Related to Air and Water Pollution; Superior Properties of Activated Carbon Fiber.
6. What are the notable trends driving market growth?
Increasing Demand from the Purification Industry.
7. Are there any restraints impacting market growth?
Concerns Related to Raw Materials.
8. Can you provide examples of recent developments in the market?
N/A
9. What pricing options are available for accessing the report?
Pricing options include single-user, multi-user, and enterprise licenses priced at USD 4750, USD 5250, and USD 8750 respectively.
10. Is the market size provided in terms of value or volume?
The market size is provided in terms of value, measured in Million.
11. Are there any specific market keywords associated with the report?
Yes, the market keyword associated with the report is "Activated Carbon Fiber Industry," which aids in identifying and referencing the specific market segment covered.
12. How do I determine which pricing option suits my needs best?
The pricing options vary based on user requirements and access needs. Individual users may opt for single-user licenses, while businesses requiring broader access may choose multi-user or enterprise licenses for cost-effective access to the report.
13. Are there any additional resources or data provided in the Activated Carbon Fiber Industry report?
While the report offers comprehensive insights, it's advisable to review the specific contents or supplementary materials provided to ascertain if additional resources or data are available.
14. How can I stay updated on further developments or reports in the Activated Carbon Fiber Industry?
To stay informed about further developments, trends, and reports in the Activated Carbon Fiber Industry, consider subscribing to industry newsletters, following relevant companies and organizations, or regularly checking reputable industry news sources and publications.
Methodology
Step 1 - Identification of Relevant Samples Size from Population Database


Step 2 - Approaches for Defining Global Market Size (Value, Volume* & Price*)

Note*: In applicable scenarios
Step 3 - Data Sources
Primary Research
- Web Analytics
- Survey Reports
- Research Institute
- Latest Research Reports
- Opinion Leaders
Secondary Research
- Annual Reports
- White Paper
- Latest Press Release
- Industry Association
- Paid Database
- Investor Presentations

Step 4 - Data Triangulation
Involves using different sources of information in order to increase the validity of a study
These sources are likely to be stakeholders in a program - participants, other researchers, program staff, other community members, and so on.
Then we put all data in single framework & apply various statistical tools to find out the dynamic on the market.
During the analysis stage, feedback from the stakeholder groups would be compared to determine areas of agreement as well as areas of divergence
