

Key Insights
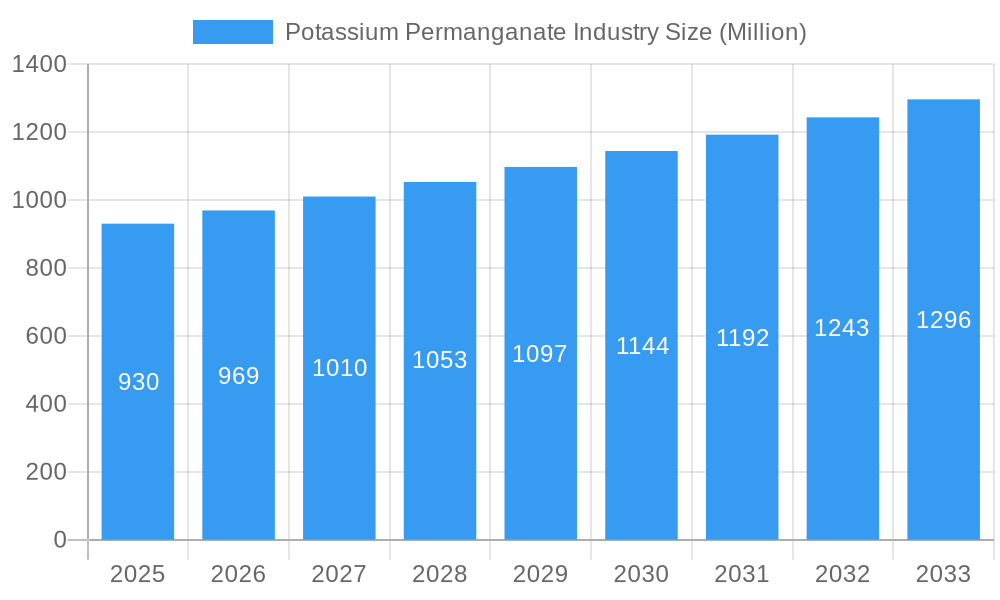
The Potassium Permanganate market, valued at $0.93 billion in 2025, is projected to experience steady growth, driven by its diverse applications across various industries. The Compound Annual Growth Rate (CAGR) of 4.11% from 2025 to 2033 indicates a promising outlook. Key drivers include increasing demand from water treatment plants for disinfection and purification, its use as a bleaching agent in textile and paper industries, and its role in chemical synthesis for various products. Growing environmental concerns and stricter regulations regarding water quality are further propelling market expansion. The market faces some restraints, including the volatility of raw material prices (manganese dioxide) and potential health risks associated with improper handling. Segmentation within the market is likely driven by application (water treatment, chemical synthesis, etc.) and geographic region. Major players like Carus Group Inc., Changsha Yonta, and others are actively involved in production and distribution, fostering competition and innovation. The market is likely geographically diversified, with regions like North America and Asia-Pacific potentially holding significant market shares due to industrial activity and population density. Future growth is expected to be influenced by technological advancements leading to more efficient production methods and exploring new applications for potassium permanganate, such as in medicine and agriculture.
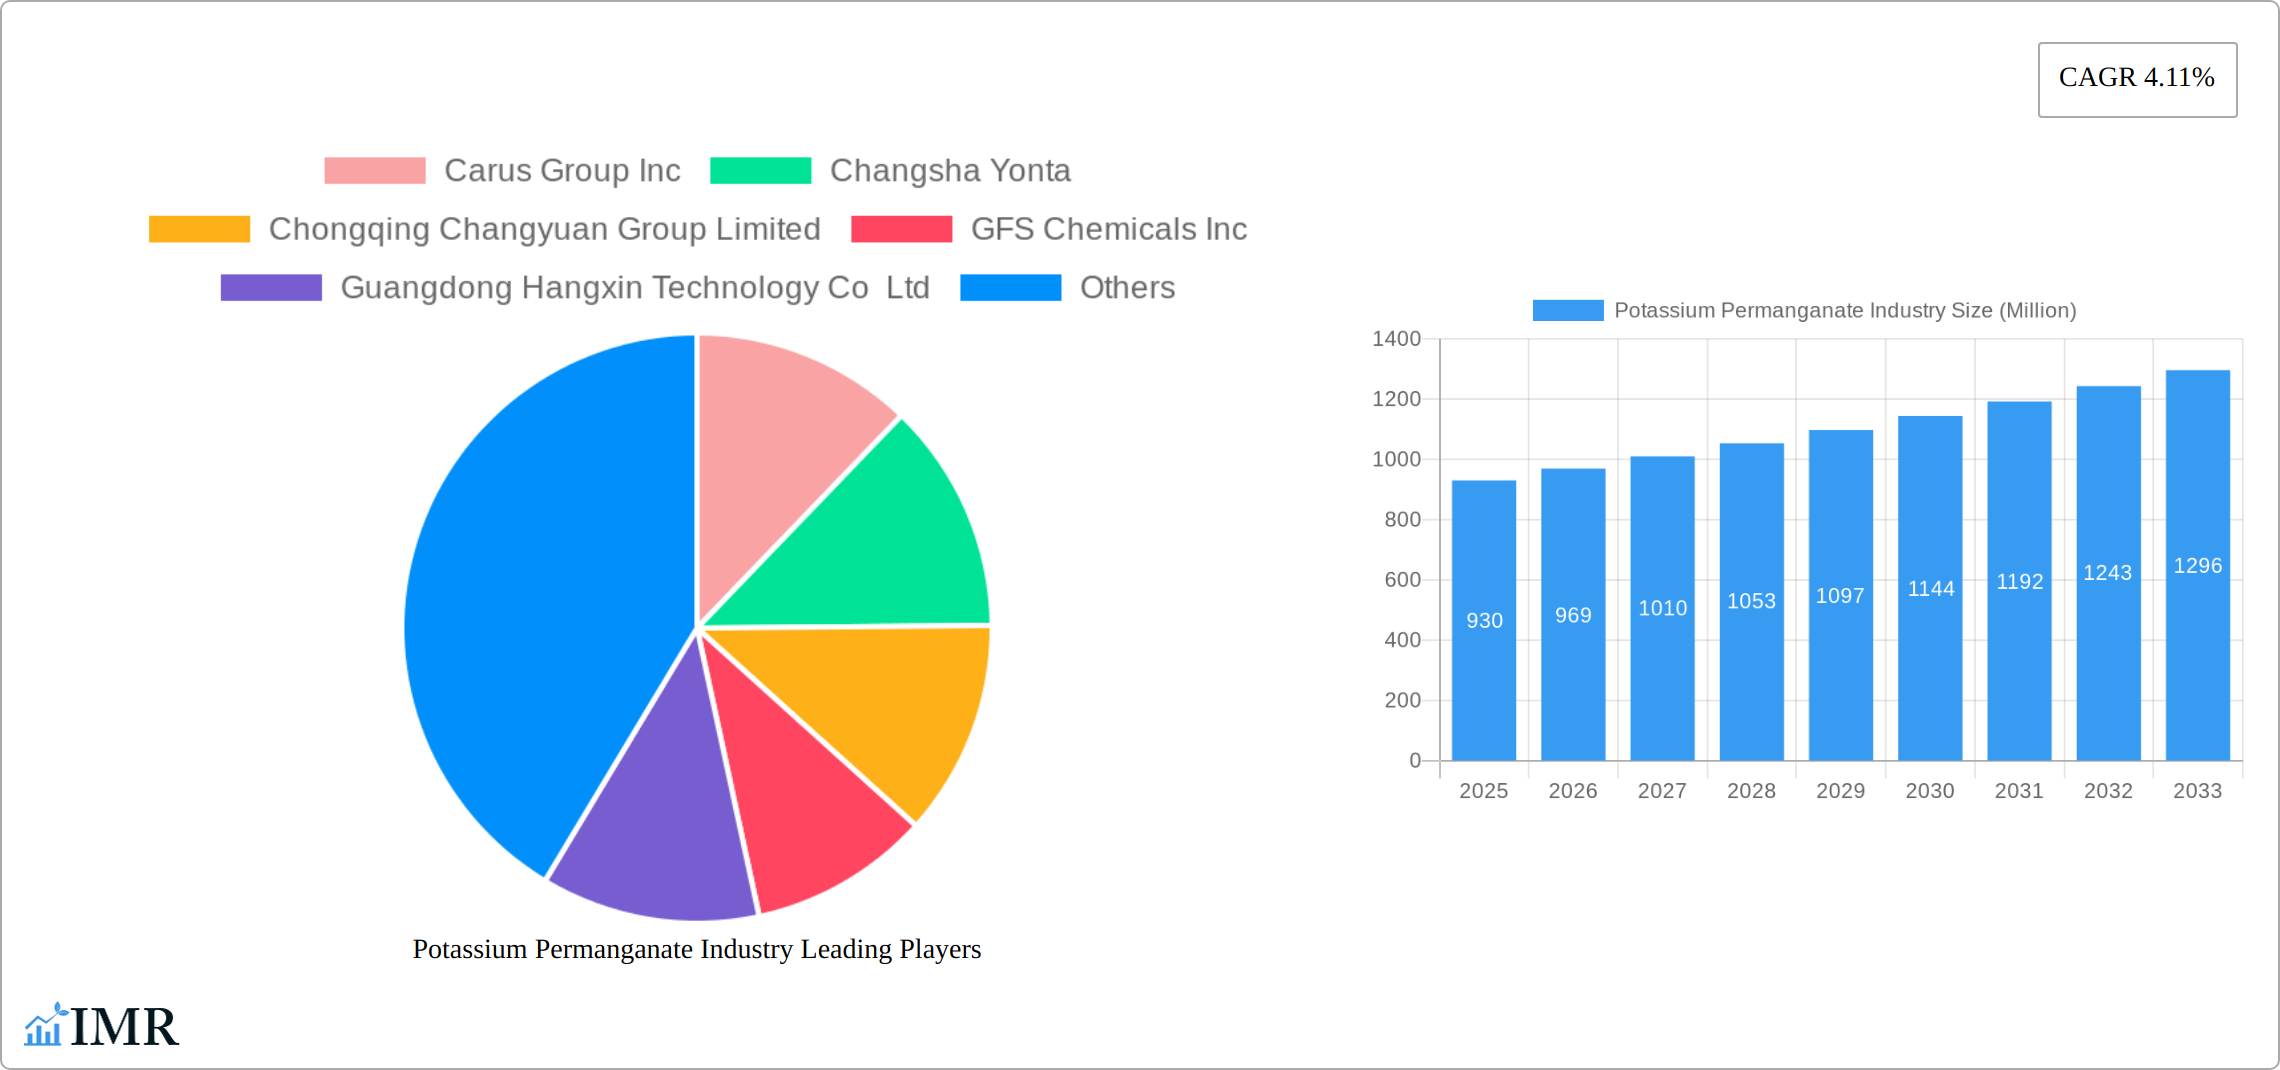
Potassium Permanganate Industry Market Size (In Million)
The forecast period (2025-2033) presents opportunities for market expansion driven by increasing industrialization and infrastructure development, especially in emerging economies. However, sustainable sourcing of raw materials and stringent environmental regulations will be crucial aspects for industry players. Strategic partnerships and investments in research and development are likely to shape competitive landscapes within the potassium permanganate market. Given the projected CAGR, the market size is expected to reach approximately $1.35 Billion by 2033 (calculated based on a compounded growth from the 2025 base). Market participants should focus on sustainable practices and technological innovation to maintain competitiveness and meet the evolving needs of end-use industries.
Potassium Permanganate Industry Company Market Share
Potassium Permanganate Industry Market Report: 2019-2033
This comprehensive report provides an in-depth analysis of the global Potassium Permanganate industry, offering invaluable insights for industry professionals, investors, and strategic decision-makers. With a focus on market dynamics, growth trends, and competitive landscapes, this report covers the period from 2019 to 2033, with a base year of 2025. The report's detailed analysis covers the parent market of chemical oxidizers and the child market of water treatment chemicals, providing a holistic view of the industry. Expected market size values are provided in Million units.
Potassium Permanganate Industry Market Dynamics & Structure
This section provides a comprehensive analysis of the potassium permanganate market's intricate structure. We explore the degree of market concentration, identify the key drivers behind technological innovation, and delineate the prevailing regulatory frameworks that shape the industry. Furthermore, we assess the competitive landscape by examining potential product substitutes, analyze the demographics of end-users across various sectors, and highlight significant trends in mergers and acquisitions (M&A). Our deep dive into the competitive arena scrutinizes the market share of prominent players such as Carus Group Inc, Changsha Yonta, and Chongqing Changyuan Group Limited, among others, detailing their strategic approaches and distinct competitive advantages.
- Market Concentration: The potassium permanganate market demonstrates a moderately consolidated structure. In 2025, the top five leading players collectively held approximately 60-70% of the market share, indicating a significant presence of established entities.
- Technological Innovation: Continuous advancements in production methodologies are a primary catalyst for market growth, with a strong emphasis on enhancing efficiency, reducing environmental impact, and improving product purity. However, the adoption of state-of-the-art technologies often necessitates substantial capital investment, posing a challenge for smaller market participants.
- Regulatory Landscape: Stringent environmental regulations, particularly concerning emissions and waste management, exert considerable influence on production processes and product formulations. Navigating the complexities of compliance across diverse regional regulations and managing associated costs are significant hurdles for manufacturers.
- Competitive Substitutes: The market faces competitive pressure from a range of alternative oxidizing agents and disinfectants, such as hydrogen peroxide, ozone, and chlorine-based compounds. These substitutes can limit the growth potential of potassium permanganate in certain applications, necessitating a focus on its unique benefits and cost-effectiveness.
- End-User Demographics: The primary demand for potassium permanganate stems from critical end-use segments, including municipal and industrial water treatment, chemical synthesis (as an oxidant and in organic reactions), and the textile industry (for bleaching and dyeing processes). Each sector contributes to overall market demand with varying growth trajectories.
- M&A Activity: The industry has witnessed a notable trend of consolidation and strategic expansion, with approximately 8-12 significant M&A deals recorded between 2019 and 2024. These activities reflect a drive for market share acquisition, vertical integration, and the expansion of product portfolios.
Potassium Permanganate Industry Growth Trends & Insights
Leveraging extensive market research and sophisticated data analysis, this section provides an in-depth overview of the potassium permanganate market's evolution. We meticulously track the market size expansion, analyze adoption rates of potassium permanganate in emerging applications, identify disruptive technological advancements, and map shifts in consumer and industrial behavior from 2019 to 2033. Our analysis includes a detailed examination of the Compound Annual Growth Rate (CAGR) of the market and its penetration across various end-use segments. The forecast period, spanning from 2025 to 2033, critically considers the influence of prevailing macroeconomic factors and ongoing technological innovations on projected market growth. We will elaborate on the key drivers contributing to an anticipated CAGR of approximately 4.5% to 5.5% during this forecast period.
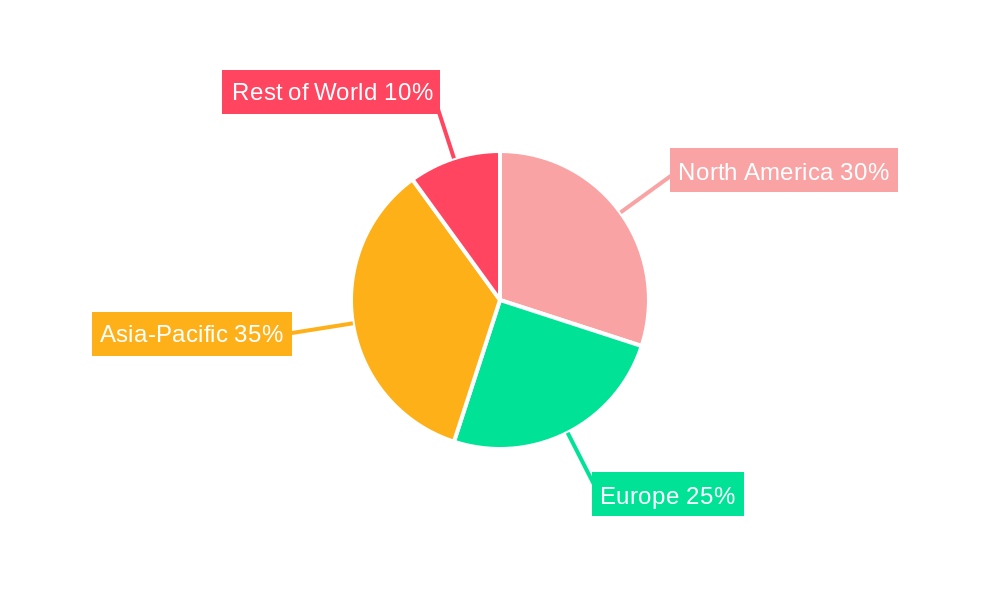
Dominant Regions, Countries, or Segments in Potassium Permanganate Industry
This section identifies the leading geographical regions and market segments driving market growth. Detailed analysis will pinpoint the dominant regions, examining factors such as economic growth, infrastructure development, and favorable government policies. The analysis includes a breakdown of market share by region and segment and growth potential for each area. Specific countries and regions with high growth projections will be highlighted with data substantiating the growth potential.
- Key Drivers:
- Robust infrastructure in developed regions facilitating efficient distribution and usage.
- Favorable government policies promoting water treatment and industrial development.
- Growing demand from emerging economies driving market expansion.
- Dominance Factors:
- Established manufacturing bases in certain regions providing cost advantages.
- Strong presence of major players in specific markets influencing market dynamics.
- Early adoption of advanced technologies in particular regions.
Potassium Permanganate Industry Product Landscape
This section offers a detailed examination of the product innovations, diverse applications, and performance benchmarks of potassium permanganate. We delve into various formulations and grades available in the market, exploring their unique characteristics and specific applications, thereby highlighting the distinct value propositions of each product offering. Furthermore, we discuss technological advancements in production processes that are leading to enhanced product purity, improved efficiency, and more sustainable manufacturing practices. This includes insights into novel production methods and quality control measures that differentiate products in the competitive landscape.
Key Drivers, Barriers & Challenges in Potassium Permanganate Industry
Key Drivers:
- Increasing demand from the water treatment industry due to stringent regulations and growing environmental concerns.
- Expanding applications in chemical synthesis and other industrial processes.
- Technological advancements leading to cost-effective and efficient production.
Key Challenges & Restraints:
- Price fluctuations of raw materials impacting production costs.
- Stringent environmental regulations requiring compliance investments.
- Intense competition from alternative oxidants and disinfectants.
Emerging Opportunities in Potassium Permanganate Industry
This section highlights emerging opportunities, including untapped markets, innovative applications in niche segments (e.g., aquaculture), and evolving consumer preferences toward environmentally friendly solutions. We also explore potential expansion into new geographical markets and the development of value-added products to capitalize on market trends.
Growth Accelerators in the Potassium Permanganate Industry Industry
Technological breakthroughs in production processes and the exploration of novel applications will significantly accelerate market growth. Strategic partnerships and collaborations aimed at expanding market reach and enhancing product offerings also play a crucial role. Efficient supply chain management and proactive adaptation to evolving regulatory environments are vital for long-term growth.
Key Players Shaping the Potassium Permanganate Industry Market
- Carus Group Inc
- Changsha Yonta
- Chongqing Changyuan Group Limited
- GFS Chemicals Inc
- Guangdong Hangxin Technology Co Ltd
- Libox Chem (India) Pvt Ltd
- Magnesia
- Milport Enterprises Inc
- Nippon Chemical Industrial CO LTD
- Otto Chemie Pvt Ltd
- Univar Solutions Inc
- Universal Chemicals & Industries Pvt Ltd
- List Not Exhaustive
Notable Milestones in Potassium Permanganate Industry Sector
- The development of more environmentally friendly production processes has been a key focus, leading to reduced waste generation and lower energy consumption.
- Significant breakthroughs in purification techniques have enabled the production of higher-grade potassium permanganate for specialized applications in pharmaceuticals and fine chemicals.
- Expansion of production capacities by major players to meet the growing global demand, particularly from emerging economies.
- Increased adoption of advanced analytical methods for quality control, ensuring consistent product performance and compliance with international standards.
- Strategic partnerships and collaborations aimed at developing new applications and improving supply chain efficiencies.
- Further details to be included in the complete report.
In-Depth Potassium Permanganate Industry Market Outlook
The Potassium Permanganate market is poised for robust growth driven by increasing demand from various sectors and technological advancements. Strategic opportunities exist in exploring niche applications, expanding into emerging markets, and developing sustainable production processes. The future market potential is considerable, with continued innovation and strategic partnerships playing pivotal roles in shaping the industry's trajectory.
Potassium Permanganate Industry Segmentation
-
1. End-user Industry
- 1.1. Pharmaceutical
- 1.2. Water Treatment
- 1.3. Food and Beverage
- 1.4. Agriculture
- 1.5. Other End-user Industries
Potassium Permanganate Industry Segmentation By Geography
-
1. Asia Pacific
- 1.1. China
- 1.2. India
- 1.3. Japan
- 1.4. South Korea
- 1.5. Rest of Asia Pacific
-
2. North America
- 2.1. United States
- 2.2. Canada
- 2.3. Mexico
-
3. Europe
- 3.1. Germany
- 3.2. United Kingdom
- 3.3. France
- 3.4. Italy
- 3.5. Rest of Europe
-
4. South America
- 4.1. Brazil
- 4.2. Argentina
- 4.3. Rest of South America
-
5. Middle East and Africa
- 5.1. Saudi Arabia
- 5.2. South Africa
- 5.3. Rest of Middle East and Africa
Potassium Permanganate Industry Regional Market Share
Geographic Coverage of Potassium Permanganate Industry
Potassium Permanganate Industry REPORT HIGHLIGHTS
| Aspects | Details |
|---|---|
| Study Period | 2020-2034 |
| Base Year | 2025 |
| Estimated Year | 2026 |
| Forecast Period | 2026-2034 |
| Historical Period | 2020-2025 |
| Growth Rate | CAGR of 4.11% from 2020-2034 |
| Segmentation |
|
Table of Contents
- 1. Introduction
- 1.1. Research Scope
- 1.2. Market Segmentation
- 1.3. Research Objective
- 1.4. Definitions and Assumptions
- 2. Executive Summary
- 2.1. Market Snapshot
- 3. Market Dynamics
- 3.1. Market Drivers
- 3.2. Market Restrains
- 3.3. Market Trends
- 3.4. Market Opportunities
- 4. Market Factor Analysis
- 4.1. Porters Five Forces
- 4.1.1. Bargaining Power of Suppliers
- 4.1.2. Bargaining Power of Buyers
- 4.1.3. Threat of New Entrants
- 4.1.4. Threat of Substitutes
- 4.1.5. Competitive Rivalry
- 4.2. PESTEL analysis
- 4.3. BCG Analysis
- 4.3.1. Stars (High Growth, High Market Share)
- 4.3.2. Cash Cows (Low Growth, High Market Share)
- 4.3.3. Question Mark (High Growth, Low Market Share)
- 4.3.4. Dogs (Low Growth, Low Market Share)
- 4.4. Ansoff Matrix Analysis
- 4.5. Supply Chain Analysis
- 4.6. Regulatory Landscape
- 4.7. Current Market Potential and Opportunity Assessment (TAM–SAM–SOM Framework)
- 4.8. IMR Analyst Note
- 4.1. Porters Five Forces
- 5. Market Analysis, Insights and Forecast 2021-2033
- 5.1. Market Analysis, Insights and Forecast - by End-user Industry
- 5.1.1. Pharmaceutical
- 5.1.2. Water Treatment
- 5.1.3. Food and Beverage
- 5.1.4. Agriculture
- 5.1.5. Other End-user Industries
- 5.2. Market Analysis, Insights and Forecast - by Region
- 5.2.1. Asia Pacific
- 5.2.2. North America
- 5.2.3. Europe
- 5.2.4. South America
- 5.2.5. Middle East and Africa
- 5.1. Market Analysis, Insights and Forecast - by End-user Industry
- 6. Global Potassium Permanganate Industry Analysis, Insights and Forecast, 2021-2033
- 6.1. Market Analysis, Insights and Forecast - by End-user Industry
- 6.1.1. Pharmaceutical
- 6.1.2. Water Treatment
- 6.1.3. Food and Beverage
- 6.1.4. Agriculture
- 6.1.5. Other End-user Industries
- 6.1. Market Analysis, Insights and Forecast - by End-user Industry
- 7. Asia Pacific Potassium Permanganate Industry Analysis, Insights and Forecast, 2020-2032
- 7.1. Market Analysis, Insights and Forecast - by End-user Industry
- 7.1.1. Pharmaceutical
- 7.1.2. Water Treatment
- 7.1.3. Food and Beverage
- 7.1.4. Agriculture
- 7.1.5. Other End-user Industries
- 7.1. Market Analysis, Insights and Forecast - by End-user Industry
- 8. North America Potassium Permanganate Industry Analysis, Insights and Forecast, 2020-2032
- 8.1. Market Analysis, Insights and Forecast - by End-user Industry
- 8.1.1. Pharmaceutical
- 8.1.2. Water Treatment
- 8.1.3. Food and Beverage
- 8.1.4. Agriculture
- 8.1.5. Other End-user Industries
- 8.1. Market Analysis, Insights and Forecast - by End-user Industry
- 9. Europe Potassium Permanganate Industry Analysis, Insights and Forecast, 2020-2032
- 9.1. Market Analysis, Insights and Forecast - by End-user Industry
- 9.1.1. Pharmaceutical
- 9.1.2. Water Treatment
- 9.1.3. Food and Beverage
- 9.1.4. Agriculture
- 9.1.5. Other End-user Industries
- 9.1. Market Analysis, Insights and Forecast - by End-user Industry
- 10. South America Potassium Permanganate Industry Analysis, Insights and Forecast, 2020-2032
- 10.1. Market Analysis, Insights and Forecast - by End-user Industry
- 10.1.1. Pharmaceutical
- 10.1.2. Water Treatment
- 10.1.3. Food and Beverage
- 10.1.4. Agriculture
- 10.1.5. Other End-user Industries
- 10.1. Market Analysis, Insights and Forecast - by End-user Industry
- 11. Middle East and Africa Potassium Permanganate Industry Analysis, Insights and Forecast, 2020-2032
- 11.1. Market Analysis, Insights and Forecast - by End-user Industry
- 11.1.1. Pharmaceutical
- 11.1.2. Water Treatment
- 11.1.3. Food and Beverage
- 11.1.4. Agriculture
- 11.1.5. Other End-user Industries
- 11.1. Market Analysis, Insights and Forecast - by End-user Industry
- 12. Competitive Analysis
- 12.1. Company Profiles
- 12.1.1 Carus Group Inc
- 12.1.1.1. Company Overview
- 12.1.1.2. Products
- 12.1.1.3. Company Financials
- 12.1.1.4. SWOT Analysis
- 12.1.2 Changsha Yonta
- 12.1.2.1. Company Overview
- 12.1.2.2. Products
- 12.1.2.3. Company Financials
- 12.1.2.4. SWOT Analysis
- 12.1.3 Chongqing Changyuan Group Limited
- 12.1.3.1. Company Overview
- 12.1.3.2. Products
- 12.1.3.3. Company Financials
- 12.1.3.4. SWOT Analysis
- 12.1.4 GFS Chemicals Inc
- 12.1.4.1. Company Overview
- 12.1.4.2. Products
- 12.1.4.3. Company Financials
- 12.1.4.4. SWOT Analysis
- 12.1.5 Guangdong Hangxin Technology Co Ltd
- 12.1.5.1. Company Overview
- 12.1.5.2. Products
- 12.1.5.3. Company Financials
- 12.1.5.4. SWOT Analysis
- 12.1.6 Libox Chem (India) Pvt Ltd
- 12.1.6.1. Company Overview
- 12.1.6.2. Products
- 12.1.6.3. Company Financials
- 12.1.6.4. SWOT Analysis
- 12.1.7 Magnesia
- 12.1.7.1. Company Overview
- 12.1.7.2. Products
- 12.1.7.3. Company Financials
- 12.1.7.4. SWOT Analysis
- 12.1.8 Milport Enterprises Inc
- 12.1.8.1. Company Overview
- 12.1.8.2. Products
- 12.1.8.3. Company Financials
- 12.1.8.4. SWOT Analysis
- 12.1.9 Nippon Chemical Industrial CO LTD
- 12.1.9.1. Company Overview
- 12.1.9.2. Products
- 12.1.9.3. Company Financials
- 12.1.9.4. SWOT Analysis
- 12.1.10 Otto Chemie Pvt Ltd
- 12.1.10.1. Company Overview
- 12.1.10.2. Products
- 12.1.10.3. Company Financials
- 12.1.10.4. SWOT Analysis
- 12.1.11 Univar Solutions Inc
- 12.1.11.1. Company Overview
- 12.1.11.2. Products
- 12.1.11.3. Company Financials
- 12.1.11.4. SWOT Analysis
- 12.1.12 Universal Chemicals & Industries Pvt Ltd *List Not Exhaustive
- 12.1.12.1. Company Overview
- 12.1.12.2. Products
- 12.1.12.3. Company Financials
- 12.1.12.4. SWOT Analysis
- 12.1.1 Carus Group Inc
- 12.2. Market Entropy
- 12.2.1 Company's Key Areas Served
- 12.2.2 Recent Developments
- 12.3. Company Market Share Analysis 2025
- 12.3.1 Top 5 Companies Market Share Analysis
- 12.3.2 Top 3 Companies Market Share Analysis
- 12.4. List of Potential Customers
- 13. Research Methodology
List of Figures
- Figure 1: Global Potassium Permanganate Industry Revenue Breakdown (Million, %) by Region 2025 & 2033
- Figure 2: Global Potassium Permanganate Industry Volume Breakdown (Billion, %) by Region 2025 & 2033
- Figure 3: Asia Pacific Potassium Permanganate Industry Revenue (Million), by End-user Industry 2025 & 2033
- Figure 4: Asia Pacific Potassium Permanganate Industry Volume (Billion), by End-user Industry 2025 & 2033
- Figure 5: Asia Pacific Potassium Permanganate Industry Revenue Share (%), by End-user Industry 2025 & 2033
- Figure 6: Asia Pacific Potassium Permanganate Industry Volume Share (%), by End-user Industry 2025 & 2033
- Figure 7: Asia Pacific Potassium Permanganate Industry Revenue (Million), by Country 2025 & 2033
- Figure 8: Asia Pacific Potassium Permanganate Industry Volume (Billion), by Country 2025 & 2033
- Figure 9: Asia Pacific Potassium Permanganate Industry Revenue Share (%), by Country 2025 & 2033
- Figure 10: Asia Pacific Potassium Permanganate Industry Volume Share (%), by Country 2025 & 2033
- Figure 11: North America Potassium Permanganate Industry Revenue (Million), by End-user Industry 2025 & 2033
- Figure 12: North America Potassium Permanganate Industry Volume (Billion), by End-user Industry 2025 & 2033
- Figure 13: North America Potassium Permanganate Industry Revenue Share (%), by End-user Industry 2025 & 2033
- Figure 14: North America Potassium Permanganate Industry Volume Share (%), by End-user Industry 2025 & 2033
- Figure 15: North America Potassium Permanganate Industry Revenue (Million), by Country 2025 & 2033
- Figure 16: North America Potassium Permanganate Industry Volume (Billion), by Country 2025 & 2033
- Figure 17: North America Potassium Permanganate Industry Revenue Share (%), by Country 2025 & 2033
- Figure 18: North America Potassium Permanganate Industry Volume Share (%), by Country 2025 & 2033
- Figure 19: Europe Potassium Permanganate Industry Revenue (Million), by End-user Industry 2025 & 2033
- Figure 20: Europe Potassium Permanganate Industry Volume (Billion), by End-user Industry 2025 & 2033
- Figure 21: Europe Potassium Permanganate Industry Revenue Share (%), by End-user Industry 2025 & 2033
- Figure 22: Europe Potassium Permanganate Industry Volume Share (%), by End-user Industry 2025 & 2033
- Figure 23: Europe Potassium Permanganate Industry Revenue (Million), by Country 2025 & 2033
- Figure 24: Europe Potassium Permanganate Industry Volume (Billion), by Country 2025 & 2033
- Figure 25: Europe Potassium Permanganate Industry Revenue Share (%), by Country 2025 & 2033
- Figure 26: Europe Potassium Permanganate Industry Volume Share (%), by Country 2025 & 2033
- Figure 27: South America Potassium Permanganate Industry Revenue (Million), by End-user Industry 2025 & 2033
- Figure 28: South America Potassium Permanganate Industry Volume (Billion), by End-user Industry 2025 & 2033
- Figure 29: South America Potassium Permanganate Industry Revenue Share (%), by End-user Industry 2025 & 2033
- Figure 30: South America Potassium Permanganate Industry Volume Share (%), by End-user Industry 2025 & 2033
- Figure 31: South America Potassium Permanganate Industry Revenue (Million), by Country 2025 & 2033
- Figure 32: South America Potassium Permanganate Industry Volume (Billion), by Country 2025 & 2033
- Figure 33: South America Potassium Permanganate Industry Revenue Share (%), by Country 2025 & 2033
- Figure 34: South America Potassium Permanganate Industry Volume Share (%), by Country 2025 & 2033
- Figure 35: Middle East and Africa Potassium Permanganate Industry Revenue (Million), by End-user Industry 2025 & 2033
- Figure 36: Middle East and Africa Potassium Permanganate Industry Volume (Billion), by End-user Industry 2025 & 2033
- Figure 37: Middle East and Africa Potassium Permanganate Industry Revenue Share (%), by End-user Industry 2025 & 2033
- Figure 38: Middle East and Africa Potassium Permanganate Industry Volume Share (%), by End-user Industry 2025 & 2033
- Figure 39: Middle East and Africa Potassium Permanganate Industry Revenue (Million), by Country 2025 & 2033
- Figure 40: Middle East and Africa Potassium Permanganate Industry Volume (Billion), by Country 2025 & 2033
- Figure 41: Middle East and Africa Potassium Permanganate Industry Revenue Share (%), by Country 2025 & 2033
- Figure 42: Middle East and Africa Potassium Permanganate Industry Volume Share (%), by Country 2025 & 2033
List of Tables
- Table 1: Global Potassium Permanganate Industry Revenue Million Forecast, by End-user Industry 2020 & 2033
- Table 2: Global Potassium Permanganate Industry Volume Billion Forecast, by End-user Industry 2020 & 2033
- Table 3: Global Potassium Permanganate Industry Revenue Million Forecast, by Region 2020 & 2033
- Table 4: Global Potassium Permanganate Industry Volume Billion Forecast, by Region 2020 & 2033
- Table 5: Global Potassium Permanganate Industry Revenue Million Forecast, by End-user Industry 2020 & 2033
- Table 6: Global Potassium Permanganate Industry Volume Billion Forecast, by End-user Industry 2020 & 2033
- Table 7: Global Potassium Permanganate Industry Revenue Million Forecast, by Country 2020 & 2033
- Table 8: Global Potassium Permanganate Industry Volume Billion Forecast, by Country 2020 & 2033
- Table 9: China Potassium Permanganate Industry Revenue (Million) Forecast, by Application 2020 & 2033
- Table 10: China Potassium Permanganate Industry Volume (Billion) Forecast, by Application 2020 & 2033
- Table 11: India Potassium Permanganate Industry Revenue (Million) Forecast, by Application 2020 & 2033
- Table 12: India Potassium Permanganate Industry Volume (Billion) Forecast, by Application 2020 & 2033
- Table 13: Japan Potassium Permanganate Industry Revenue (Million) Forecast, by Application 2020 & 2033
- Table 14: Japan Potassium Permanganate Industry Volume (Billion) Forecast, by Application 2020 & 2033
- Table 15: South Korea Potassium Permanganate Industry Revenue (Million) Forecast, by Application 2020 & 2033
- Table 16: South Korea Potassium Permanganate Industry Volume (Billion) Forecast, by Application 2020 & 2033
- Table 17: Rest of Asia Pacific Potassium Permanganate Industry Revenue (Million) Forecast, by Application 2020 & 2033
- Table 18: Rest of Asia Pacific Potassium Permanganate Industry Volume (Billion) Forecast, by Application 2020 & 2033
- Table 19: Global Potassium Permanganate Industry Revenue Million Forecast, by End-user Industry 2020 & 2033
- Table 20: Global Potassium Permanganate Industry Volume Billion Forecast, by End-user Industry 2020 & 2033
- Table 21: Global Potassium Permanganate Industry Revenue Million Forecast, by Country 2020 & 2033
- Table 22: Global Potassium Permanganate Industry Volume Billion Forecast, by Country 2020 & 2033
- Table 23: United States Potassium Permanganate Industry Revenue (Million) Forecast, by Application 2020 & 2033
- Table 24: United States Potassium Permanganate Industry Volume (Billion) Forecast, by Application 2020 & 2033
- Table 25: Canada Potassium Permanganate Industry Revenue (Million) Forecast, by Application 2020 & 2033
- Table 26: Canada Potassium Permanganate Industry Volume (Billion) Forecast, by Application 2020 & 2033
- Table 27: Mexico Potassium Permanganate Industry Revenue (Million) Forecast, by Application 2020 & 2033
- Table 28: Mexico Potassium Permanganate Industry Volume (Billion) Forecast, by Application 2020 & 2033
- Table 29: Global Potassium Permanganate Industry Revenue Million Forecast, by End-user Industry 2020 & 2033
- Table 30: Global Potassium Permanganate Industry Volume Billion Forecast, by End-user Industry 2020 & 2033
- Table 31: Global Potassium Permanganate Industry Revenue Million Forecast, by Country 2020 & 2033
- Table 32: Global Potassium Permanganate Industry Volume Billion Forecast, by Country 2020 & 2033
- Table 33: Germany Potassium Permanganate Industry Revenue (Million) Forecast, by Application 2020 & 2033
- Table 34: Germany Potassium Permanganate Industry Volume (Billion) Forecast, by Application 2020 & 2033
- Table 35: United Kingdom Potassium Permanganate Industry Revenue (Million) Forecast, by Application 2020 & 2033
- Table 36: United Kingdom Potassium Permanganate Industry Volume (Billion) Forecast, by Application 2020 & 2033
- Table 37: France Potassium Permanganate Industry Revenue (Million) Forecast, by Application 2020 & 2033
- Table 38: France Potassium Permanganate Industry Volume (Billion) Forecast, by Application 2020 & 2033
- Table 39: Italy Potassium Permanganate Industry Revenue (Million) Forecast, by Application 2020 & 2033
- Table 40: Italy Potassium Permanganate Industry Volume (Billion) Forecast, by Application 2020 & 2033
- Table 41: Rest of Europe Potassium Permanganate Industry Revenue (Million) Forecast, by Application 2020 & 2033
- Table 42: Rest of Europe Potassium Permanganate Industry Volume (Billion) Forecast, by Application 2020 & 2033
- Table 43: Global Potassium Permanganate Industry Revenue Million Forecast, by End-user Industry 2020 & 2033
- Table 44: Global Potassium Permanganate Industry Volume Billion Forecast, by End-user Industry 2020 & 2033
- Table 45: Global Potassium Permanganate Industry Revenue Million Forecast, by Country 2020 & 2033
- Table 46: Global Potassium Permanganate Industry Volume Billion Forecast, by Country 2020 & 2033
- Table 47: Brazil Potassium Permanganate Industry Revenue (Million) Forecast, by Application 2020 & 2033
- Table 48: Brazil Potassium Permanganate Industry Volume (Billion) Forecast, by Application 2020 & 2033
- Table 49: Argentina Potassium Permanganate Industry Revenue (Million) Forecast, by Application 2020 & 2033
- Table 50: Argentina Potassium Permanganate Industry Volume (Billion) Forecast, by Application 2020 & 2033
- Table 51: Rest of South America Potassium Permanganate Industry Revenue (Million) Forecast, by Application 2020 & 2033
- Table 52: Rest of South America Potassium Permanganate Industry Volume (Billion) Forecast, by Application 2020 & 2033
- Table 53: Global Potassium Permanganate Industry Revenue Million Forecast, by End-user Industry 2020 & 2033
- Table 54: Global Potassium Permanganate Industry Volume Billion Forecast, by End-user Industry 2020 & 2033
- Table 55: Global Potassium Permanganate Industry Revenue Million Forecast, by Country 2020 & 2033
- Table 56: Global Potassium Permanganate Industry Volume Billion Forecast, by Country 2020 & 2033
- Table 57: Saudi Arabia Potassium Permanganate Industry Revenue (Million) Forecast, by Application 2020 & 2033
- Table 58: Saudi Arabia Potassium Permanganate Industry Volume (Billion) Forecast, by Application 2020 & 2033
- Table 59: South Africa Potassium Permanganate Industry Revenue (Million) Forecast, by Application 2020 & 2033
- Table 60: South Africa Potassium Permanganate Industry Volume (Billion) Forecast, by Application 2020 & 2033
- Table 61: Rest of Middle East and Africa Potassium Permanganate Industry Revenue (Million) Forecast, by Application 2020 & 2033
- Table 62: Rest of Middle East and Africa Potassium Permanganate Industry Volume (Billion) Forecast, by Application 2020 & 2033
Frequently Asked Questions
1. What is the projected Compound Annual Growth Rate (CAGR) of the Potassium Permanganate Industry?
The projected CAGR is approximately 4.11%.
2. Which companies are prominent players in the Potassium Permanganate Industry?
Key companies in the market include Carus Group Inc, Changsha Yonta, Chongqing Changyuan Group Limited, GFS Chemicals Inc, Guangdong Hangxin Technology Co Ltd, Libox Chem (India) Pvt Ltd, Magnesia, Milport Enterprises Inc, Nippon Chemical Industrial CO LTD, Otto Chemie Pvt Ltd, Univar Solutions Inc, Universal Chemicals & Industries Pvt Ltd *List Not Exhaustive.
3. What are the main segments of the Potassium Permanganate Industry?
The market segments include End-user Industry.
4. Can you provide details about the market size?
The market size is estimated to be USD 0.93 Million as of 2022.
5. What are some drivers contributing to market growth?
Growing Need for High-Quality Water Treatment; Increasing Usage in the Pharmaceutical Industry; Other Drivers.
6. What are the notable trends driving market growth?
Growing Demand from Pharmaceutical Industry.
7. Are there any restraints impacting market growth?
Growing Need for High-Quality Water Treatment; Increasing Usage in the Pharmaceutical Industry; Other Drivers.
8. Can you provide examples of recent developments in the market?
Recent developments in the market studied will be covered in the complete report.
9. What pricing options are available for accessing the report?
Pricing options include single-user, multi-user, and enterprise licenses priced at USD 4750, USD 5250, and USD 8750 respectively.
10. Is the market size provided in terms of value or volume?
The market size is provided in terms of value, measured in Million and volume, measured in Billion.
11. Are there any specific market keywords associated with the report?
Yes, the market keyword associated with the report is "Potassium Permanganate Industry," which aids in identifying and referencing the specific market segment covered.
12. How do I determine which pricing option suits my needs best?
The pricing options vary based on user requirements and access needs. Individual users may opt for single-user licenses, while businesses requiring broader access may choose multi-user or enterprise licenses for cost-effective access to the report.
13. Are there any additional resources or data provided in the Potassium Permanganate Industry report?
While the report offers comprehensive insights, it's advisable to review the specific contents or supplementary materials provided to ascertain if additional resources or data are available.
14. How can I stay updated on further developments or reports in the Potassium Permanganate Industry?
To stay informed about further developments, trends, and reports in the Potassium Permanganate Industry, consider subscribing to industry newsletters, following relevant companies and organizations, or regularly checking reputable industry news sources and publications.
Methodology
Step 1 - Identification of Relevant Samples Size from Population Database


Step 2 - Approaches for Defining Global Market Size (Value, Volume* & Price*)

Note*: In applicable scenarios
Step 3 - Data Sources
Primary Research
- Web Analytics
- Survey Reports
- Research Institute
- Latest Research Reports
- Opinion Leaders
Secondary Research
- Annual Reports
- White Paper
- Latest Press Release
- Industry Association
- Paid Database
- Investor Presentations

Step 4 - Data Triangulation
Involves using different sources of information in order to increase the validity of a study
These sources are likely to be stakeholders in a program - participants, other researchers, program staff, other community members, and so on.
Then we put all data in single framework & apply various statistical tools to find out the dynamic on the market.
During the analysis stage, feedback from the stakeholder groups would be compared to determine areas of agreement as well as areas of divergence