

Key Insights
The AI in Medical Imaging market is experiencing explosive growth, projected to reach a substantial size driven by the increasing adoption of AI-powered diagnostic tools and the rising prevalence of chronic diseases. The market, valued at $5.86 billion in 2025, is expected to exhibit a robust Compound Annual Growth Rate (CAGR) of 28.32% from 2025 to 2033. This rapid expansion is fueled by several key factors. Firstly, AI algorithms offer improved diagnostic accuracy and efficiency compared to traditional methods, leading to faster and more informed clinical decisions. Secondly, the increasing availability of large, high-quality medical image datasets is crucial for training and validating sophisticated AI models, facilitating continuous advancements in the field. Thirdly, the growing demand for remote patient monitoring and telehealth solutions is further propelling the adoption of AI-based imaging analysis, allowing for timely diagnosis and treatment even in geographically remote areas. Technological advancements, including the development of more powerful and accessible computing resources, are also significantly contributing to market expansion. Furthermore, strategic collaborations between technology companies, healthcare providers, and research institutions are accelerating innovation and market penetration.
The market segmentation reveals a diverse landscape. Software tools and platforms currently dominate the offering segment, although the services segment is expected to see significant growth driven by increasing demand for customized AI solutions and expert support. Among image acquisition technologies, X-ray, CT, and MRI currently hold significant market share due to their widespread use and established integration into healthcare workflows. However, the adoption of AI in ultrasound and molecular imaging is rapidly increasing, offering promising applications in early disease detection and personalized medicine. Hospitals and clinics constitute the largest end-user segment, followed by research laboratories and diagnostic centers. Key players like GE Healthcare, Siemens Healthineers, Philips Healthcare, and emerging companies like Zebra Medical Vision and Enlitic are driving innovation and competition within the market. While data privacy and regulatory hurdles present challenges, the overall market outlook remains overwhelmingly positive, driven by the compelling benefits of AI-powered medical imaging in improving patient care and healthcare efficiency.

AI in Medical Imaging Industry Market Report: 2019-2033
This comprehensive report provides a detailed analysis of the AI in Medical Imaging industry, covering market dynamics, growth trends, key players, and future outlook. The study period spans from 2019 to 2033, with 2025 as the base and estimated year. The report segments the market by offering (Software Tools/Platform, Services), image acquisition technology (X-Ray, CT, MRI, Ultrasound, Molecular Imaging), and end-user (Hospitals, Clinics, Research Labs & Diagnostic Centers, Other). The global market size is projected to reach xx Million by 2033, exhibiting a significant CAGR.
AI in Medical Imaging Industry Market Dynamics & Structure
The AI in Medical Imaging market is characterized by high growth potential, driven by technological advancements and increasing demand for improved diagnostic accuracy and efficiency. Market concentration is moderate, with several key players competing alongside numerous smaller companies focusing on niche applications. Technological innovation, particularly in deep learning and computer vision, is a primary driver, constantly improving image analysis and diagnostic capabilities. Regulatory frameworks, such as FDA approvals for AI-based medical devices, play a crucial role in market development. The market also faces challenges from the emergence of competitive product substitutes and the complexity of integrating AI into existing healthcare workflows. Mergers and acquisitions (M&A) activity is prevalent, with larger companies seeking to expand their product portfolios and market share.
- Market Concentration: Moderately concentrated, with a few major players holding significant shares, but a substantial presence of smaller, specialized firms.
- Technological Innovation Drivers: Deep learning, computer vision, cloud computing, and big data analytics are accelerating innovation.
- Regulatory Frameworks: FDA approvals and other regulatory guidelines shape product development and market entry.
- Competitive Product Substitutes: Traditional diagnostic methods and emerging technologies pose competitive pressures.
- End-User Demographics: Hospitals and diagnostic centers represent the largest segment of end-users, followed by clinics and research laboratories.
- M&A Trends: Significant M&A activity is observed, indicating consolidation and expansion strategies among major players. The volume of M&A deals in the last five years has been approximately xx (Million).
AI in Medical Imaging Industry Growth Trends & Insights
The AI in Medical Imaging market has witnessed remarkable growth during the historical period (2019-2024), driven by factors such as increasing prevalence of chronic diseases, rising demand for accurate and timely diagnoses, and advancements in AI technologies. The market size has grown from xx Million in 2019 to xx Million in 2024, exhibiting a CAGR of xx%. This upward trajectory is expected to continue throughout the forecast period (2025-2033), with the market size projected to reach xx Million by 2033. Technological advancements, including the development of more sophisticated algorithms and improved computational capabilities, are key drivers of growth. Furthermore, the increasing adoption of AI-based imaging solutions by hospitals and diagnostic centers is accelerating market penetration. Consumer behavior is shifting towards a preference for faster, more accurate, and less invasive diagnostic methods, driving demand for AI-powered imaging technologies. Market penetration is currently at xx% and is expected to reach xx% by 2033.

Dominant Regions, Countries, or Segments in AI in Medical Imaging Industry
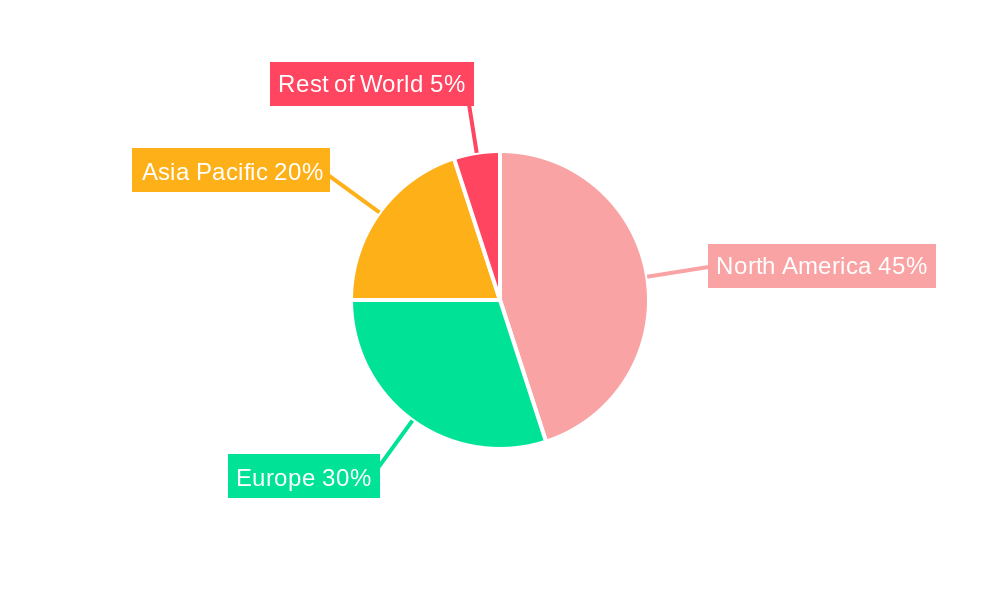
North America currently holds the largest market share in the AI in Medical Imaging industry, driven by factors such as high adoption rates, strong technological infrastructure, significant investments in R&D, and favorable regulatory environments. Europe follows as a prominent market, showcasing substantial growth potential fueled by increasing healthcare expenditure and growing awareness of AI's benefits in medical imaging. Within the segmentation, the Software Tools/Platform segment dominates the market by offering, reflecting the high demand for flexible and scalable solutions. Computed Tomography (CT) and Magnetic Resonance Imaging (MRI) hold significant shares within the image acquisition technology segment due to their widespread use and detailed image capabilities. Hospitals remain the primary end-users, reflecting the substantial volume of imaging procedures performed in these facilities.
- Key Drivers in North America: High adoption rates, robust technological infrastructure, substantial R&D investment, favorable regulatory landscape.
- Key Drivers in Europe: Increasing healthcare expenditure, growing awareness of AI benefits, strong regulatory frameworks.
- Dominant Segment (By Offering): Software Tools/Platform – due to scalability and flexibility.
- Dominant Segment (By Image Acquisition Technology): Computed Tomography (CT) and Magnetic Resonance Imaging (MRI).
- Dominant Segment (By End-User): Hospitals – due to high volume of imaging procedures.
AI in Medical Imaging Industry Product Landscape
The AI in Medical Imaging product landscape is marked by a diverse range of software tools, platforms, and services designed to enhance various aspects of medical imaging. These offerings encompass automated image analysis, disease detection, and diagnostic support systems. Key product innovations include AI-powered image reconstruction algorithms that improve image quality, reduce radiation exposure, and accelerate diagnostic workflows. Furthermore, advancements in deep learning techniques are leading to higher diagnostic accuracy and improved efficiency. Unique selling propositions include faster processing times, increased diagnostic accuracy, and the ability to detect subtle abnormalities often missed by the human eye.
Key Drivers, Barriers & Challenges in AI in Medical Imaging Industry
Key Drivers:
- Technological advancements in AI and machine learning algorithms are improving diagnostic accuracy and efficiency.
- Rising prevalence of chronic diseases is increasing the demand for accurate and timely diagnosis.
- Growing investments in healthcare infrastructure are creating opportunities for AI adoption.
- Favorable regulatory environments in several countries are facilitating market expansion.
Key Challenges & Restraints:
- High initial investment costs associated with AI-based imaging systems can be a barrier to adoption.
- Regulatory hurdles and data privacy concerns are slowing down market penetration.
- Lack of skilled professionals capable of implementing and managing AI-based imaging systems represents a significant challenge. The shortage of trained professionals is estimated to impact market growth by approximately xx% by 2030.
- Intense competition among various companies is creating pricing pressures.
Emerging Opportunities in AI in Medical Imaging Industry
Emerging opportunities include the expansion of AI-powered imaging into new clinical areas, such as personalized medicine and preventative care. The development of AI algorithms for specific diseases or patient populations is also a promising area. Moreover, the integration of AI with other healthcare technologies, such as telehealth and wearable sensors, is expected to create new opportunities. Untapped markets in developing countries represent a significant growth potential.
Growth Accelerators in the AI in Medical Imaging Industry
Long-term growth in the AI in Medical Imaging market will be driven by continued advancements in AI algorithms, increasing adoption of cloud-based solutions, strategic partnerships between technology companies and healthcare providers, and expansion into new geographic markets. Government initiatives promoting digital health and AI adoption will further accelerate market growth. The development of more user-friendly interfaces will increase accessibility and ease of use.
Key Players Shaping the AI in Medical Imaging Market
- GE Healthcare
- Samsung Electronics Co Ltd
- Philips Healthcare
- Siemens Healthineers AG
- EchoNous Inc
- BenevolentAI Limited
- Oxipit ai
- Zebra Medical Vision Inc
- Medtronic Plc
- Enlitic Inc
- Nvidia Corporation
- IBM Watson Health
Notable Milestones in AI in Medical Imaging Industry Sector
- November 2022: Royal Philips showcased AI-powered diagnostic equipment and workflow solutions at the RSNA conference, highlighting advancements in patient-centric imaging services.
- July 2022: Exo acquired Medo, integrating Medo's Sweep AI technology to enhance ultrasound imaging accessibility and efficiency.
In-Depth AI in Medical Imaging Industry Market Outlook
The future of the AI in Medical Imaging market is exceptionally promising, driven by continued technological advancements, expanding applications, and increasing adoption across various healthcare settings. Strategic partnerships between technology companies and healthcare providers will be crucial for driving growth and innovation. The market's potential lies in personalized medicine, early disease detection, and improved patient outcomes. Significant opportunities exist in untapped markets and through the development of novel AI-powered diagnostic tools.
AI in Medical Imaging Industry Segmentation
-
1. Offering
- 1.1. Software Tools/Platform
- 1.2. Services
-
2. Image Acquisition Technology
- 2.1. X-Ray
- 2.2. Computed Tomography
- 2.3. Magnetic Resonance Imaging
- 2.4. Ultrasound Imaging
- 2.5. Molecular Imaging
-
3. End User
- 3.1. Hospitals
- 3.2. Clinics
- 3.3. Research Laboratories & Diagnostic Centers
- 3.4. Other End Users
AI in Medical Imaging Industry Segmentation By Geography
-
1. North America
- 1.1. United States
- 1.2. Canada
-
2. Europe
- 2.1. Germany
- 2.2. France
- 2.3. United Kingdom
- 2.4. Rest of Europe
-
3. Asia Pacific
- 3.1. India
- 3.2. China
- 3.3. Japan
- 3.4. Rest of Asia Pacific
- 4. Rest of the World
AI in Medical Imaging Industry REPORT HIGHLIGHTS
| Aspects | Details |
|---|---|
| Study Period | 2019-2033 |
| Base Year | 2024 |
| Estimated Year | 2025 |
| Forecast Period | 2025-2033 |
| Historical Period | 2019-2024 |
| Growth Rate | CAGR of 28.32% from 2019-2033 |
| Segmentation |
|
Table of Contents
- 1. Introduction
- 1.1. Research Scope
- 1.2. Market Segmentation
- 1.3. Research Methodology
- 1.4. Definitions and Assumptions
- 2. Executive Summary
- 2.1. Introduction
- 3. Market Dynamics
- 3.1. Introduction
- 3.2. Market Drivers
- 3.2.1. Increasing Imaging Volumes
- 3.3. Market Restrains
- 3.3.1. Increasing Complexity Coupled with High Initial Costs and Maintenance Costs
- 3.4. Market Trends
- 3.4.1. Computed Tomography is Expected to Drive the Market Growth
- 4. Market Factor Analysis
- 4.1. Porters Five Forces
- 4.2. Supply/Value Chain
- 4.3. PESTEL analysis
- 4.4. Market Entropy
- 4.5. Patent/Trademark Analysis
- 5. Global AI in Medical Imaging Industry Analysis, Insights and Forecast, 2019-2031
- 5.1. Market Analysis, Insights and Forecast - by Offering
- 5.1.1. Software Tools/Platform
- 5.1.2. Services
- 5.2. Market Analysis, Insights and Forecast - by Image Acquisition Technology
- 5.2.1. X-Ray
- 5.2.2. Computed Tomography
- 5.2.3. Magnetic Resonance Imaging
- 5.2.4. Ultrasound Imaging
- 5.2.5. Molecular Imaging
- 5.3. Market Analysis, Insights and Forecast - by End User
- 5.3.1. Hospitals
- 5.3.2. Clinics
- 5.3.3. Research Laboratories & Diagnostic Centers
- 5.3.4. Other End Users
- 5.4. Market Analysis, Insights and Forecast - by Region
- 5.4.1. North America
- 5.4.2. Europe
- 5.4.3. Asia Pacific
- 5.4.4. Rest of the World
- 5.1. Market Analysis, Insights and Forecast - by Offering
- 6. North America AI in Medical Imaging Industry Analysis, Insights and Forecast, 2019-2031
- 6.1. Market Analysis, Insights and Forecast - by Offering
- 6.1.1. Software Tools/Platform
- 6.1.2. Services
- 6.2. Market Analysis, Insights and Forecast - by Image Acquisition Technology
- 6.2.1. X-Ray
- 6.2.2. Computed Tomography
- 6.2.3. Magnetic Resonance Imaging
- 6.2.4. Ultrasound Imaging
- 6.2.5. Molecular Imaging
- 6.3. Market Analysis, Insights and Forecast - by End User
- 6.3.1. Hospitals
- 6.3.2. Clinics
- 6.3.3. Research Laboratories & Diagnostic Centers
- 6.3.4. Other End Users
- 6.1. Market Analysis, Insights and Forecast - by Offering
- 7. Europe AI in Medical Imaging Industry Analysis, Insights and Forecast, 2019-2031
- 7.1. Market Analysis, Insights and Forecast - by Offering
- 7.1.1. Software Tools/Platform
- 7.1.2. Services
- 7.2. Market Analysis, Insights and Forecast - by Image Acquisition Technology
- 7.2.1. X-Ray
- 7.2.2. Computed Tomography
- 7.2.3. Magnetic Resonance Imaging
- 7.2.4. Ultrasound Imaging
- 7.2.5. Molecular Imaging
- 7.3. Market Analysis, Insights and Forecast - by End User
- 7.3.1. Hospitals
- 7.3.2. Clinics
- 7.3.3. Research Laboratories & Diagnostic Centers
- 7.3.4. Other End Users
- 7.1. Market Analysis, Insights and Forecast - by Offering
- 8. Asia Pacific AI in Medical Imaging Industry Analysis, Insights and Forecast, 2019-2031
- 8.1. Market Analysis, Insights and Forecast - by Offering
- 8.1.1. Software Tools/Platform
- 8.1.2. Services
- 8.2. Market Analysis, Insights and Forecast - by Image Acquisition Technology
- 8.2.1. X-Ray
- 8.2.2. Computed Tomography
- 8.2.3. Magnetic Resonance Imaging
- 8.2.4. Ultrasound Imaging
- 8.2.5. Molecular Imaging
- 8.3. Market Analysis, Insights and Forecast - by End User
- 8.3.1. Hospitals
- 8.3.2. Clinics
- 8.3.3. Research Laboratories & Diagnostic Centers
- 8.3.4. Other End Users
- 8.1. Market Analysis, Insights and Forecast - by Offering
- 9. Rest of the World AI in Medical Imaging Industry Analysis, Insights and Forecast, 2019-2031
- 9.1. Market Analysis, Insights and Forecast - by Offering
- 9.1.1. Software Tools/Platform
- 9.1.2. Services
- 9.2. Market Analysis, Insights and Forecast - by Image Acquisition Technology
- 9.2.1. X-Ray
- 9.2.2. Computed Tomography
- 9.2.3. Magnetic Resonance Imaging
- 9.2.4. Ultrasound Imaging
- 9.2.5. Molecular Imaging
- 9.3. Market Analysis, Insights and Forecast - by End User
- 9.3.1. Hospitals
- 9.3.2. Clinics
- 9.3.3. Research Laboratories & Diagnostic Centers
- 9.3.4. Other End Users
- 9.1. Market Analysis, Insights and Forecast - by Offering
- 10. North America AI in Medical Imaging Industry Analysis, Insights and Forecast, 2019-2031
- 10.1. Market Analysis, Insights and Forecast - By Country/Sub-region
- 10.1.1 United States
- 10.1.2 Canada
- 11. Europe AI in Medical Imaging Industry Analysis, Insights and Forecast, 2019-2031
- 11.1. Market Analysis, Insights and Forecast - By Country/Sub-region
- 11.1.1 Germany
- 11.1.2 France
- 11.1.3 United Kingdom
- 11.1.4 Rest of Europe
- 12. Asia Pacific AI in Medical Imaging Industry Analysis, Insights and Forecast, 2019-2031
- 12.1. Market Analysis, Insights and Forecast - By Country/Sub-region
- 12.1.1 India
- 12.1.2 China
- 12.1.3 Japan
- 12.1.4 Rest of Asia Pacific
- 13. Rest of the World AI in Medical Imaging Industry Analysis, Insights and Forecast, 2019-2031
- 13.1. Market Analysis, Insights and Forecast - By Country/Sub-region
- 13.1.1.
- 14. Competitive Analysis
- 14.1. Global Market Share Analysis 2024
- 14.2. Company Profiles
- 14.2.1 GE Healthcare
- 14.2.1.1. Overview
- 14.2.1.2. Products
- 14.2.1.3. SWOT Analysis
- 14.2.1.4. Recent Developments
- 14.2.1.5. Financials (Based on Availability)
- 14.2.2 Samsung Electronics Co Ltd
- 14.2.2.1. Overview
- 14.2.2.2. Products
- 14.2.2.3. SWOT Analysis
- 14.2.2.4. Recent Developments
- 14.2.2.5. Financials (Based on Availability)
- 14.2.3 Philips Healthcare
- 14.2.3.1. Overview
- 14.2.3.2. Products
- 14.2.3.3. SWOT Analysis
- 14.2.3.4. Recent Developments
- 14.2.3.5. Financials (Based on Availability)
- 14.2.4 Siemens Healthineers AG
- 14.2.4.1. Overview
- 14.2.4.2. Products
- 14.2.4.3. SWOT Analysis
- 14.2.4.4. Recent Developments
- 14.2.4.5. Financials (Based on Availability)
- 14.2.5 EchoNous Inc
- 14.2.5.1. Overview
- 14.2.5.2. Products
- 14.2.5.3. SWOT Analysis
- 14.2.5.4. Recent Developments
- 14.2.5.5. Financials (Based on Availability)
- 14.2.6 BenevolentAI Limited
- 14.2.6.1. Overview
- 14.2.6.2. Products
- 14.2.6.3. SWOT Analysis
- 14.2.6.4. Recent Developments
- 14.2.6.5. Financials (Based on Availability)
- 14.2.7 Oxipit ai*List Not Exhaustive
- 14.2.7.1. Overview
- 14.2.7.2. Products
- 14.2.7.3. SWOT Analysis
- 14.2.7.4. Recent Developments
- 14.2.7.5. Financials (Based on Availability)
- 14.2.8 Zebra Medical Vision Inc
- 14.2.8.1. Overview
- 14.2.8.2. Products
- 14.2.8.3. SWOT Analysis
- 14.2.8.4. Recent Developments
- 14.2.8.5. Financials (Based on Availability)
- 14.2.9 Medtronic Plc
- 14.2.9.1. Overview
- 14.2.9.2. Products
- 14.2.9.3. SWOT Analysis
- 14.2.9.4. Recent Developments
- 14.2.9.5. Financials (Based on Availability)
- 14.2.10 Enlitic Inc
- 14.2.10.1. Overview
- 14.2.10.2. Products
- 14.2.10.3. SWOT Analysis
- 14.2.10.4. Recent Developments
- 14.2.10.5. Financials (Based on Availability)
- 14.2.11 Nvidia Corporation
- 14.2.11.1. Overview
- 14.2.11.2. Products
- 14.2.11.3. SWOT Analysis
- 14.2.11.4. Recent Developments
- 14.2.11.5. Financials (Based on Availability)
- 14.2.12 IBM Watson Health
- 14.2.12.1. Overview
- 14.2.12.2. Products
- 14.2.12.3. SWOT Analysis
- 14.2.12.4. Recent Developments
- 14.2.12.5. Financials (Based on Availability)
- 14.2.1 GE Healthcare
List of Figures
- Figure 1: Global AI in Medical Imaging Industry Revenue Breakdown (Million, %) by Region 2024 & 2032
- Figure 2: North America AI in Medical Imaging Industry Revenue (Million), by Country 2024 & 2032
- Figure 3: North America AI in Medical Imaging Industry Revenue Share (%), by Country 2024 & 2032
- Figure 4: Europe AI in Medical Imaging Industry Revenue (Million), by Country 2024 & 2032
- Figure 5: Europe AI in Medical Imaging Industry Revenue Share (%), by Country 2024 & 2032
- Figure 6: Asia Pacific AI in Medical Imaging Industry Revenue (Million), by Country 2024 & 2032
- Figure 7: Asia Pacific AI in Medical Imaging Industry Revenue Share (%), by Country 2024 & 2032
- Figure 8: Rest of the World AI in Medical Imaging Industry Revenue (Million), by Country 2024 & 2032
- Figure 9: Rest of the World AI in Medical Imaging Industry Revenue Share (%), by Country 2024 & 2032
- Figure 10: North America AI in Medical Imaging Industry Revenue (Million), by Offering 2024 & 2032
- Figure 11: North America AI in Medical Imaging Industry Revenue Share (%), by Offering 2024 & 2032
- Figure 12: North America AI in Medical Imaging Industry Revenue (Million), by Image Acquisition Technology 2024 & 2032
- Figure 13: North America AI in Medical Imaging Industry Revenue Share (%), by Image Acquisition Technology 2024 & 2032
- Figure 14: North America AI in Medical Imaging Industry Revenue (Million), by End User 2024 & 2032
- Figure 15: North America AI in Medical Imaging Industry Revenue Share (%), by End User 2024 & 2032
- Figure 16: North America AI in Medical Imaging Industry Revenue (Million), by Country 2024 & 2032
- Figure 17: North America AI in Medical Imaging Industry Revenue Share (%), by Country 2024 & 2032
- Figure 18: Europe AI in Medical Imaging Industry Revenue (Million), by Offering 2024 & 2032
- Figure 19: Europe AI in Medical Imaging Industry Revenue Share (%), by Offering 2024 & 2032
- Figure 20: Europe AI in Medical Imaging Industry Revenue (Million), by Image Acquisition Technology 2024 & 2032
- Figure 21: Europe AI in Medical Imaging Industry Revenue Share (%), by Image Acquisition Technology 2024 & 2032
- Figure 22: Europe AI in Medical Imaging Industry Revenue (Million), by End User 2024 & 2032
- Figure 23: Europe AI in Medical Imaging Industry Revenue Share (%), by End User 2024 & 2032
- Figure 24: Europe AI in Medical Imaging Industry Revenue (Million), by Country 2024 & 2032
- Figure 25: Europe AI in Medical Imaging Industry Revenue Share (%), by Country 2024 & 2032
- Figure 26: Asia Pacific AI in Medical Imaging Industry Revenue (Million), by Offering 2024 & 2032
- Figure 27: Asia Pacific AI in Medical Imaging Industry Revenue Share (%), by Offering 2024 & 2032
- Figure 28: Asia Pacific AI in Medical Imaging Industry Revenue (Million), by Image Acquisition Technology 2024 & 2032
- Figure 29: Asia Pacific AI in Medical Imaging Industry Revenue Share (%), by Image Acquisition Technology 2024 & 2032
- Figure 30: Asia Pacific AI in Medical Imaging Industry Revenue (Million), by End User 2024 & 2032
- Figure 31: Asia Pacific AI in Medical Imaging Industry Revenue Share (%), by End User 2024 & 2032
- Figure 32: Asia Pacific AI in Medical Imaging Industry Revenue (Million), by Country 2024 & 2032
- Figure 33: Asia Pacific AI in Medical Imaging Industry Revenue Share (%), by Country 2024 & 2032
- Figure 34: Rest of the World AI in Medical Imaging Industry Revenue (Million), by Offering 2024 & 2032
- Figure 35: Rest of the World AI in Medical Imaging Industry Revenue Share (%), by Offering 2024 & 2032
- Figure 36: Rest of the World AI in Medical Imaging Industry Revenue (Million), by Image Acquisition Technology 2024 & 2032
- Figure 37: Rest of the World AI in Medical Imaging Industry Revenue Share (%), by Image Acquisition Technology 2024 & 2032
- Figure 38: Rest of the World AI in Medical Imaging Industry Revenue (Million), by End User 2024 & 2032
- Figure 39: Rest of the World AI in Medical Imaging Industry Revenue Share (%), by End User 2024 & 2032
- Figure 40: Rest of the World AI in Medical Imaging Industry Revenue (Million), by Country 2024 & 2032
- Figure 41: Rest of the World AI in Medical Imaging Industry Revenue Share (%), by Country 2024 & 2032
List of Tables
- Table 1: Global AI in Medical Imaging Industry Revenue Million Forecast, by Region 2019 & 2032
- Table 2: Global AI in Medical Imaging Industry Revenue Million Forecast, by Offering 2019 & 2032
- Table 3: Global AI in Medical Imaging Industry Revenue Million Forecast, by Image Acquisition Technology 2019 & 2032
- Table 4: Global AI in Medical Imaging Industry Revenue Million Forecast, by End User 2019 & 2032
- Table 5: Global AI in Medical Imaging Industry Revenue Million Forecast, by Region 2019 & 2032
- Table 6: Global AI in Medical Imaging Industry Revenue Million Forecast, by Country 2019 & 2032
- Table 7: United States AI in Medical Imaging Industry Revenue (Million) Forecast, by Application 2019 & 2032
- Table 8: Canada AI in Medical Imaging Industry Revenue (Million) Forecast, by Application 2019 & 2032
- Table 9: Global AI in Medical Imaging Industry Revenue Million Forecast, by Country 2019 & 2032
- Table 10: Germany AI in Medical Imaging Industry Revenue (Million) Forecast, by Application 2019 & 2032
- Table 11: France AI in Medical Imaging Industry Revenue (Million) Forecast, by Application 2019 & 2032
- Table 12: United Kingdom AI in Medical Imaging Industry Revenue (Million) Forecast, by Application 2019 & 2032
- Table 13: Rest of Europe AI in Medical Imaging Industry Revenue (Million) Forecast, by Application 2019 & 2032
- Table 14: Global AI in Medical Imaging Industry Revenue Million Forecast, by Country 2019 & 2032
- Table 15: India AI in Medical Imaging Industry Revenue (Million) Forecast, by Application 2019 & 2032
- Table 16: China AI in Medical Imaging Industry Revenue (Million) Forecast, by Application 2019 & 2032
- Table 17: Japan AI in Medical Imaging Industry Revenue (Million) Forecast, by Application 2019 & 2032
- Table 18: Rest of Asia Pacific AI in Medical Imaging Industry Revenue (Million) Forecast, by Application 2019 & 2032
- Table 19: Global AI in Medical Imaging Industry Revenue Million Forecast, by Country 2019 & 2032
- Table 20: AI in Medical Imaging Industry Revenue (Million) Forecast, by Application 2019 & 2032
- Table 21: Global AI in Medical Imaging Industry Revenue Million Forecast, by Offering 2019 & 2032
- Table 22: Global AI in Medical Imaging Industry Revenue Million Forecast, by Image Acquisition Technology 2019 & 2032
- Table 23: Global AI in Medical Imaging Industry Revenue Million Forecast, by End User 2019 & 2032
- Table 24: Global AI in Medical Imaging Industry Revenue Million Forecast, by Country 2019 & 2032
- Table 25: United States AI in Medical Imaging Industry Revenue (Million) Forecast, by Application 2019 & 2032
- Table 26: Canada AI in Medical Imaging Industry Revenue (Million) Forecast, by Application 2019 & 2032
- Table 27: Global AI in Medical Imaging Industry Revenue Million Forecast, by Offering 2019 & 2032
- Table 28: Global AI in Medical Imaging Industry Revenue Million Forecast, by Image Acquisition Technology 2019 & 2032
- Table 29: Global AI in Medical Imaging Industry Revenue Million Forecast, by End User 2019 & 2032
- Table 30: Global AI in Medical Imaging Industry Revenue Million Forecast, by Country 2019 & 2032
- Table 31: Germany AI in Medical Imaging Industry Revenue (Million) Forecast, by Application 2019 & 2032
- Table 32: France AI in Medical Imaging Industry Revenue (Million) Forecast, by Application 2019 & 2032
- Table 33: United Kingdom AI in Medical Imaging Industry Revenue (Million) Forecast, by Application 2019 & 2032
- Table 34: Rest of Europe AI in Medical Imaging Industry Revenue (Million) Forecast, by Application 2019 & 2032
- Table 35: Global AI in Medical Imaging Industry Revenue Million Forecast, by Offering 2019 & 2032
- Table 36: Global AI in Medical Imaging Industry Revenue Million Forecast, by Image Acquisition Technology 2019 & 2032
- Table 37: Global AI in Medical Imaging Industry Revenue Million Forecast, by End User 2019 & 2032
- Table 38: Global AI in Medical Imaging Industry Revenue Million Forecast, by Country 2019 & 2032
- Table 39: India AI in Medical Imaging Industry Revenue (Million) Forecast, by Application 2019 & 2032
- Table 40: China AI in Medical Imaging Industry Revenue (Million) Forecast, by Application 2019 & 2032
- Table 41: Japan AI in Medical Imaging Industry Revenue (Million) Forecast, by Application 2019 & 2032
- Table 42: Rest of Asia Pacific AI in Medical Imaging Industry Revenue (Million) Forecast, by Application 2019 & 2032
- Table 43: Global AI in Medical Imaging Industry Revenue Million Forecast, by Offering 2019 & 2032
- Table 44: Global AI in Medical Imaging Industry Revenue Million Forecast, by Image Acquisition Technology 2019 & 2032
- Table 45: Global AI in Medical Imaging Industry Revenue Million Forecast, by End User 2019 & 2032
- Table 46: Global AI in Medical Imaging Industry Revenue Million Forecast, by Country 2019 & 2032
Frequently Asked Questions
1. What is the projected Compound Annual Growth Rate (CAGR) of the AI in Medical Imaging Industry?
The projected CAGR is approximately 28.32%.
2. Which companies are prominent players in the AI in Medical Imaging Industry?
Key companies in the market include GE Healthcare, Samsung Electronics Co Ltd, Philips Healthcare, Siemens Healthineers AG, EchoNous Inc, BenevolentAI Limited, Oxipit ai*List Not Exhaustive, Zebra Medical Vision Inc, Medtronic Plc, Enlitic Inc, Nvidia Corporation, IBM Watson Health.
3. What are the main segments of the AI in Medical Imaging Industry?
The market segments include Offering, Image Acquisition Technology, End User.
4. Can you provide details about the market size?
The market size is estimated to be USD 5.86 Million as of 2022.
5. What are some drivers contributing to market growth?
Increasing Imaging Volumes.
6. What are the notable trends driving market growth?
Computed Tomography is Expected to Drive the Market Growth.
7. Are there any restraints impacting market growth?
Increasing Complexity Coupled with High Initial Costs and Maintenance Costs.
8. Can you provide examples of recent developments in the market?
November 2022 - The annual conference of the Radiological Society of North America (RSNA) presented a portfolio of smart diagnostic equipment and disruptive workflow solutions from Royal Philips, a leading global provider of health technology. The firm will deliver its most current systems and informatics solutions powered by AI that enable providers to offer high-quality imaging services that are patient-centric quickly.
9. What pricing options are available for accessing the report?
Pricing options include single-user, multi-user, and enterprise licenses priced at USD 4750, USD 5250, and USD 8750 respectively.
10. Is the market size provided in terms of value or volume?
The market size is provided in terms of value, measured in Million.
11. Are there any specific market keywords associated with the report?
Yes, the market keyword associated with the report is "AI in Medical Imaging Industry," which aids in identifying and referencing the specific market segment covered.
12. How do I determine which pricing option suits my needs best?
The pricing options vary based on user requirements and access needs. Individual users may opt for single-user licenses, while businesses requiring broader access may choose multi-user or enterprise licenses for cost-effective access to the report.
13. Are there any additional resources or data provided in the AI in Medical Imaging Industry report?
While the report offers comprehensive insights, it's advisable to review the specific contents or supplementary materials provided to ascertain if additional resources or data are available.
14. How can I stay updated on further developments or reports in the AI in Medical Imaging Industry?
To stay informed about further developments, trends, and reports in the AI in Medical Imaging Industry, consider subscribing to industry newsletters, following relevant companies and organizations, or regularly checking reputable industry news sources and publications.
Methodology
Step 1 - Identification of Relevant Samples Size from Population Database


Step 2 - Approaches for Defining Global Market Size (Value, Volume* & Price*)

Note*: In applicable scenarios
Step 3 - Data Sources
Primary Research
- Web Analytics
- Survey Reports
- Research Institute
- Latest Research Reports
- Opinion Leaders
Secondary Research
- Annual Reports
- White Paper
- Latest Press Release
- Industry Association
- Paid Database
- Investor Presentations

Step 4 - Data Triangulation
Involves using different sources of information in order to increase the validity of a study
These sources are likely to be stakeholders in a program - participants, other researchers, program staff, other community members, and so on.
Then we put all data in single framework & apply various statistical tools to find out the dynamic on the market.
During the analysis stage, feedback from the stakeholder groups would be compared to determine areas of agreement as well as areas of divergence
