

Key Insights
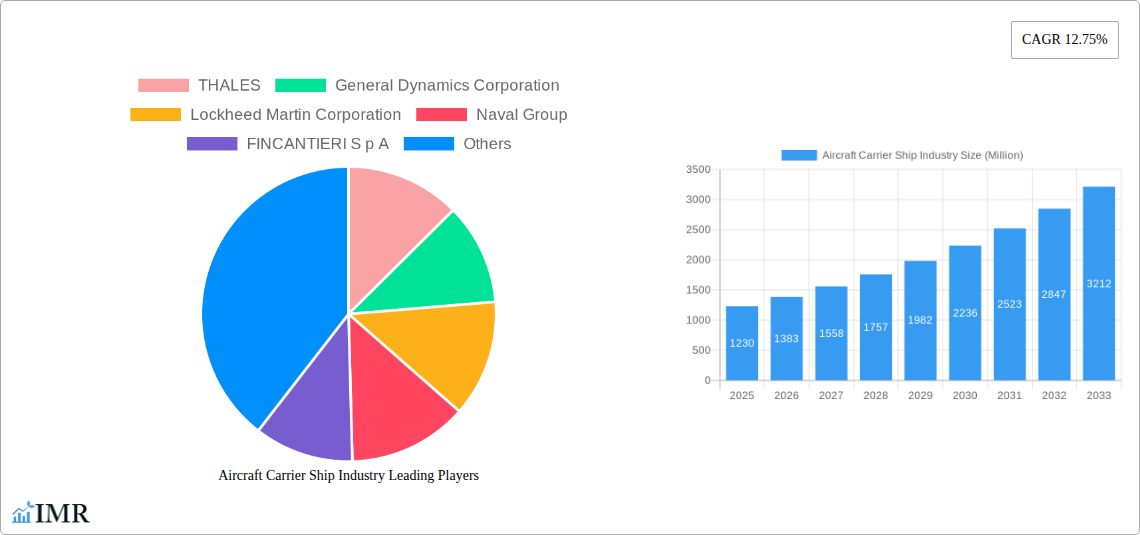
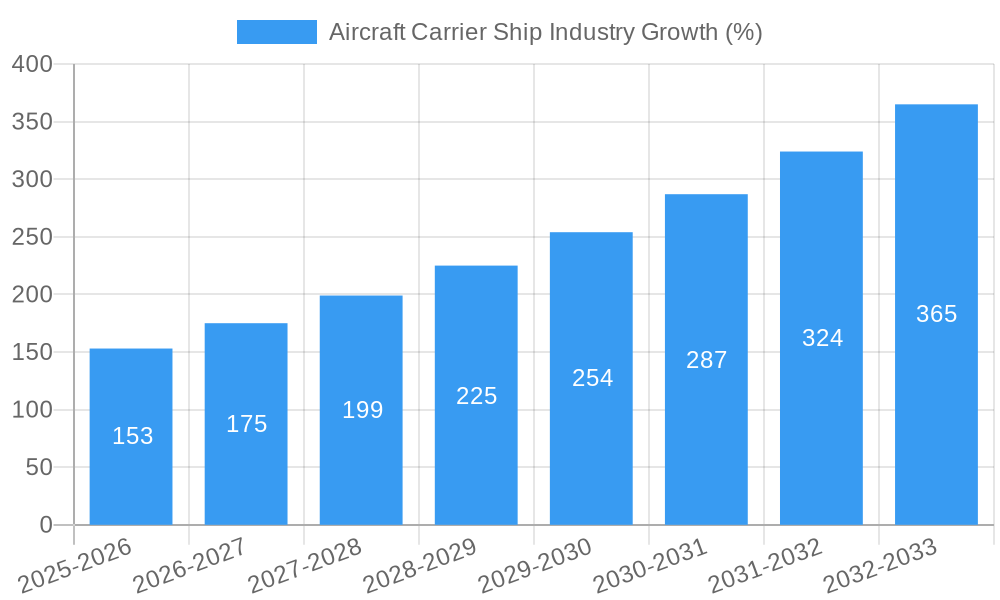
The aircraft carrier ship industry is experiencing robust growth, driven by escalating geopolitical tensions and the need for advanced naval capabilities among major global powers. The market, valued at $1.23 billion in 2025, is projected to exhibit a Compound Annual Growth Rate (CAGR) of 12.75% from 2025 to 2033. This expansion is fueled by several key factors. Firstly, the ongoing modernization and expansion of naval fleets worldwide are creating significant demand for new and upgraded aircraft carriers. Secondly, technological advancements, including the development of more powerful propulsion systems (nuclear and conventional) and advanced catapult launch systems (CATOBAR, STOBAR, STOVL), are enhancing the operational capabilities and effectiveness of these vessels. This drives further investment and procurement by nations seeking to maintain a strategic advantage. Furthermore, the increasing focus on power projection and rapid response capabilities is prompting navies to invest in more sophisticated and versatile carrier designs, such as amphibious assault ships and helicopter carriers. While the industry faces challenges such as high procurement costs and complex technological integration, the strong geopolitical drivers and technological innovations are expected to outweigh these restraints and sustain the market's positive trajectory.
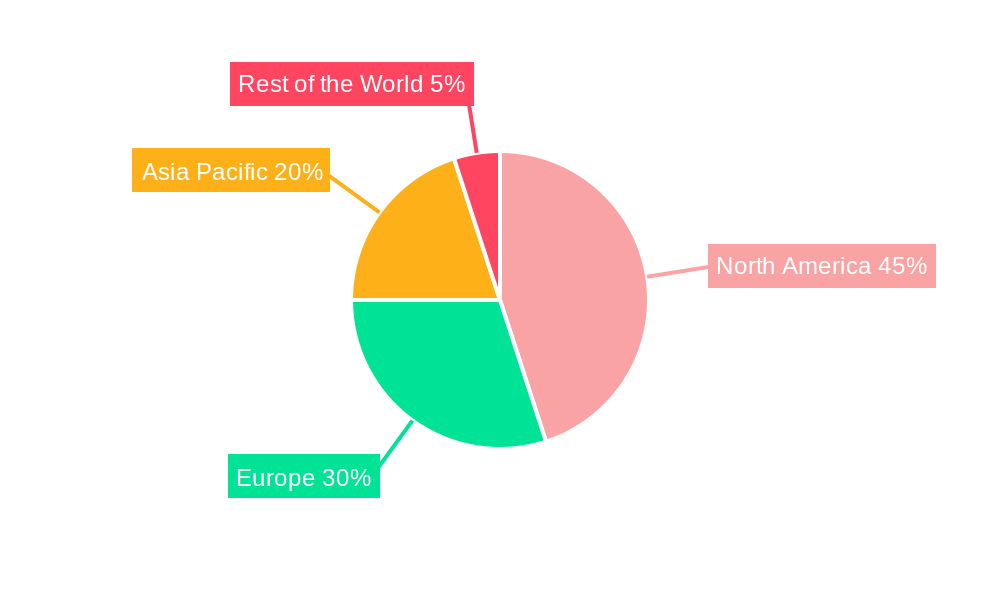
The segmentation of the market reveals notable trends. Nuclear-powered carriers are expected to command a premium share due to their superior range and operational endurance, although the high development and maintenance costs may limit their adoption by some nations. CATOBAR systems, despite their complexity, offer unmatched aircraft launch and recovery capabilities, making them the favored option for large, high-capacity fleets. However, STOBAR and STOVL configurations continue to gain traction due to their cost-effectiveness and suitability for smaller-sized carriers. Regional analysis indicates that North America and Asia-Pacific are likely to dominate the market, driven by significant military spending and the presence of key industry players such as the U.S., China, and other nations in the region. European nations also represent a key segment, although market growth may be relatively moderated due to economic considerations and various geopolitical factors. The competition within the industry is fierce, with major players like Thales, General Dynamics, Lockheed Martin, and others vying for market share through technological innovation and strategic partnerships.
Aircraft Carrier Ship Industry Market Report: 2019-2033
This comprehensive report provides an in-depth analysis of the Aircraft Carrier Ship industry, encompassing market dynamics, growth trends, regional analysis, product landscape, key players, and future outlook. The study period covers 2019-2033, with a base year of 2025 and a forecast period of 2025-2033. The report analyzes the parent market of defense shipbuilding and the child market of aircraft carriers, offering granular insights for industry professionals and investors.
Aircraft Carrier Ship Industry Market Dynamics & Structure
The aircraft carrier ship market is characterized by high capital expenditure, long lead times, and significant technological complexities. Market concentration is relatively low, with several major players competing globally. Technological innovation, particularly in propulsion systems (conventional vs. nuclear) and launch/recovery systems (CATOBAR, STOBAR, STOVL), is a crucial driver. Stringent regulatory frameworks, including international arms control treaties and national security policies, heavily influence market growth. Substitute products are limited, with no direct alternatives to the strategic capabilities offered by aircraft carriers. The end-user demographic is primarily limited to major navies globally. M&A activity has been relatively modest in recent years, with a total of xx deals valued at approximately xx Million in the period 2019-2024.
- Market Concentration: Moderately fragmented, with top 5 players holding approximately 60% market share (Estimated).
- Technological Innovation: Focus on Electromagnetic Aircraft Launch Systems (EMALS) and improved power generation efficiency.
- Regulatory Landscape: Stringent international and national regulations governing naval shipbuilding and weapons systems.
- Competitive Substitutes: Limited viable alternatives to the strategic capabilities of aircraft carriers.
- End-User Demographics: Predominantly major global navies (US, China, UK, France, etc.).
- M&A Trends: Consolidation is limited but expected to increase in the coming years, driven by cost pressures and technological advancements.
Aircraft Carrier Ship Industry Growth Trends & Insights
The global aircraft carrier ship market is expected to experience a Compound Annual Growth Rate (CAGR) of xx% during the forecast period (2025-2033), reaching a market size of xx Million by 2033. This growth is primarily driven by geopolitical instability, increased naval modernization programs across several countries, and the ongoing demand for power projection capabilities. Market penetration remains relatively low, with significant growth potential in emerging economies. Technological disruptions, like the adoption of EMALS and unmanned aerial vehicle integration, are driving innovation and influencing carrier design. Consumer behavior (i.e., naval procurement strategies) shifts towards advanced capabilities and cost-effectiveness will shape market dynamics in the coming years. Historical data indicates a market size of xx Million in 2019, rising to xx Million in 2024.
Dominant Regions, Countries, or Segments in Aircraft Carrier Ship Industry
The United States currently holds the dominant position in the aircraft carrier ship market, followed by China. Fleet carriers represent the largest segment by type, owing to their large aircraft carrying capacity and strategic importance. Nuclear-powered carriers are preferred by some nations for their extended operational range and endurance. CATOBAR configuration remains dominant, although STOBAR and STOVL configurations continue to gain traction. Growth drivers vary regionally, influenced by factors like geopolitical considerations, economic stability, and national security priorities.
- Leading Region: North America (primarily the US).
- Leading Country: United States.
- Leading Segment (Type): Fleet Carriers.
- Leading Segment (Technology): Nuclear Powered (in select countries).
- Leading Segment (Configuration): CATOBAR.
- Key Drivers: Geopolitical tensions, naval modernization programs, technological advancements.
Aircraft Carrier Ship Industry Product Landscape
Aircraft carriers are highly complex systems integrating advanced propulsion, power generation, aircraft handling, and command-and-control technologies. Recent product innovations include EMALS for improved aircraft launch efficiency, advanced radar systems for enhanced surveillance, and improved survivability features. The unique selling propositions of carriers include their power projection capabilities, extensive air operations platform, and inherent sea-based survivability.
Key Drivers, Barriers & Challenges in Aircraft Carrier Ship Industry
Key Drivers:
- Increasing geopolitical tensions and regional conflicts driving demand for naval power.
- Continued naval modernization programs by major global powers.
- Technological advancements in carrier design and operational capabilities.
Key Challenges and Restraints:
- High capital expenditure and long procurement lead times.
- Stringent regulatory requirements and international arms control treaties.
- Intense competition from established and emerging defense contractors.
- Supply chain disruptions potentially impacting production schedules and costs.
Emerging Opportunities in Aircraft Carrier Ship Industry
- Growth in unmanned aerial vehicle (UAV) integration and operations from carriers.
- Development of next-generation propulsion systems (e.g., hybrid electric propulsion).
- Expansion into new markets driven by increased naval budgets in certain regions.
- Exploration of alternative configurations (e.g., smaller, more agile carriers).
Growth Accelerators in the Aircraft Carrier Ship Industry
The long-term growth of the aircraft carrier industry will be fueled by continued technological advancements, strategic partnerships among defense contractors and navies, and the expansion of naval capabilities in emerging global markets. Increased investment in R&D, focused on improving operational efficiency, reducing costs, and enhancing capabilities, will be critical in sustaining future growth.
Key Players Shaping the Aircraft Carrier Ship Market
- THALES
- General Dynamics Corporation
- Lockheed Martin Corporation
- Naval Group
- FINCANTIERI S p A
- NAVANTIA S A
- Leonardo S p A
- BAE Systems plc
- Northrop Grumman Corporation
- HUNTINGTON INGALLS INDUSTRIES INC
Notable Milestones in Aircraft Carrier Ship Industry Sector
- June 2022: China launched its third advanced aircraft carrier, Fujian, incorporating an advanced electromagnetic catapult system.
- March 2023: The US Navy announced a five-and-a-half-month maintenance extension for the Nimitz-class aircraft carrier, impacting operational availability.
In-Depth Aircraft Carrier Ship Industry Market Outlook
The future of the aircraft carrier ship market looks promising, driven by sustained demand for naval power projection and ongoing technological advancements. Strategic partnerships, focused investments in R&D, and the potential for innovative carrier designs will shape the market landscape in the coming years. Emerging markets and increasing budgets for naval modernization globally present significant growth opportunities for established and emerging players.
Aircraft Carrier Ship Industry Segmentation
-
1. Type
- 1.1. Amphibious Assault Ship
- 1.2. Helicopter Carrier
- 1.3. Fleet Carrier
-
2. Technology
- 2.1. Conventional Powered
- 2.2. Nuclear Powered
-
3. Configuration
- 3.1. Catapult
- 3.2. Short Take-off but Arrested Recovery (STOBAR)
- 3.3. Short Take-off but Vertical Recovery (STOVL)
Aircraft Carrier Ship Industry Segmentation By Geography
-
1. North America
- 1.1. United States
- 1.2. Canada
-
2. Europe
- 2.1. Germany
- 2.2. United Kingdom
- 2.3. France
- 2.4. Russia
- 2.5. Rest of Europe
-
3. Asia Pacific
- 3.1. India
- 3.2. China
- 3.3. South Korea
- 3.4. Japan
- 3.5. Rest of Asia Pacific
- 4. Rest of the World
Aircraft Carrier Ship Industry REPORT HIGHLIGHTS
| Aspects | Details |
|---|---|
| Study Period | 2019-2033 |
| Base Year | 2024 |
| Estimated Year | 2025 |
| Forecast Period | 2025-2033 |
| Historical Period | 2019-2024 |
| Growth Rate | CAGR of 12.75% from 2019-2033 |
| Segmentation |
|
Table of Contents
- 1. Introduction
- 1.1. Research Scope
- 1.2. Market Segmentation
- 1.3. Research Methodology
- 1.4. Definitions and Assumptions
- 2. Executive Summary
- 2.1. Introduction
- 3. Market Dynamics
- 3.1. Introduction
- 3.2. Market Drivers
- 3.2.1. Increase in Internet of Things (IoT) and Autonomous Systems; Rise in Demand for Military and Defense Satellite Communication Solutions
- 3.3. Market Restrains
- 3.3.1. Cybersecurity Threats to Satellite Communication; Interference in Transmission of Data
- 3.4. Market Trends
- 3.4.1. The Nuclear Powered Segment to Dominate the Market
- 4. Market Factor Analysis
- 4.1. Porters Five Forces
- 4.2. Supply/Value Chain
- 4.3. PESTEL analysis
- 4.4. Market Entropy
- 4.5. Patent/Trademark Analysis
- 5. Global Aircraft Carrier Ship Industry Analysis, Insights and Forecast, 2019-2031
- 5.1. Market Analysis, Insights and Forecast - by Type
- 5.1.1. Amphibious Assault Ship
- 5.1.2. Helicopter Carrier
- 5.1.3. Fleet Carrier
- 5.2. Market Analysis, Insights and Forecast - by Technology
- 5.2.1. Conventional Powered
- 5.2.2. Nuclear Powered
- 5.3. Market Analysis, Insights and Forecast - by Configuration
- 5.3.1. Catapult
- 5.3.2. Short Take-off but Arrested Recovery (STOBAR)
- 5.3.3. Short Take-off but Vertical Recovery (STOVL)
- 5.4. Market Analysis, Insights and Forecast - by Region
- 5.4.1. North America
- 5.4.2. Europe
- 5.4.3. Asia Pacific
- 5.4.4. Rest of the World
- 5.1. Market Analysis, Insights and Forecast - by Type
- 6. North America Aircraft Carrier Ship Industry Analysis, Insights and Forecast, 2019-2031
- 6.1. Market Analysis, Insights and Forecast - by Type
- 6.1.1. Amphibious Assault Ship
- 6.1.2. Helicopter Carrier
- 6.1.3. Fleet Carrier
- 6.2. Market Analysis, Insights and Forecast - by Technology
- 6.2.1. Conventional Powered
- 6.2.2. Nuclear Powered
- 6.3. Market Analysis, Insights and Forecast - by Configuration
- 6.3.1. Catapult
- 6.3.2. Short Take-off but Arrested Recovery (STOBAR)
- 6.3.3. Short Take-off but Vertical Recovery (STOVL)
- 6.1. Market Analysis, Insights and Forecast - by Type
- 7. Europe Aircraft Carrier Ship Industry Analysis, Insights and Forecast, 2019-2031
- 7.1. Market Analysis, Insights and Forecast - by Type
- 7.1.1. Amphibious Assault Ship
- 7.1.2. Helicopter Carrier
- 7.1.3. Fleet Carrier
- 7.2. Market Analysis, Insights and Forecast - by Technology
- 7.2.1. Conventional Powered
- 7.2.2. Nuclear Powered
- 7.3. Market Analysis, Insights and Forecast - by Configuration
- 7.3.1. Catapult
- 7.3.2. Short Take-off but Arrested Recovery (STOBAR)
- 7.3.3. Short Take-off but Vertical Recovery (STOVL)
- 7.1. Market Analysis, Insights and Forecast - by Type
- 8. Asia Pacific Aircraft Carrier Ship Industry Analysis, Insights and Forecast, 2019-2031
- 8.1. Market Analysis, Insights and Forecast - by Type
- 8.1.1. Amphibious Assault Ship
- 8.1.2. Helicopter Carrier
- 8.1.3. Fleet Carrier
- 8.2. Market Analysis, Insights and Forecast - by Technology
- 8.2.1. Conventional Powered
- 8.2.2. Nuclear Powered
- 8.3. Market Analysis, Insights and Forecast - by Configuration
- 8.3.1. Catapult
- 8.3.2. Short Take-off but Arrested Recovery (STOBAR)
- 8.3.3. Short Take-off but Vertical Recovery (STOVL)
- 8.1. Market Analysis, Insights and Forecast - by Type
- 9. Rest of the World Aircraft Carrier Ship Industry Analysis, Insights and Forecast, 2019-2031
- 9.1. Market Analysis, Insights and Forecast - by Type
- 9.1.1. Amphibious Assault Ship
- 9.1.2. Helicopter Carrier
- 9.1.3. Fleet Carrier
- 9.2. Market Analysis, Insights and Forecast - by Technology
- 9.2.1. Conventional Powered
- 9.2.2. Nuclear Powered
- 9.3. Market Analysis, Insights and Forecast - by Configuration
- 9.3.1. Catapult
- 9.3.2. Short Take-off but Arrested Recovery (STOBAR)
- 9.3.3. Short Take-off but Vertical Recovery (STOVL)
- 9.1. Market Analysis, Insights and Forecast - by Type
- 10. North America Aircraft Carrier Ship Industry Analysis, Insights and Forecast, 2019-2031
- 10.1. Market Analysis, Insights and Forecast - By Country/Sub-region
- 10.1.1 United States
- 10.1.2 Canada
- 11. Europe Aircraft Carrier Ship Industry Analysis, Insights and Forecast, 2019-2031
- 11.1. Market Analysis, Insights and Forecast - By Country/Sub-region
- 11.1.1 Germany
- 11.1.2 United Kingdom
- 11.1.3 France
- 11.1.4 Russia
- 11.1.5 Rest of Europe
- 12. Asia Pacific Aircraft Carrier Ship Industry Analysis, Insights and Forecast, 2019-2031
- 12.1. Market Analysis, Insights and Forecast - By Country/Sub-region
- 12.1.1 India
- 12.1.2 China
- 12.1.3 South Korea
- 12.1.4 Japan
- 12.1.5 Rest of Asia Pacific
- 13. Rest of the World Aircraft Carrier Ship Industry Analysis, Insights and Forecast, 2019-2031
- 13.1. Market Analysis, Insights and Forecast - By Country/Sub-region
- 13.1.1.
- 14. Competitive Analysis
- 14.1. Global Market Share Analysis 2024
- 14.2. Company Profiles
- 14.2.1 THALES
- 14.2.1.1. Overview
- 14.2.1.2. Products
- 14.2.1.3. SWOT Analysis
- 14.2.1.4. Recent Developments
- 14.2.1.5. Financials (Based on Availability)
- 14.2.2 General Dynamics Corporation
- 14.2.2.1. Overview
- 14.2.2.2. Products
- 14.2.2.3. SWOT Analysis
- 14.2.2.4. Recent Developments
- 14.2.2.5. Financials (Based on Availability)
- 14.2.3 Lockheed Martin Corporation
- 14.2.3.1. Overview
- 14.2.3.2. Products
- 14.2.3.3. SWOT Analysis
- 14.2.3.4. Recent Developments
- 14.2.3.5. Financials (Based on Availability)
- 14.2.4 Naval Group
- 14.2.4.1. Overview
- 14.2.4.2. Products
- 14.2.4.3. SWOT Analysis
- 14.2.4.4. Recent Developments
- 14.2.4.5. Financials (Based on Availability)
- 14.2.5 FINCANTIERI S p A
- 14.2.5.1. Overview
- 14.2.5.2. Products
- 14.2.5.3. SWOT Analysis
- 14.2.5.4. Recent Developments
- 14.2.5.5. Financials (Based on Availability)
- 14.2.6 NAVANTIA S A
- 14.2.6.1. Overview
- 14.2.6.2. Products
- 14.2.6.3. SWOT Analysis
- 14.2.6.4. Recent Developments
- 14.2.6.5. Financials (Based on Availability)
- 14.2.7 Leonardo S p A
- 14.2.7.1. Overview
- 14.2.7.2. Products
- 14.2.7.3. SWOT Analysis
- 14.2.7.4. Recent Developments
- 14.2.7.5. Financials (Based on Availability)
- 14.2.8 BAE Systems plc
- 14.2.8.1. Overview
- 14.2.8.2. Products
- 14.2.8.3. SWOT Analysis
- 14.2.8.4. Recent Developments
- 14.2.8.5. Financials (Based on Availability)
- 14.2.9 Northrop Grumman Corporation
- 14.2.9.1. Overview
- 14.2.9.2. Products
- 14.2.9.3. SWOT Analysis
- 14.2.9.4. Recent Developments
- 14.2.9.5. Financials (Based on Availability)
- 14.2.10 HUNTINGTON INGALLS INDUSTRIES INC
- 14.2.10.1. Overview
- 14.2.10.2. Products
- 14.2.10.3. SWOT Analysis
- 14.2.10.4. Recent Developments
- 14.2.10.5. Financials (Based on Availability)
- 14.2.1 THALES
List of Figures
- Figure 1: Global Aircraft Carrier Ship Industry Revenue Breakdown (Million, %) by Region 2024 & 2032
- Figure 2: North America Aircraft Carrier Ship Industry Revenue (Million), by Country 2024 & 2032
- Figure 3: North America Aircraft Carrier Ship Industry Revenue Share (%), by Country 2024 & 2032
- Figure 4: Europe Aircraft Carrier Ship Industry Revenue (Million), by Country 2024 & 2032
- Figure 5: Europe Aircraft Carrier Ship Industry Revenue Share (%), by Country 2024 & 2032
- Figure 6: Asia Pacific Aircraft Carrier Ship Industry Revenue (Million), by Country 2024 & 2032
- Figure 7: Asia Pacific Aircraft Carrier Ship Industry Revenue Share (%), by Country 2024 & 2032
- Figure 8: Rest of the World Aircraft Carrier Ship Industry Revenue (Million), by Country 2024 & 2032
- Figure 9: Rest of the World Aircraft Carrier Ship Industry Revenue Share (%), by Country 2024 & 2032
- Figure 10: North America Aircraft Carrier Ship Industry Revenue (Million), by Type 2024 & 2032
- Figure 11: North America Aircraft Carrier Ship Industry Revenue Share (%), by Type 2024 & 2032
- Figure 12: North America Aircraft Carrier Ship Industry Revenue (Million), by Technology 2024 & 2032
- Figure 13: North America Aircraft Carrier Ship Industry Revenue Share (%), by Technology 2024 & 2032
- Figure 14: North America Aircraft Carrier Ship Industry Revenue (Million), by Configuration 2024 & 2032
- Figure 15: North America Aircraft Carrier Ship Industry Revenue Share (%), by Configuration 2024 & 2032
- Figure 16: North America Aircraft Carrier Ship Industry Revenue (Million), by Country 2024 & 2032
- Figure 17: North America Aircraft Carrier Ship Industry Revenue Share (%), by Country 2024 & 2032
- Figure 18: Europe Aircraft Carrier Ship Industry Revenue (Million), by Type 2024 & 2032
- Figure 19: Europe Aircraft Carrier Ship Industry Revenue Share (%), by Type 2024 & 2032
- Figure 20: Europe Aircraft Carrier Ship Industry Revenue (Million), by Technology 2024 & 2032
- Figure 21: Europe Aircraft Carrier Ship Industry Revenue Share (%), by Technology 2024 & 2032
- Figure 22: Europe Aircraft Carrier Ship Industry Revenue (Million), by Configuration 2024 & 2032
- Figure 23: Europe Aircraft Carrier Ship Industry Revenue Share (%), by Configuration 2024 & 2032
- Figure 24: Europe Aircraft Carrier Ship Industry Revenue (Million), by Country 2024 & 2032
- Figure 25: Europe Aircraft Carrier Ship Industry Revenue Share (%), by Country 2024 & 2032
- Figure 26: Asia Pacific Aircraft Carrier Ship Industry Revenue (Million), by Type 2024 & 2032
- Figure 27: Asia Pacific Aircraft Carrier Ship Industry Revenue Share (%), by Type 2024 & 2032
- Figure 28: Asia Pacific Aircraft Carrier Ship Industry Revenue (Million), by Technology 2024 & 2032
- Figure 29: Asia Pacific Aircraft Carrier Ship Industry Revenue Share (%), by Technology 2024 & 2032
- Figure 30: Asia Pacific Aircraft Carrier Ship Industry Revenue (Million), by Configuration 2024 & 2032
- Figure 31: Asia Pacific Aircraft Carrier Ship Industry Revenue Share (%), by Configuration 2024 & 2032
- Figure 32: Asia Pacific Aircraft Carrier Ship Industry Revenue (Million), by Country 2024 & 2032
- Figure 33: Asia Pacific Aircraft Carrier Ship Industry Revenue Share (%), by Country 2024 & 2032
- Figure 34: Rest of the World Aircraft Carrier Ship Industry Revenue (Million), by Type 2024 & 2032
- Figure 35: Rest of the World Aircraft Carrier Ship Industry Revenue Share (%), by Type 2024 & 2032
- Figure 36: Rest of the World Aircraft Carrier Ship Industry Revenue (Million), by Technology 2024 & 2032
- Figure 37: Rest of the World Aircraft Carrier Ship Industry Revenue Share (%), by Technology 2024 & 2032
- Figure 38: Rest of the World Aircraft Carrier Ship Industry Revenue (Million), by Configuration 2024 & 2032
- Figure 39: Rest of the World Aircraft Carrier Ship Industry Revenue Share (%), by Configuration 2024 & 2032
- Figure 40: Rest of the World Aircraft Carrier Ship Industry Revenue (Million), by Country 2024 & 2032
- Figure 41: Rest of the World Aircraft Carrier Ship Industry Revenue Share (%), by Country 2024 & 2032
List of Tables
- Table 1: Global Aircraft Carrier Ship Industry Revenue Million Forecast, by Region 2019 & 2032
- Table 2: Global Aircraft Carrier Ship Industry Revenue Million Forecast, by Type 2019 & 2032
- Table 3: Global Aircraft Carrier Ship Industry Revenue Million Forecast, by Technology 2019 & 2032
- Table 4: Global Aircraft Carrier Ship Industry Revenue Million Forecast, by Configuration 2019 & 2032
- Table 5: Global Aircraft Carrier Ship Industry Revenue Million Forecast, by Region 2019 & 2032
- Table 6: Global Aircraft Carrier Ship Industry Revenue Million Forecast, by Country 2019 & 2032
- Table 7: United States Aircraft Carrier Ship Industry Revenue (Million) Forecast, by Application 2019 & 2032
- Table 8: Canada Aircraft Carrier Ship Industry Revenue (Million) Forecast, by Application 2019 & 2032
- Table 9: Global Aircraft Carrier Ship Industry Revenue Million Forecast, by Country 2019 & 2032
- Table 10: Germany Aircraft Carrier Ship Industry Revenue (Million) Forecast, by Application 2019 & 2032
- Table 11: United Kingdom Aircraft Carrier Ship Industry Revenue (Million) Forecast, by Application 2019 & 2032
- Table 12: France Aircraft Carrier Ship Industry Revenue (Million) Forecast, by Application 2019 & 2032
- Table 13: Russia Aircraft Carrier Ship Industry Revenue (Million) Forecast, by Application 2019 & 2032
- Table 14: Rest of Europe Aircraft Carrier Ship Industry Revenue (Million) Forecast, by Application 2019 & 2032
- Table 15: Global Aircraft Carrier Ship Industry Revenue Million Forecast, by Country 2019 & 2032
- Table 16: India Aircraft Carrier Ship Industry Revenue (Million) Forecast, by Application 2019 & 2032
- Table 17: China Aircraft Carrier Ship Industry Revenue (Million) Forecast, by Application 2019 & 2032
- Table 18: South Korea Aircraft Carrier Ship Industry Revenue (Million) Forecast, by Application 2019 & 2032
- Table 19: Japan Aircraft Carrier Ship Industry Revenue (Million) Forecast, by Application 2019 & 2032
- Table 20: Rest of Asia Pacific Aircraft Carrier Ship Industry Revenue (Million) Forecast, by Application 2019 & 2032
- Table 21: Global Aircraft Carrier Ship Industry Revenue Million Forecast, by Country 2019 & 2032
- Table 22: Aircraft Carrier Ship Industry Revenue (Million) Forecast, by Application 2019 & 2032
- Table 23: Global Aircraft Carrier Ship Industry Revenue Million Forecast, by Type 2019 & 2032
- Table 24: Global Aircraft Carrier Ship Industry Revenue Million Forecast, by Technology 2019 & 2032
- Table 25: Global Aircraft Carrier Ship Industry Revenue Million Forecast, by Configuration 2019 & 2032
- Table 26: Global Aircraft Carrier Ship Industry Revenue Million Forecast, by Country 2019 & 2032
- Table 27: United States Aircraft Carrier Ship Industry Revenue (Million) Forecast, by Application 2019 & 2032
- Table 28: Canada Aircraft Carrier Ship Industry Revenue (Million) Forecast, by Application 2019 & 2032
- Table 29: Global Aircraft Carrier Ship Industry Revenue Million Forecast, by Type 2019 & 2032
- Table 30: Global Aircraft Carrier Ship Industry Revenue Million Forecast, by Technology 2019 & 2032
- Table 31: Global Aircraft Carrier Ship Industry Revenue Million Forecast, by Configuration 2019 & 2032
- Table 32: Global Aircraft Carrier Ship Industry Revenue Million Forecast, by Country 2019 & 2032
- Table 33: Germany Aircraft Carrier Ship Industry Revenue (Million) Forecast, by Application 2019 & 2032
- Table 34: United Kingdom Aircraft Carrier Ship Industry Revenue (Million) Forecast, by Application 2019 & 2032
- Table 35: France Aircraft Carrier Ship Industry Revenue (Million) Forecast, by Application 2019 & 2032
- Table 36: Russia Aircraft Carrier Ship Industry Revenue (Million) Forecast, by Application 2019 & 2032
- Table 37: Rest of Europe Aircraft Carrier Ship Industry Revenue (Million) Forecast, by Application 2019 & 2032
- Table 38: Global Aircraft Carrier Ship Industry Revenue Million Forecast, by Type 2019 & 2032
- Table 39: Global Aircraft Carrier Ship Industry Revenue Million Forecast, by Technology 2019 & 2032
- Table 40: Global Aircraft Carrier Ship Industry Revenue Million Forecast, by Configuration 2019 & 2032
- Table 41: Global Aircraft Carrier Ship Industry Revenue Million Forecast, by Country 2019 & 2032
- Table 42: India Aircraft Carrier Ship Industry Revenue (Million) Forecast, by Application 2019 & 2032
- Table 43: China Aircraft Carrier Ship Industry Revenue (Million) Forecast, by Application 2019 & 2032
- Table 44: South Korea Aircraft Carrier Ship Industry Revenue (Million) Forecast, by Application 2019 & 2032
- Table 45: Japan Aircraft Carrier Ship Industry Revenue (Million) Forecast, by Application 2019 & 2032
- Table 46: Rest of Asia Pacific Aircraft Carrier Ship Industry Revenue (Million) Forecast, by Application 2019 & 2032
- Table 47: Global Aircraft Carrier Ship Industry Revenue Million Forecast, by Type 2019 & 2032
- Table 48: Global Aircraft Carrier Ship Industry Revenue Million Forecast, by Technology 2019 & 2032
- Table 49: Global Aircraft Carrier Ship Industry Revenue Million Forecast, by Configuration 2019 & 2032
- Table 50: Global Aircraft Carrier Ship Industry Revenue Million Forecast, by Country 2019 & 2032
Frequently Asked Questions
1. What is the projected Compound Annual Growth Rate (CAGR) of the Aircraft Carrier Ship Industry?
The projected CAGR is approximately 12.75%.
2. Which companies are prominent players in the Aircraft Carrier Ship Industry?
Key companies in the market include THALES, General Dynamics Corporation, Lockheed Martin Corporation, Naval Group, FINCANTIERI S p A, NAVANTIA S A, Leonardo S p A, BAE Systems plc, Northrop Grumman Corporation, HUNTINGTON INGALLS INDUSTRIES INC.
3. What are the main segments of the Aircraft Carrier Ship Industry?
The market segments include Type, Technology, Configuration.
4. Can you provide details about the market size?
The market size is estimated to be USD 1.23 Million as of 2022.
5. What are some drivers contributing to market growth?
Increase in Internet of Things (IoT) and Autonomous Systems; Rise in Demand for Military and Defense Satellite Communication Solutions.
6. What are the notable trends driving market growth?
The Nuclear Powered Segment to Dominate the Market.
7. Are there any restraints impacting market growth?
Cybersecurity Threats to Satellite Communication; Interference in Transmission of Data.
8. Can you provide examples of recent developments in the market?
March 2023: The US Navy announced its plan to extend Nimitz as part of a five-and-a-half-month maintenance availability that will carry the carrier into May 2026.
9. What pricing options are available for accessing the report?
Pricing options include single-user, multi-user, and enterprise licenses priced at USD 4750, USD 5250, and USD 8750 respectively.
10. Is the market size provided in terms of value or volume?
The market size is provided in terms of value, measured in Million.
11. Are there any specific market keywords associated with the report?
Yes, the market keyword associated with the report is "Aircraft Carrier Ship Industry," which aids in identifying and referencing the specific market segment covered.
12. How do I determine which pricing option suits my needs best?
The pricing options vary based on user requirements and access needs. Individual users may opt for single-user licenses, while businesses requiring broader access may choose multi-user or enterprise licenses for cost-effective access to the report.
13. Are there any additional resources or data provided in the Aircraft Carrier Ship Industry report?
While the report offers comprehensive insights, it's advisable to review the specific contents or supplementary materials provided to ascertain if additional resources or data are available.
14. How can I stay updated on further developments or reports in the Aircraft Carrier Ship Industry?
To stay informed about further developments, trends, and reports in the Aircraft Carrier Ship Industry, consider subscribing to industry newsletters, following relevant companies and organizations, or regularly checking reputable industry news sources and publications.
Methodology
Step 1 - Identification of Relevant Samples Size from Population Database


Step 2 - Approaches for Defining Global Market Size (Value, Volume* & Price*)

Note*: In applicable scenarios
Step 3 - Data Sources
Primary Research
- Web Analytics
- Survey Reports
- Research Institute
- Latest Research Reports
- Opinion Leaders
Secondary Research
- Annual Reports
- White Paper
- Latest Press Release
- Industry Association
- Paid Database
- Investor Presentations

Step 4 - Data Triangulation
Involves using different sources of information in order to increase the validity of a study
These sources are likely to be stakeholders in a program - participants, other researchers, program staff, other community members, and so on.
Then we put all data in single framework & apply various statistical tools to find out the dynamic on the market.
During the analysis stage, feedback from the stakeholder groups would be compared to determine areas of agreement as well as areas of divergence
