

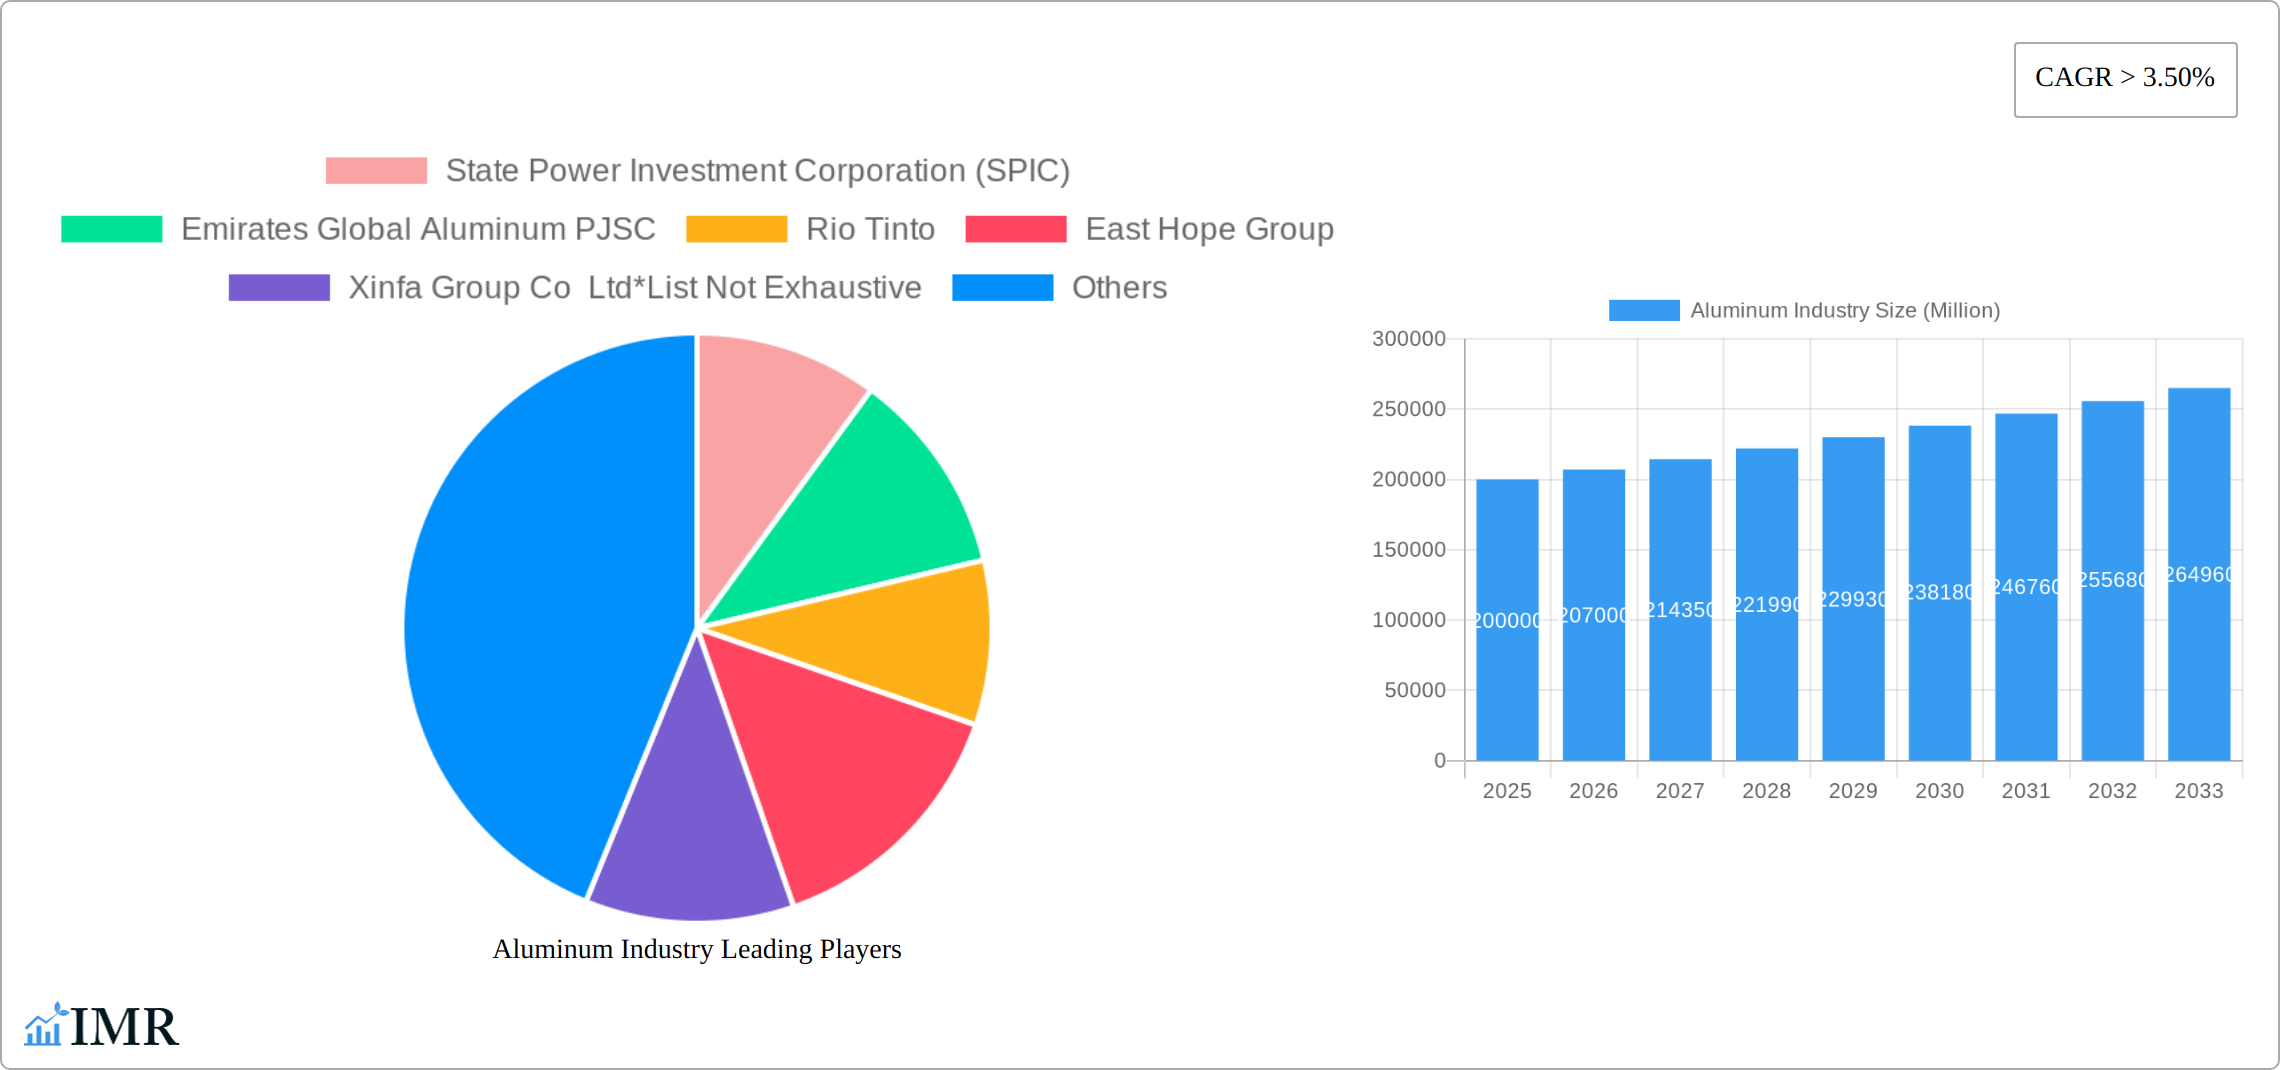
Key Insights
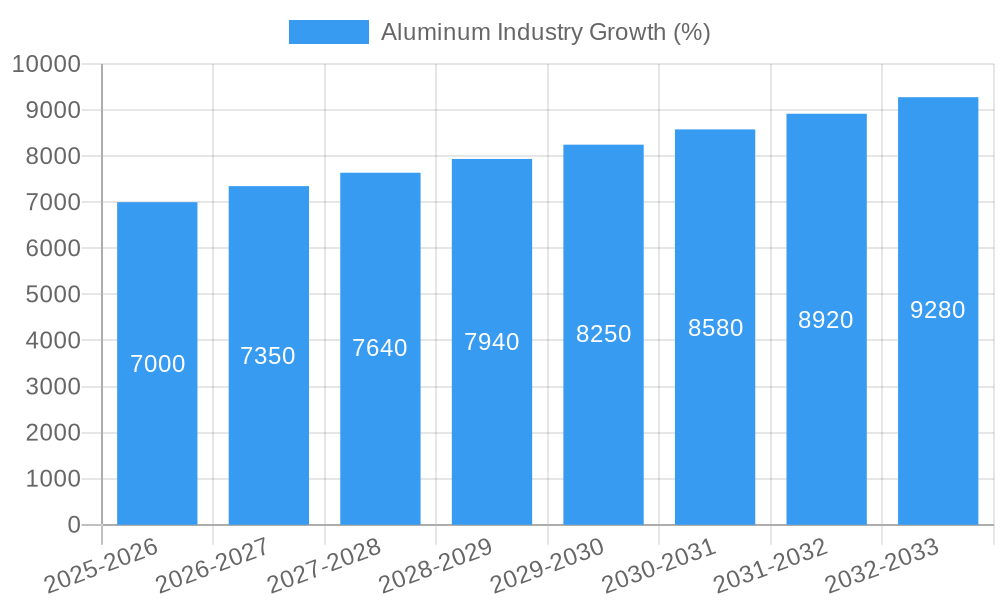
The global aluminum industry, valued at approximately $XX million in 2025, is projected to experience robust growth, exhibiting a Compound Annual Growth Rate (CAGR) exceeding 3.50% from 2025 to 2033. This expansion is driven by several key factors. The burgeoning automotive sector, particularly the increasing demand for lightweight vehicles to improve fuel efficiency, is a significant catalyst. Similarly, the aerospace and defense industries' reliance on aluminum's strength-to-weight ratio fuels substantial demand. The construction industry's ongoing use of aluminum in building materials, including cladding and window frames, further contributes to market growth. Technological advancements in aluminum processing, such as improved casting and extrusion techniques, are enhancing product quality and expanding applications. Growth is also fueled by the rise of renewable energy infrastructure, with aluminum playing a vital role in solar panels and wind turbine components. However, fluctuations in raw material prices (bauxite and alumina), energy costs, and geopolitical instability pose potential restraints to market growth. The industry's segmentation across processing types (castings, extrusions, forgings, etc.) and end-user industries reflects the diverse applications of aluminum, shaping market dynamics within specific sectors. Leading players like Rio Tinto, Alcoa, and Novelis, along with significant regional players like China Hongqiao and RusAL, are shaping the competitive landscape through strategic investments, mergers, and acquisitions. Regional growth patterns are expected to be diverse, with Asia-Pacific, particularly China and India, predicted to lead in terms of consumption and production due to rapid industrialization and infrastructure development.
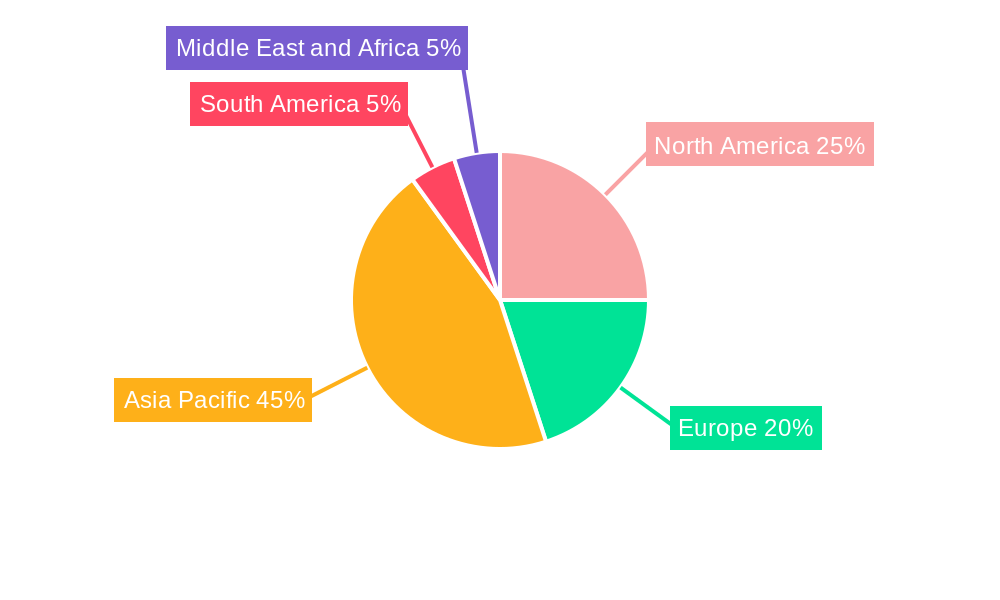
The geographical distribution of market share is likely to reflect existing industrial capacities and economic growth patterns. North America and Europe will continue to be significant markets, but their growth may be more moderate compared to the Asia-Pacific region. South America and the Middle East & Africa present opportunities for future growth, contingent on economic development and infrastructure investment. The forecast period of 2025-2033 presents promising prospects for the aluminum industry, provided that supply chain stability and sustainable sourcing practices are prioritized to address environmental concerns and ensure long-term market sustainability. The continued innovation in aluminum alloys and processing methods, alongside a growing focus on recycling, will also be crucial for shaping future market trends and opportunities.
Aluminum Industry Market Report: 2019-2033
This comprehensive report provides an in-depth analysis of the global aluminum industry, encompassing market dynamics, growth trends, regional dominance, product landscape, key players, and future outlook. With a focus on the period 2019-2033 (Base Year: 2025, Forecast Period: 2025-2033), this report is an essential resource for industry professionals, investors, and strategic decision-makers. The report covers key segments including castings, extrusions, forgings, flat rolled products, and pigments & powders, across diverse end-user industries such as automotive, aerospace & defense, building & construction, and more. The market is valued at xx Million units in 2025.
Aluminum Industry Market Dynamics & Structure
The aluminum industry is characterized by a moderately concentrated market structure, with a few major players holding significant market share. Market concentration is influenced by factors such as economies of scale in production, access to raw materials (bauxite), and technological advancements. The industry faces intense competition, particularly from alternative materials like steel and plastics, driving continuous innovation in product development and manufacturing processes. Technological innovations such as advanced alloys, improved recycling technologies, and sustainable production methods are shaping the competitive landscape. Regulatory frameworks related to environmental protection and carbon emissions play a significant role, influencing production processes and investment decisions. Mergers and acquisitions (M&A) activity is relatively frequent, with companies seeking to expand their market reach, product portfolios, and geographical presence.
- Market Concentration: Top 5 players hold approximately xx% market share (2025).
- M&A Activity: xx major deals recorded between 2019-2024, totaling an estimated value of xx Million units.
- Technological Innovation: Focus on lightweight alloys, high-strength materials, and improved recycling processes.
- Regulatory Landscape: Increasing emphasis on sustainable production and reducing carbon footprint.
- Competitive Substitutes: Steel, plastics, and composites pose significant competitive challenges.
Aluminum Industry Growth Trends & Insights
The global aluminum industry exhibits steady growth, driven by robust demand from various end-user sectors. The market size is projected to reach xx Million units by 2033, exhibiting a CAGR of xx% during the forecast period. This growth is fueled by several key factors including rising automotive production, particularly electric vehicles, increasing demand for lightweight materials in aerospace and defense, and continued growth in the construction and infrastructure sectors. Technological advancements in aluminum production and processing are also contributing to market expansion. Shifting consumer preferences towards sustainable and recyclable materials are further boosting the demand for aluminum products. Adoption rates of innovative aluminum alloys and advanced processing technologies are steadily increasing, further propelling market growth.
- Market Size (2025): xx Million units
- Market Size (2033): xx Million units
- CAGR (2025-2033): xx%
- Market Penetration: xx% in key end-user segments (2025).
Dominant Regions, Countries, or Segments in Aluminum Industry
China dominates the global aluminum industry, holding a substantial share of both production and consumption. This dominance stems from its abundant bauxite reserves, large-scale production facilities, and significant downstream industries. Other significant players include the US, Canada, Russia, and countries in the Middle East. Within processing types, flat-rolled products account for the largest market share, driven by demand from automotive, packaging, and construction sectors. The automotive sector emerges as a leading end-user industry, due to growing vehicle production globally and the increasing use of aluminum in lightweight vehicle components. The building and construction sector is also a significant driver of aluminum demand, influenced by the adoption of aluminum in building materials.
- Leading Region: China
- Dominant Processing Type: Flat Rolled Products
- Key End-User Industry: Automotive
- Growth Drivers: Rapid industrialization in developing economies, robust infrastructure development, and increasing urbanization.
Aluminum Industry Product Landscape
The aluminum industry offers a diverse range of products, encompassing various alloys with unique properties tailored to specific applications. Innovation focuses on developing lighter, stronger, and more corrosion-resistant alloys. Technological advancements are enhancing the efficiency and sustainability of aluminum production, including improved recycling techniques and reduced energy consumption. Unique selling propositions are based on lightweighting capabilities, durability, recyclability, and design flexibility.
Key Drivers, Barriers & Challenges in Aluminum Industry
Key Drivers: Growing demand from automotive, aerospace and building sectors; increasing adoption of lightweight materials; advancements in aluminum alloys and processing technologies; government initiatives promoting sustainable materials.
Key Challenges: Fluctuations in raw material prices (bauxite and alumina); volatility in energy prices; environmental regulations impacting production; intense competition from alternative materials; supply chain disruptions. These challenges could potentially impact the market by xx Million units by 2030.
Emerging Opportunities in Aluminum Industry
The rise of electric vehicles (EVs) presents a significant growth opportunity, with aluminum playing a crucial role in lightweighting components. Innovation in aluminum alloys for high-strength applications in aerospace and defense is expected to drive demand. Furthermore, the growing focus on sustainable building materials opens doors for increased use of aluminum in construction. Expansion into new markets in developing economies also offers substantial potential.
Growth Accelerators in the Aluminum Industry
Technological breakthroughs in aluminum processing and recycling will continue to drive efficiency and sustainability. Strategic partnerships between aluminum producers and end-users will enhance supply chain integration and innovation. Market expansion strategies focused on emerging economies and niche applications will further accelerate growth.
Key Players Shaping the Aluminum Industry Market
- State Power Investment Corporation (SPIC)
- Emirates Global Aluminum PJSC
- Rio Tinto
- East Hope Group
- Xinfa Group Co Ltd
- China Hongqiao Group Limited
- Novelis Inc
- RusAL
- Norsk Hydro ASA
- Aluminum Corporation of China Limited (CHINALCO)
- Alcoa Corporation
- Aluminum Bahrain B.S.C (Alba)
Notable Milestones in Aluminum Industry Sector
- July 2022: Rio Tinto announces a USD 188 million investment in Canada to expand aluminum billet production by 202,000 metric tonnes.
- February 2022: Emirates Global Aluminium PJSC (EGA) plans a new aluminum recycling facility in the UAE with a capacity of 150,000 tonnes annually.
In-Depth Aluminum Industry Market Outlook
The aluminum industry is poised for continued growth, driven by technological advancements, sustainable production practices, and increasing demand from diverse end-user sectors. Strategic investments in new capacity, recycling technologies, and innovative alloy development will shape the future market landscape. Companies focusing on sustainability and supply chain resilience will be best positioned to capitalize on the long-term growth potential.
Aluminum Industry Segmentation
-
1. Processing Type
- 1.1. Castings
- 1.2. Extrusions
- 1.3. Forgings
- 1.4. Flat Rolled Products
- 1.5. Pigments and Powders
-
2. End-user Industry
- 2.1. Automotive
- 2.2. Aerospace and Defense
- 2.3. Building and Construction
- 2.4. Electrical and Electronics
- 2.5. Packaging
- 2.6. Industrial
- 2.7. Other End-user Industries
Aluminum Industry Segmentation By Geography
-
1. Asia Pacific
- 1.1. China
- 1.2. India
- 1.3. Japan
- 1.4. South Korea
- 1.5. Rest of Asia Pacific
-
2. North America
- 2.1. United States
- 2.2. Canada
- 2.3. Mexico
-
3. Europe
- 3.1. Germany
- 3.2. United Kingdom
- 3.3. France
- 3.4. Italy
- 3.5. Rest of Europe
-
4. South America
- 4.1. Brazil
- 4.2. Argentina
- 4.3. Rest of South America
-
5. Middle East and Africa
- 5.1. Saudi Arabia
- 5.2. South Africa
- 5.3. Rest of Middle East and Africa
Aluminum Industry REPORT HIGHLIGHTS
| Aspects | Details |
|---|---|
| Study Period | 2019-2033 |
| Base Year | 2024 |
| Estimated Year | 2025 |
| Forecast Period | 2025-2033 |
| Historical Period | 2019-2024 |
| Growth Rate | CAGR of > 3.50% from 2019-2033 |
| Segmentation |
|
Table of Contents
- 1. Introduction
- 1.1. Research Scope
- 1.2. Market Segmentation
- 1.3. Research Methodology
- 1.4. Definitions and Assumptions
- 2. Executive Summary
- 2.1. Introduction
- 3. Market Dynamics
- 3.1. Introduction
- 3.2. Market Drivers
- 3.2.1. Increasing Construction Activities in the Asia-Pacific Region; Other Drivers
- 3.3. Market Restrains
- 3.3.1. Strict Regulations and Environmental Concerns Related to Aluminum Processing
- 3.4. Market Trends
- 3.4.1. Increasing Demand from the Building and Construction Industry
- 4. Market Factor Analysis
- 4.1. Porters Five Forces
- 4.2. Supply/Value Chain
- 4.3. PESTEL analysis
- 4.4. Market Entropy
- 4.5. Patent/Trademark Analysis
- 5. Global Aluminum Industry Analysis, Insights and Forecast, 2019-2031
- 5.1. Market Analysis, Insights and Forecast - by Processing Type
- 5.1.1. Castings
- 5.1.2. Extrusions
- 5.1.3. Forgings
- 5.1.4. Flat Rolled Products
- 5.1.5. Pigments and Powders
- 5.2. Market Analysis, Insights and Forecast - by End-user Industry
- 5.2.1. Automotive
- 5.2.2. Aerospace and Defense
- 5.2.3. Building and Construction
- 5.2.4. Electrical and Electronics
- 5.2.5. Packaging
- 5.2.6. Industrial
- 5.2.7. Other End-user Industries
- 5.3. Market Analysis, Insights and Forecast - by Region
- 5.3.1. Asia Pacific
- 5.3.2. North America
- 5.3.3. Europe
- 5.3.4. South America
- 5.3.5. Middle East and Africa
- 5.1. Market Analysis, Insights and Forecast - by Processing Type
- 6. Asia Pacific Aluminum Industry Analysis, Insights and Forecast, 2019-2031
- 6.1. Market Analysis, Insights and Forecast - by Processing Type
- 6.1.1. Castings
- 6.1.2. Extrusions
- 6.1.3. Forgings
- 6.1.4. Flat Rolled Products
- 6.1.5. Pigments and Powders
- 6.2. Market Analysis, Insights and Forecast - by End-user Industry
- 6.2.1. Automotive
- 6.2.2. Aerospace and Defense
- 6.2.3. Building and Construction
- 6.2.4. Electrical and Electronics
- 6.2.5. Packaging
- 6.2.6. Industrial
- 6.2.7. Other End-user Industries
- 6.1. Market Analysis, Insights and Forecast - by Processing Type
- 7. North America Aluminum Industry Analysis, Insights and Forecast, 2019-2031
- 7.1. Market Analysis, Insights and Forecast - by Processing Type
- 7.1.1. Castings
- 7.1.2. Extrusions
- 7.1.3. Forgings
- 7.1.4. Flat Rolled Products
- 7.1.5. Pigments and Powders
- 7.2. Market Analysis, Insights and Forecast - by End-user Industry
- 7.2.1. Automotive
- 7.2.2. Aerospace and Defense
- 7.2.3. Building and Construction
- 7.2.4. Electrical and Electronics
- 7.2.5. Packaging
- 7.2.6. Industrial
- 7.2.7. Other End-user Industries
- 7.1. Market Analysis, Insights and Forecast - by Processing Type
- 8. Europe Aluminum Industry Analysis, Insights and Forecast, 2019-2031
- 8.1. Market Analysis, Insights and Forecast - by Processing Type
- 8.1.1. Castings
- 8.1.2. Extrusions
- 8.1.3. Forgings
- 8.1.4. Flat Rolled Products
- 8.1.5. Pigments and Powders
- 8.2. Market Analysis, Insights and Forecast - by End-user Industry
- 8.2.1. Automotive
- 8.2.2. Aerospace and Defense
- 8.2.3. Building and Construction
- 8.2.4. Electrical and Electronics
- 8.2.5. Packaging
- 8.2.6. Industrial
- 8.2.7. Other End-user Industries
- 8.1. Market Analysis, Insights and Forecast - by Processing Type
- 9. South America Aluminum Industry Analysis, Insights and Forecast, 2019-2031
- 9.1. Market Analysis, Insights and Forecast - by Processing Type
- 9.1.1. Castings
- 9.1.2. Extrusions
- 9.1.3. Forgings
- 9.1.4. Flat Rolled Products
- 9.1.5. Pigments and Powders
- 9.2. Market Analysis, Insights and Forecast - by End-user Industry
- 9.2.1. Automotive
- 9.2.2. Aerospace and Defense
- 9.2.3. Building and Construction
- 9.2.4. Electrical and Electronics
- 9.2.5. Packaging
- 9.2.6. Industrial
- 9.2.7. Other End-user Industries
- 9.1. Market Analysis, Insights and Forecast - by Processing Type
- 10. Middle East and Africa Aluminum Industry Analysis, Insights and Forecast, 2019-2031
- 10.1. Market Analysis, Insights and Forecast - by Processing Type
- 10.1.1. Castings
- 10.1.2. Extrusions
- 10.1.3. Forgings
- 10.1.4. Flat Rolled Products
- 10.1.5. Pigments and Powders
- 10.2. Market Analysis, Insights and Forecast - by End-user Industry
- 10.2.1. Automotive
- 10.2.2. Aerospace and Defense
- 10.2.3. Building and Construction
- 10.2.4. Electrical and Electronics
- 10.2.5. Packaging
- 10.2.6. Industrial
- 10.2.7. Other End-user Industries
- 10.1. Market Analysis, Insights and Forecast - by Processing Type
- 11. Asia Pacific Aluminum Industry Analysis, Insights and Forecast, 2019-2031
- 11.1. Market Analysis, Insights and Forecast - By Country/Sub-region
- 11.1.1 China
- 11.1.2 India
- 11.1.3 Japan
- 11.1.4 South Korea
- 11.1.5 Rest of Asia Pacific
- 12. North America Aluminum Industry Analysis, Insights and Forecast, 2019-2031
- 12.1. Market Analysis, Insights and Forecast - By Country/Sub-region
- 12.1.1 United States
- 12.1.2 Canada
- 12.1.3 Mexico
- 13. Europe Aluminum Industry Analysis, Insights and Forecast, 2019-2031
- 13.1. Market Analysis, Insights and Forecast - By Country/Sub-region
- 13.1.1 Germany
- 13.1.2 United Kingdom
- 13.1.3 France
- 13.1.4 Italy
- 13.1.5 Rest of Europe
- 14. South America Aluminum Industry Analysis, Insights and Forecast, 2019-2031
- 14.1. Market Analysis, Insights and Forecast - By Country/Sub-region
- 14.1.1 Brazil
- 14.1.2 Argentina
- 14.1.3 Rest of South America
- 15. Middle East and Africa Aluminum Industry Analysis, Insights and Forecast, 2019-2031
- 15.1. Market Analysis, Insights and Forecast - By Country/Sub-region
- 15.1.1 Saudi Arabia
- 15.1.2 South Africa
- 15.1.3 Rest of Middle East and Africa
- 16. Competitive Analysis
- 16.1. Global Market Share Analysis 2024
- 16.2. Company Profiles
- 16.2.1 State Power Investment Corporation (SPIC)
- 16.2.1.1. Overview
- 16.2.1.2. Products
- 16.2.1.3. SWOT Analysis
- 16.2.1.4. Recent Developments
- 16.2.1.5. Financials (Based on Availability)
- 16.2.2 Emirates Global Aluminum PJSC
- 16.2.2.1. Overview
- 16.2.2.2. Products
- 16.2.2.3. SWOT Analysis
- 16.2.2.4. Recent Developments
- 16.2.2.5. Financials (Based on Availability)
- 16.2.3 Rio Tinto
- 16.2.3.1. Overview
- 16.2.3.2. Products
- 16.2.3.3. SWOT Analysis
- 16.2.3.4. Recent Developments
- 16.2.3.5. Financials (Based on Availability)
- 16.2.4 East Hope Group
- 16.2.4.1. Overview
- 16.2.4.2. Products
- 16.2.4.3. SWOT Analysis
- 16.2.4.4. Recent Developments
- 16.2.4.5. Financials (Based on Availability)
- 16.2.5 Xinfa Group Co Ltd*List Not Exhaustive
- 16.2.5.1. Overview
- 16.2.5.2. Products
- 16.2.5.3. SWOT Analysis
- 16.2.5.4. Recent Developments
- 16.2.5.5. Financials (Based on Availability)
- 16.2.6 China Hongqiao Group Limited
- 16.2.6.1. Overview
- 16.2.6.2. Products
- 16.2.6.3. SWOT Analysis
- 16.2.6.4. Recent Developments
- 16.2.6.5. Financials (Based on Availability)
- 16.2.7 Novelis Inc
- 16.2.7.1. Overview
- 16.2.7.2. Products
- 16.2.7.3. SWOT Analysis
- 16.2.7.4. Recent Developments
- 16.2.7.5. Financials (Based on Availability)
- 16.2.8 RusAL
- 16.2.8.1. Overview
- 16.2.8.2. Products
- 16.2.8.3. SWOT Analysis
- 16.2.8.4. Recent Developments
- 16.2.8.5. Financials (Based on Availability)
- 16.2.9 Norsk Hydro ASA
- 16.2.9.1. Overview
- 16.2.9.2. Products
- 16.2.9.3. SWOT Analysis
- 16.2.9.4. Recent Developments
- 16.2.9.5. Financials (Based on Availability)
- 16.2.10 Aluminum Corporation of China Limited (CHINALCO)
- 16.2.10.1. Overview
- 16.2.10.2. Products
- 16.2.10.3. SWOT Analysis
- 16.2.10.4. Recent Developments
- 16.2.10.5. Financials (Based on Availability)
- 16.2.11 Alcoa Corporation
- 16.2.11.1. Overview
- 16.2.11.2. Products
- 16.2.11.3. SWOT Analysis
- 16.2.11.4. Recent Developments
- 16.2.11.5. Financials (Based on Availability)
- 16.2.12 Aluminum Bahrain B S C (Alba)
- 16.2.12.1. Overview
- 16.2.12.2. Products
- 16.2.12.3. SWOT Analysis
- 16.2.12.4. Recent Developments
- 16.2.12.5. Financials (Based on Availability)
- 16.2.1 State Power Investment Corporation (SPIC)
List of Figures
- Figure 1: Global Aluminum Industry Revenue Breakdown (Million, %) by Region 2024 & 2032
- Figure 2: Asia Pacific Aluminum Industry Revenue (Million), by Country 2024 & 2032
- Figure 3: Asia Pacific Aluminum Industry Revenue Share (%), by Country 2024 & 2032
- Figure 4: North America Aluminum Industry Revenue (Million), by Country 2024 & 2032
- Figure 5: North America Aluminum Industry Revenue Share (%), by Country 2024 & 2032
- Figure 6: Europe Aluminum Industry Revenue (Million), by Country 2024 & 2032
- Figure 7: Europe Aluminum Industry Revenue Share (%), by Country 2024 & 2032
- Figure 8: South America Aluminum Industry Revenue (Million), by Country 2024 & 2032
- Figure 9: South America Aluminum Industry Revenue Share (%), by Country 2024 & 2032
- Figure 10: Middle East and Africa Aluminum Industry Revenue (Million), by Country 2024 & 2032
- Figure 11: Middle East and Africa Aluminum Industry Revenue Share (%), by Country 2024 & 2032
- Figure 12: Asia Pacific Aluminum Industry Revenue (Million), by Processing Type 2024 & 2032
- Figure 13: Asia Pacific Aluminum Industry Revenue Share (%), by Processing Type 2024 & 2032
- Figure 14: Asia Pacific Aluminum Industry Revenue (Million), by End-user Industry 2024 & 2032
- Figure 15: Asia Pacific Aluminum Industry Revenue Share (%), by End-user Industry 2024 & 2032
- Figure 16: Asia Pacific Aluminum Industry Revenue (Million), by Country 2024 & 2032
- Figure 17: Asia Pacific Aluminum Industry Revenue Share (%), by Country 2024 & 2032
- Figure 18: North America Aluminum Industry Revenue (Million), by Processing Type 2024 & 2032
- Figure 19: North America Aluminum Industry Revenue Share (%), by Processing Type 2024 & 2032
- Figure 20: North America Aluminum Industry Revenue (Million), by End-user Industry 2024 & 2032
- Figure 21: North America Aluminum Industry Revenue Share (%), by End-user Industry 2024 & 2032
- Figure 22: North America Aluminum Industry Revenue (Million), by Country 2024 & 2032
- Figure 23: North America Aluminum Industry Revenue Share (%), by Country 2024 & 2032
- Figure 24: Europe Aluminum Industry Revenue (Million), by Processing Type 2024 & 2032
- Figure 25: Europe Aluminum Industry Revenue Share (%), by Processing Type 2024 & 2032
- Figure 26: Europe Aluminum Industry Revenue (Million), by End-user Industry 2024 & 2032
- Figure 27: Europe Aluminum Industry Revenue Share (%), by End-user Industry 2024 & 2032
- Figure 28: Europe Aluminum Industry Revenue (Million), by Country 2024 & 2032
- Figure 29: Europe Aluminum Industry Revenue Share (%), by Country 2024 & 2032
- Figure 30: South America Aluminum Industry Revenue (Million), by Processing Type 2024 & 2032
- Figure 31: South America Aluminum Industry Revenue Share (%), by Processing Type 2024 & 2032
- Figure 32: South America Aluminum Industry Revenue (Million), by End-user Industry 2024 & 2032
- Figure 33: South America Aluminum Industry Revenue Share (%), by End-user Industry 2024 & 2032
- Figure 34: South America Aluminum Industry Revenue (Million), by Country 2024 & 2032
- Figure 35: South America Aluminum Industry Revenue Share (%), by Country 2024 & 2032
- Figure 36: Middle East and Africa Aluminum Industry Revenue (Million), by Processing Type 2024 & 2032
- Figure 37: Middle East and Africa Aluminum Industry Revenue Share (%), by Processing Type 2024 & 2032
- Figure 38: Middle East and Africa Aluminum Industry Revenue (Million), by End-user Industry 2024 & 2032
- Figure 39: Middle East and Africa Aluminum Industry Revenue Share (%), by End-user Industry 2024 & 2032
- Figure 40: Middle East and Africa Aluminum Industry Revenue (Million), by Country 2024 & 2032
- Figure 41: Middle East and Africa Aluminum Industry Revenue Share (%), by Country 2024 & 2032
List of Tables
- Table 1: Global Aluminum Industry Revenue Million Forecast, by Region 2019 & 2032
- Table 2: Global Aluminum Industry Revenue Million Forecast, by Processing Type 2019 & 2032
- Table 3: Global Aluminum Industry Revenue Million Forecast, by End-user Industry 2019 & 2032
- Table 4: Global Aluminum Industry Revenue Million Forecast, by Region 2019 & 2032
- Table 5: Global Aluminum Industry Revenue Million Forecast, by Country 2019 & 2032
- Table 6: China Aluminum Industry Revenue (Million) Forecast, by Application 2019 & 2032
- Table 7: India Aluminum Industry Revenue (Million) Forecast, by Application 2019 & 2032
- Table 8: Japan Aluminum Industry Revenue (Million) Forecast, by Application 2019 & 2032
- Table 9: South Korea Aluminum Industry Revenue (Million) Forecast, by Application 2019 & 2032
- Table 10: Rest of Asia Pacific Aluminum Industry Revenue (Million) Forecast, by Application 2019 & 2032
- Table 11: Global Aluminum Industry Revenue Million Forecast, by Country 2019 & 2032
- Table 12: United States Aluminum Industry Revenue (Million) Forecast, by Application 2019 & 2032
- Table 13: Canada Aluminum Industry Revenue (Million) Forecast, by Application 2019 & 2032
- Table 14: Mexico Aluminum Industry Revenue (Million) Forecast, by Application 2019 & 2032
- Table 15: Global Aluminum Industry Revenue Million Forecast, by Country 2019 & 2032
- Table 16: Germany Aluminum Industry Revenue (Million) Forecast, by Application 2019 & 2032
- Table 17: United Kingdom Aluminum Industry Revenue (Million) Forecast, by Application 2019 & 2032
- Table 18: France Aluminum Industry Revenue (Million) Forecast, by Application 2019 & 2032
- Table 19: Italy Aluminum Industry Revenue (Million) Forecast, by Application 2019 & 2032
- Table 20: Rest of Europe Aluminum Industry Revenue (Million) Forecast, by Application 2019 & 2032
- Table 21: Global Aluminum Industry Revenue Million Forecast, by Country 2019 & 2032
- Table 22: Brazil Aluminum Industry Revenue (Million) Forecast, by Application 2019 & 2032
- Table 23: Argentina Aluminum Industry Revenue (Million) Forecast, by Application 2019 & 2032
- Table 24: Rest of South America Aluminum Industry Revenue (Million) Forecast, by Application 2019 & 2032
- Table 25: Global Aluminum Industry Revenue Million Forecast, by Country 2019 & 2032
- Table 26: Saudi Arabia Aluminum Industry Revenue (Million) Forecast, by Application 2019 & 2032
- Table 27: South Africa Aluminum Industry Revenue (Million) Forecast, by Application 2019 & 2032
- Table 28: Rest of Middle East and Africa Aluminum Industry Revenue (Million) Forecast, by Application 2019 & 2032
- Table 29: Global Aluminum Industry Revenue Million Forecast, by Processing Type 2019 & 2032
- Table 30: Global Aluminum Industry Revenue Million Forecast, by End-user Industry 2019 & 2032
- Table 31: Global Aluminum Industry Revenue Million Forecast, by Country 2019 & 2032
- Table 32: China Aluminum Industry Revenue (Million) Forecast, by Application 2019 & 2032
- Table 33: India Aluminum Industry Revenue (Million) Forecast, by Application 2019 & 2032
- Table 34: Japan Aluminum Industry Revenue (Million) Forecast, by Application 2019 & 2032
- Table 35: South Korea Aluminum Industry Revenue (Million) Forecast, by Application 2019 & 2032
- Table 36: Rest of Asia Pacific Aluminum Industry Revenue (Million) Forecast, by Application 2019 & 2032
- Table 37: Global Aluminum Industry Revenue Million Forecast, by Processing Type 2019 & 2032
- Table 38: Global Aluminum Industry Revenue Million Forecast, by End-user Industry 2019 & 2032
- Table 39: Global Aluminum Industry Revenue Million Forecast, by Country 2019 & 2032
- Table 40: United States Aluminum Industry Revenue (Million) Forecast, by Application 2019 & 2032
- Table 41: Canada Aluminum Industry Revenue (Million) Forecast, by Application 2019 & 2032
- Table 42: Mexico Aluminum Industry Revenue (Million) Forecast, by Application 2019 & 2032
- Table 43: Global Aluminum Industry Revenue Million Forecast, by Processing Type 2019 & 2032
- Table 44: Global Aluminum Industry Revenue Million Forecast, by End-user Industry 2019 & 2032
- Table 45: Global Aluminum Industry Revenue Million Forecast, by Country 2019 & 2032
- Table 46: Germany Aluminum Industry Revenue (Million) Forecast, by Application 2019 & 2032
- Table 47: United Kingdom Aluminum Industry Revenue (Million) Forecast, by Application 2019 & 2032
- Table 48: France Aluminum Industry Revenue (Million) Forecast, by Application 2019 & 2032
- Table 49: Italy Aluminum Industry Revenue (Million) Forecast, by Application 2019 & 2032
- Table 50: Rest of Europe Aluminum Industry Revenue (Million) Forecast, by Application 2019 & 2032
- Table 51: Global Aluminum Industry Revenue Million Forecast, by Processing Type 2019 & 2032
- Table 52: Global Aluminum Industry Revenue Million Forecast, by End-user Industry 2019 & 2032
- Table 53: Global Aluminum Industry Revenue Million Forecast, by Country 2019 & 2032
- Table 54: Brazil Aluminum Industry Revenue (Million) Forecast, by Application 2019 & 2032
- Table 55: Argentina Aluminum Industry Revenue (Million) Forecast, by Application 2019 & 2032
- Table 56: Rest of South America Aluminum Industry Revenue (Million) Forecast, by Application 2019 & 2032
- Table 57: Global Aluminum Industry Revenue Million Forecast, by Processing Type 2019 & 2032
- Table 58: Global Aluminum Industry Revenue Million Forecast, by End-user Industry 2019 & 2032
- Table 59: Global Aluminum Industry Revenue Million Forecast, by Country 2019 & 2032
- Table 60: Saudi Arabia Aluminum Industry Revenue (Million) Forecast, by Application 2019 & 2032
- Table 61: South Africa Aluminum Industry Revenue (Million) Forecast, by Application 2019 & 2032
- Table 62: Rest of Middle East and Africa Aluminum Industry Revenue (Million) Forecast, by Application 2019 & 2032
Frequently Asked Questions
1. What is the projected Compound Annual Growth Rate (CAGR) of the Aluminum Industry?
The projected CAGR is approximately > 3.50%.
2. Which companies are prominent players in the Aluminum Industry?
Key companies in the market include State Power Investment Corporation (SPIC), Emirates Global Aluminum PJSC, Rio Tinto, East Hope Group, Xinfa Group Co Ltd*List Not Exhaustive, China Hongqiao Group Limited, Novelis Inc, RusAL, Norsk Hydro ASA, Aluminum Corporation of China Limited (CHINALCO), Alcoa Corporation, Aluminum Bahrain B S C (Alba).
3. What are the main segments of the Aluminum Industry?
The market segments include Processing Type, End-user Industry.
4. Can you provide details about the market size?
The market size is estimated to be USD XX Million as of 2022.
5. What are some drivers contributing to market growth?
Increasing Construction Activities in the Asia-Pacific Region; Other Drivers.
6. What are the notable trends driving market growth?
Increasing Demand from the Building and Construction Industry.
7. Are there any restraints impacting market growth?
Strict Regulations and Environmental Concerns Related to Aluminum Processing.
8. Can you provide examples of recent developments in the market?
July 2022: Rio Tinto unveils a USD 188 million aluminum investment plan in Canada. The company is planning to grow aluminum billets production by 202,000 metric tonnes. The firm will expand the capacity of the existing casting center at its Alma plant.
9. What pricing options are available for accessing the report?
Pricing options include single-user, multi-user, and enterprise licenses priced at USD 4750, USD 5250, and USD 8750 respectively.
10. Is the market size provided in terms of value or volume?
The market size is provided in terms of value, measured in Million.
11. Are there any specific market keywords associated with the report?
Yes, the market keyword associated with the report is "Aluminum Industry," which aids in identifying and referencing the specific market segment covered.
12. How do I determine which pricing option suits my needs best?
The pricing options vary based on user requirements and access needs. Individual users may opt for single-user licenses, while businesses requiring broader access may choose multi-user or enterprise licenses for cost-effective access to the report.
13. Are there any additional resources or data provided in the Aluminum Industry report?
While the report offers comprehensive insights, it's advisable to review the specific contents or supplementary materials provided to ascertain if additional resources or data are available.
14. How can I stay updated on further developments or reports in the Aluminum Industry?
To stay informed about further developments, trends, and reports in the Aluminum Industry, consider subscribing to industry newsletters, following relevant companies and organizations, or regularly checking reputable industry news sources and publications.
Methodology
Step 1 - Identification of Relevant Samples Size from Population Database


Step 2 - Approaches for Defining Global Market Size (Value, Volume* & Price*)

Note*: In applicable scenarios
Step 3 - Data Sources
Primary Research
- Web Analytics
- Survey Reports
- Research Institute
- Latest Research Reports
- Opinion Leaders
Secondary Research
- Annual Reports
- White Paper
- Latest Press Release
- Industry Association
- Paid Database
- Investor Presentations

Step 4 - Data Triangulation
Involves using different sources of information in order to increase the validity of a study
These sources are likely to be stakeholders in a program - participants, other researchers, program staff, other community members, and so on.
Then we put all data in single framework & apply various statistical tools to find out the dynamic on the market.
During the analysis stage, feedback from the stakeholder groups would be compared to determine areas of agreement as well as areas of divergence
