

Key Insights
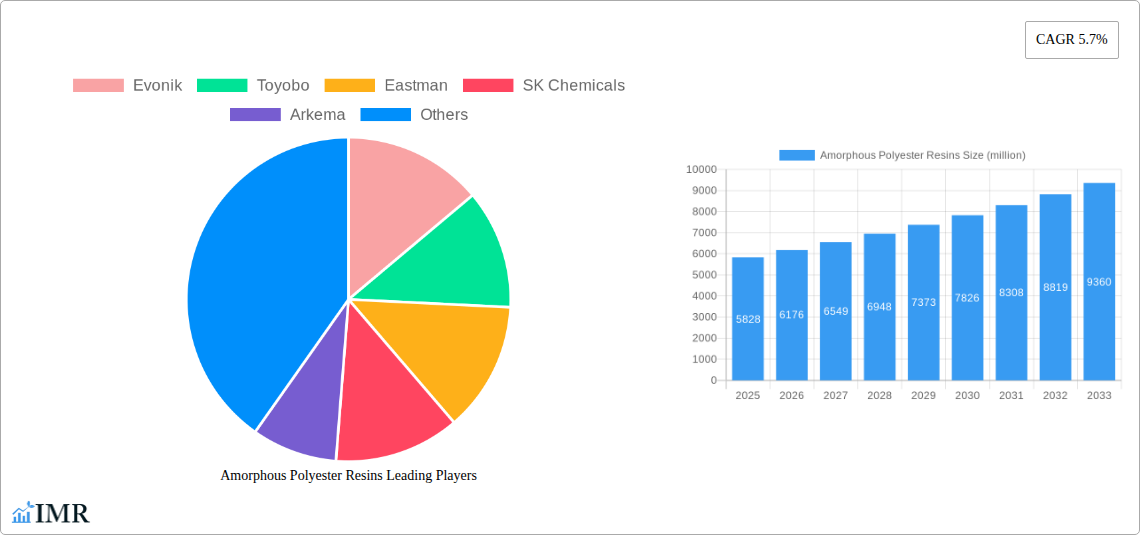
The Amorphous Polyester Resins market, currently valued at $5.828 billion in 2025, is projected to experience robust growth, exhibiting a Compound Annual Growth Rate (CAGR) of 5.7% from 2025 to 2033. This expansion is driven primarily by the increasing demand from diverse end-use sectors, including coatings, adhesives, and inks, where the material's unique properties – such as flexibility, durability, and excellent chemical resistance – are highly valued. The rising adoption of sustainable and eco-friendly solutions within these industries further fuels market growth, as amorphous polyester resins offer a relatively low environmental impact compared to some alternatives. Technological advancements leading to improved resin formulations with enhanced performance characteristics, such as increased UV resistance and improved adhesion, are also contributing factors.
However, the market faces challenges. Fluctuations in raw material prices, particularly petroleum-based components, can impact profitability. Furthermore, competition from other polymer types, including acrylics and epoxy resins, necessitates continuous innovation and cost optimization strategies for market players. Geographic growth will likely be uneven, with regions experiencing rapid industrialization and infrastructure development expected to witness stronger demand. Key players like Evonik, Toyobo, Eastman, SK Chemicals, Arkema, Covestro, Mitsubishi Chemical, Allnex, Macroocean, and Shanghai Tianyang are actively engaged in research and development, focusing on product differentiation and expanding their market presence through strategic partnerships and acquisitions to maintain a competitive edge.
Amorphous Polyester Resins Market Report: 2019-2033
This comprehensive report provides an in-depth analysis of the Amorphous Polyester Resins market, encompassing market dynamics, growth trends, regional dominance, product landscape, key players, and future outlook. The study period covers 2019-2033, with 2025 as the base and estimated year. The forecast period extends from 2025 to 2033, and the historical period analyzed is 2019-2024. This report is crucial for industry professionals, investors, and stakeholders seeking a detailed understanding of this dynamic market. The parent market is the Polyester Resins market and the child market is Amorphous Polyester Resins.
Amorphous Polyester Resins Market Dynamics & Structure
The Amorphous Polyester Resins market is characterized by a moderately concentrated structure, with key players like Evonik, Toyobo, Eastman, and Covestro holding significant market share. The market size in 2025 is estimated at $XX million. Technological innovation, driven by the need for improved performance characteristics and sustainability, is a key driver. Stringent regulatory frameworks regarding VOC emissions and material safety influence market dynamics. Competitive pressure from alternative materials, such as thermoplastic polyurethanes, is also a factor. M&A activity has been relatively moderate in recent years, with approximately XX deals recorded between 2019 and 2024. The market is largely driven by specific end-user demographics, primarily within the automotive, coatings, and electronics sectors.
- Market Concentration: Moderately concentrated, with top 5 players holding approximately xx% market share in 2025.
- Technological Innovation: Focus on enhancing thermal stability, UV resistance, and biodegradability.
- Regulatory Landscape: Stringent environmental regulations impacting manufacturing processes and material composition.
- Competitive Substitutes: Thermoplastic polyurethanes and other specialty polymers pose competition.
- End-User Demographics: Automotive, coatings, electronics, and packaging sectors are key consumers.
- M&A Trends: Moderate M&A activity, with xx deals observed between 2019 and 2024, primarily focused on expansion and technology acquisition.
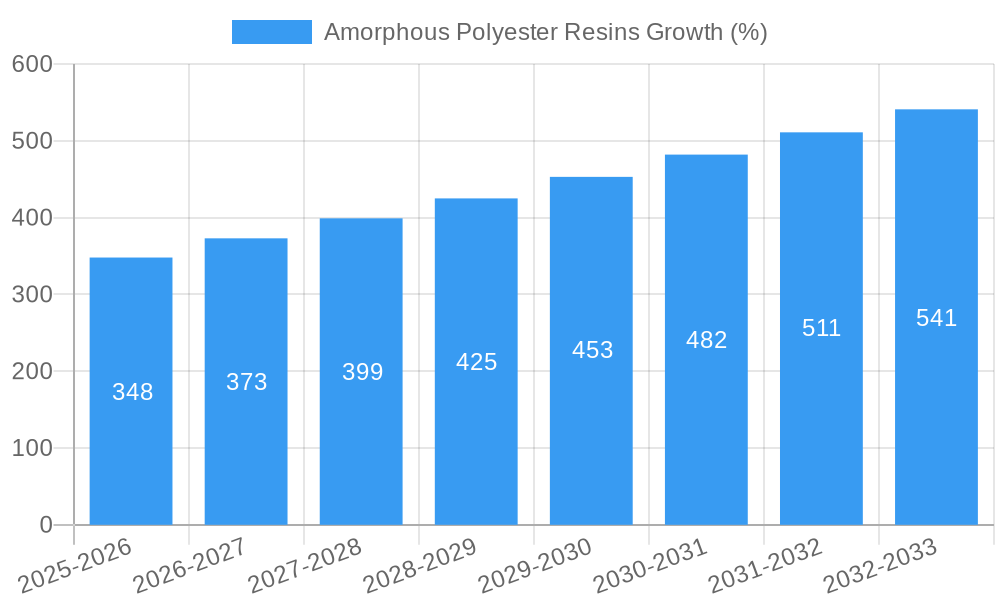
Amorphous Polyester Resins Growth Trends & Insights
The Amorphous Polyester Resins market experienced a CAGR of xx% during the historical period (2019-2024), reaching an estimated value of $XX million in 2025. This growth is attributed to increasing demand from key end-use sectors, coupled with advancements in resin formulations offering enhanced performance. Technological disruptions, such as the development of bio-based amorphous polyester resins, are contributing to market expansion. Shifting consumer preferences towards sustainable and eco-friendly materials are further driving adoption. Market penetration in emerging economies is expected to increase significantly during the forecast period, fueling market expansion. The projected CAGR from 2025 to 2033 is xx%.
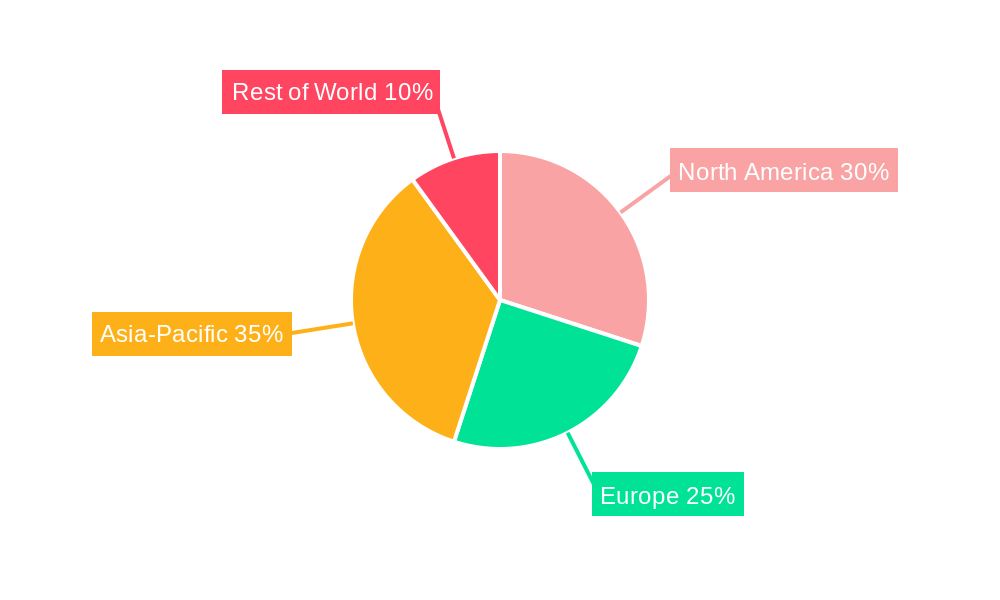
Dominant Regions, Countries, or Segments in Amorphous Polyester Resins
The Asia-Pacific region dominates the Amorphous Polyester Resins market, driven by robust growth in China, Japan, and South Korea. This dominance is fueled by rapid industrialization, expanding automotive production, and burgeoning electronics manufacturing. The strong economic growth in the region, coupled with supportive government policies promoting manufacturing and infrastructure development, significantly contribute to the market’s dominance.
- Key Drivers in Asia-Pacific: Rapid industrialization, growing automotive and electronics sectors, supportive government policies.
- Market Share: Asia-Pacific holds approximately xx% of the global market share in 2025.
- Growth Potential: Continued economic expansion and infrastructure development promise significant future growth.
- Other key regions: North America and Europe exhibit steady growth, primarily driven by the automotive and coatings industries.
Amorphous Polyester Resins Product Landscape
Amorphous polyester resins are available in various grades, each tailored to specific applications. These include high-performance resins with enhanced thermal stability and UV resistance for demanding applications in electronics and automotive components. Innovations focus on improving processability, reducing VOC emissions, and incorporating bio-based materials to meet sustainability goals. Unique selling propositions include superior durability, chemical resistance, and optical clarity. Technological advancements are continuously pushing the boundaries of performance and sustainability.
Key Drivers, Barriers & Challenges in Amorphous Polyester Resins
Key Drivers: Rising demand from the automotive, coatings, and electronics industries; advancements in resin formulations improving performance and sustainability; supportive government policies promoting environmentally friendly materials.
Challenges: Fluctuations in raw material prices; stringent environmental regulations; intense competition from alternative materials; supply chain disruptions and geopolitical uncertainties. These challenges could impact profitability and market growth by approximately xx% in the coming years if not effectively managed.
Emerging Opportunities in Amorphous Polyester Resins
Emerging opportunities include the development of bio-based and recycled amorphous polyester resins catering to the growing demand for sustainable materials. Untapped markets in developing economies present substantial growth potential. Innovative applications in 3D printing and advanced packaging are further expanding the market. Evolving consumer preferences towards high-performance, eco-friendly products drive the need for innovative solutions.
Growth Accelerators in the Amorphous Polyester Resins Industry
Technological breakthroughs in resin synthesis and formulation are key growth accelerators. Strategic partnerships between resin manufacturers and end-users are streamlining supply chains and promoting product innovation. Market expansion strategies targeting new applications and emerging economies will drive long-term growth.
Key Players Shaping the Amorphous Polyester Resins Market
- Evonik
- Toyobo
- Eastman
- SK Chemicals
- Arkema
- Covestro
- Mitsubishi Chemical
- Allnex
- Macroocean
- Shanghai Tianyang
Notable Milestones in Amorphous Polyester Resins Sector
- 2021: Evonik launched a new bio-based amorphous polyester resin with enhanced sustainability features.
- 2022: Covestro and a key automotive manufacturer announced a strategic partnership to develop high-performance resins for electric vehicles.
- 2023: Toyobo introduced a new resin grade with improved processability and reduced VOC emissions. (Further milestones can be added here based on available data)
In-Depth Amorphous Polyester Resins Market Outlook
The Amorphous Polyester Resins market is poised for significant growth over the forecast period (2025-2033), driven by robust demand from various end-use industries, advancements in resin technology, and expansion into new applications. Strategic partnerships and investments in research and development will further fuel market expansion. Opportunities abound for companies focusing on sustainability, performance enhancement, and cost optimization. The market is expected to reach a value of $XX million by 2033.
Amorphous Polyester Resins Segmentation
-
1. Application
- 1.1. Coatings
- 1.2. Adhesives
- 1.3. Other
-
2. Type
- 2.1. Saturated Polyester Resins
- 2.2. Unsaturated Polyester Resins
Amorphous Polyester Resins Segmentation By Geography
-
1. North America
- 1.1. United States
- 1.2. Canada
- 1.3. Mexico
-
2. South America
- 2.1. Brazil
- 2.2. Argentina
- 2.3. Rest of South America
-
3. Europe
- 3.1. United Kingdom
- 3.2. Germany
- 3.3. France
- 3.4. Italy
- 3.5. Spain
- 3.6. Russia
- 3.7. Benelux
- 3.8. Nordics
- 3.9. Rest of Europe
-
4. Middle East & Africa
- 4.1. Turkey
- 4.2. Israel
- 4.3. GCC
- 4.4. North Africa
- 4.5. South Africa
- 4.6. Rest of Middle East & Africa
-
5. Asia Pacific
- 5.1. China
- 5.2. India
- 5.3. Japan
- 5.4. South Korea
- 5.5. ASEAN
- 5.6. Oceania
- 5.7. Rest of Asia Pacific
Amorphous Polyester Resins REPORT HIGHLIGHTS
| Aspects | Details |
|---|---|
| Study Period | 2019-2033 |
| Base Year | 2024 |
| Estimated Year | 2025 |
| Forecast Period | 2025-2033 |
| Historical Period | 2019-2024 |
| Growth Rate | CAGR of 5.7% from 2019-2033 |
| Segmentation |
|
Table of Contents
- 1. Introduction
- 1.1. Research Scope
- 1.2. Market Segmentation
- 1.3. Research Methodology
- 1.4. Definitions and Assumptions
- 2. Executive Summary
- 2.1. Introduction
- 3. Market Dynamics
- 3.1. Introduction
- 3.2. Market Drivers
- 3.3. Market Restrains
- 3.4. Market Trends
- 4. Market Factor Analysis
- 4.1. Porters Five Forces
- 4.2. Supply/Value Chain
- 4.3. PESTEL analysis
- 4.4. Market Entropy
- 4.5. Patent/Trademark Analysis
- 5. Global Amorphous Polyester Resins Analysis, Insights and Forecast, 2019-2031
- 5.1. Market Analysis, Insights and Forecast - by Application
- 5.1.1. Coatings
- 5.1.2. Adhesives
- 5.1.3. Other
- 5.2. Market Analysis, Insights and Forecast - by Type
- 5.2.1. Saturated Polyester Resins
- 5.2.2. Unsaturated Polyester Resins
- 5.3. Market Analysis, Insights and Forecast - by Region
- 5.3.1. North America
- 5.3.2. South America
- 5.3.3. Europe
- 5.3.4. Middle East & Africa
- 5.3.5. Asia Pacific
- 5.1. Market Analysis, Insights and Forecast - by Application
- 6. North America Amorphous Polyester Resins Analysis, Insights and Forecast, 2019-2031
- 6.1. Market Analysis, Insights and Forecast - by Application
- 6.1.1. Coatings
- 6.1.2. Adhesives
- 6.1.3. Other
- 6.2. Market Analysis, Insights and Forecast - by Type
- 6.2.1. Saturated Polyester Resins
- 6.2.2. Unsaturated Polyester Resins
- 6.1. Market Analysis, Insights and Forecast - by Application
- 7. South America Amorphous Polyester Resins Analysis, Insights and Forecast, 2019-2031
- 7.1. Market Analysis, Insights and Forecast - by Application
- 7.1.1. Coatings
- 7.1.2. Adhesives
- 7.1.3. Other
- 7.2. Market Analysis, Insights and Forecast - by Type
- 7.2.1. Saturated Polyester Resins
- 7.2.2. Unsaturated Polyester Resins
- 7.1. Market Analysis, Insights and Forecast - by Application
- 8. Europe Amorphous Polyester Resins Analysis, Insights and Forecast, 2019-2031
- 8.1. Market Analysis, Insights and Forecast - by Application
- 8.1.1. Coatings
- 8.1.2. Adhesives
- 8.1.3. Other
- 8.2. Market Analysis, Insights and Forecast - by Type
- 8.2.1. Saturated Polyester Resins
- 8.2.2. Unsaturated Polyester Resins
- 8.1. Market Analysis, Insights and Forecast - by Application
- 9. Middle East & Africa Amorphous Polyester Resins Analysis, Insights and Forecast, 2019-2031
- 9.1. Market Analysis, Insights and Forecast - by Application
- 9.1.1. Coatings
- 9.1.2. Adhesives
- 9.1.3. Other
- 9.2. Market Analysis, Insights and Forecast - by Type
- 9.2.1. Saturated Polyester Resins
- 9.2.2. Unsaturated Polyester Resins
- 9.1. Market Analysis, Insights and Forecast - by Application
- 10. Asia Pacific Amorphous Polyester Resins Analysis, Insights and Forecast, 2019-2031
- 10.1. Market Analysis, Insights and Forecast - by Application
- 10.1.1. Coatings
- 10.1.2. Adhesives
- 10.1.3. Other
- 10.2. Market Analysis, Insights and Forecast - by Type
- 10.2.1. Saturated Polyester Resins
- 10.2.2. Unsaturated Polyester Resins
- 10.1. Market Analysis, Insights and Forecast - by Application
- 11. Competitive Analysis
- 11.1. Global Market Share Analysis 2024
- 11.2. Company Profiles
- 11.2.1 Evonik
- 11.2.1.1. Overview
- 11.2.1.2. Products
- 11.2.1.3. SWOT Analysis
- 11.2.1.4. Recent Developments
- 11.2.1.5. Financials (Based on Availability)
- 11.2.2 Toyobo
- 11.2.2.1. Overview
- 11.2.2.2. Products
- 11.2.2.3. SWOT Analysis
- 11.2.2.4. Recent Developments
- 11.2.2.5. Financials (Based on Availability)
- 11.2.3 Eastman
- 11.2.3.1. Overview
- 11.2.3.2. Products
- 11.2.3.3. SWOT Analysis
- 11.2.3.4. Recent Developments
- 11.2.3.5. Financials (Based on Availability)
- 11.2.4 SK Chemicals
- 11.2.4.1. Overview
- 11.2.4.2. Products
- 11.2.4.3. SWOT Analysis
- 11.2.4.4. Recent Developments
- 11.2.4.5. Financials (Based on Availability)
- 11.2.5 Arkema
- 11.2.5.1. Overview
- 11.2.5.2. Products
- 11.2.5.3. SWOT Analysis
- 11.2.5.4. Recent Developments
- 11.2.5.5. Financials (Based on Availability)
- 11.2.6 Covestro
- 11.2.6.1. Overview
- 11.2.6.2. Products
- 11.2.6.3. SWOT Analysis
- 11.2.6.4. Recent Developments
- 11.2.6.5. Financials (Based on Availability)
- 11.2.7 Mitsubishi Chemical
- 11.2.7.1. Overview
- 11.2.7.2. Products
- 11.2.7.3. SWOT Analysis
- 11.2.7.4. Recent Developments
- 11.2.7.5. Financials (Based on Availability)
- 11.2.8 Allnex
- 11.2.8.1. Overview
- 11.2.8.2. Products
- 11.2.8.3. SWOT Analysis
- 11.2.8.4. Recent Developments
- 11.2.8.5. Financials (Based on Availability)
- 11.2.9 Macroocean
- 11.2.9.1. Overview
- 11.2.9.2. Products
- 11.2.9.3. SWOT Analysis
- 11.2.9.4. Recent Developments
- 11.2.9.5. Financials (Based on Availability)
- 11.2.10 Shanghai Tianyang
- 11.2.10.1. Overview
- 11.2.10.2. Products
- 11.2.10.3. SWOT Analysis
- 11.2.10.4. Recent Developments
- 11.2.10.5. Financials (Based on Availability)
- 11.2.1 Evonik
List of Figures
- Figure 1: Global Amorphous Polyester Resins Revenue Breakdown (million, %) by Region 2024 & 2032
- Figure 2: Global Amorphous Polyester Resins Volume Breakdown (K, %) by Region 2024 & 2032
- Figure 3: North America Amorphous Polyester Resins Revenue (million), by Application 2024 & 2032
- Figure 4: North America Amorphous Polyester Resins Volume (K), by Application 2024 & 2032
- Figure 5: North America Amorphous Polyester Resins Revenue Share (%), by Application 2024 & 2032
- Figure 6: North America Amorphous Polyester Resins Volume Share (%), by Application 2024 & 2032
- Figure 7: North America Amorphous Polyester Resins Revenue (million), by Type 2024 & 2032
- Figure 8: North America Amorphous Polyester Resins Volume (K), by Type 2024 & 2032
- Figure 9: North America Amorphous Polyester Resins Revenue Share (%), by Type 2024 & 2032
- Figure 10: North America Amorphous Polyester Resins Volume Share (%), by Type 2024 & 2032
- Figure 11: North America Amorphous Polyester Resins Revenue (million), by Country 2024 & 2032
- Figure 12: North America Amorphous Polyester Resins Volume (K), by Country 2024 & 2032
- Figure 13: North America Amorphous Polyester Resins Revenue Share (%), by Country 2024 & 2032
- Figure 14: North America Amorphous Polyester Resins Volume Share (%), by Country 2024 & 2032
- Figure 15: South America Amorphous Polyester Resins Revenue (million), by Application 2024 & 2032
- Figure 16: South America Amorphous Polyester Resins Volume (K), by Application 2024 & 2032
- Figure 17: South America Amorphous Polyester Resins Revenue Share (%), by Application 2024 & 2032
- Figure 18: South America Amorphous Polyester Resins Volume Share (%), by Application 2024 & 2032
- Figure 19: South America Amorphous Polyester Resins Revenue (million), by Type 2024 & 2032
- Figure 20: South America Amorphous Polyester Resins Volume (K), by Type 2024 & 2032
- Figure 21: South America Amorphous Polyester Resins Revenue Share (%), by Type 2024 & 2032
- Figure 22: South America Amorphous Polyester Resins Volume Share (%), by Type 2024 & 2032
- Figure 23: South America Amorphous Polyester Resins Revenue (million), by Country 2024 & 2032
- Figure 24: South America Amorphous Polyester Resins Volume (K), by Country 2024 & 2032
- Figure 25: South America Amorphous Polyester Resins Revenue Share (%), by Country 2024 & 2032
- Figure 26: South America Amorphous Polyester Resins Volume Share (%), by Country 2024 & 2032
- Figure 27: Europe Amorphous Polyester Resins Revenue (million), by Application 2024 & 2032
- Figure 28: Europe Amorphous Polyester Resins Volume (K), by Application 2024 & 2032
- Figure 29: Europe Amorphous Polyester Resins Revenue Share (%), by Application 2024 & 2032
- Figure 30: Europe Amorphous Polyester Resins Volume Share (%), by Application 2024 & 2032
- Figure 31: Europe Amorphous Polyester Resins Revenue (million), by Type 2024 & 2032
- Figure 32: Europe Amorphous Polyester Resins Volume (K), by Type 2024 & 2032
- Figure 33: Europe Amorphous Polyester Resins Revenue Share (%), by Type 2024 & 2032
- Figure 34: Europe Amorphous Polyester Resins Volume Share (%), by Type 2024 & 2032
- Figure 35: Europe Amorphous Polyester Resins Revenue (million), by Country 2024 & 2032
- Figure 36: Europe Amorphous Polyester Resins Volume (K), by Country 2024 & 2032
- Figure 37: Europe Amorphous Polyester Resins Revenue Share (%), by Country 2024 & 2032
- Figure 38: Europe Amorphous Polyester Resins Volume Share (%), by Country 2024 & 2032
- Figure 39: Middle East & Africa Amorphous Polyester Resins Revenue (million), by Application 2024 & 2032
- Figure 40: Middle East & Africa Amorphous Polyester Resins Volume (K), by Application 2024 & 2032
- Figure 41: Middle East & Africa Amorphous Polyester Resins Revenue Share (%), by Application 2024 & 2032
- Figure 42: Middle East & Africa Amorphous Polyester Resins Volume Share (%), by Application 2024 & 2032
- Figure 43: Middle East & Africa Amorphous Polyester Resins Revenue (million), by Type 2024 & 2032
- Figure 44: Middle East & Africa Amorphous Polyester Resins Volume (K), by Type 2024 & 2032
- Figure 45: Middle East & Africa Amorphous Polyester Resins Revenue Share (%), by Type 2024 & 2032
- Figure 46: Middle East & Africa Amorphous Polyester Resins Volume Share (%), by Type 2024 & 2032
- Figure 47: Middle East & Africa Amorphous Polyester Resins Revenue (million), by Country 2024 & 2032
- Figure 48: Middle East & Africa Amorphous Polyester Resins Volume (K), by Country 2024 & 2032
- Figure 49: Middle East & Africa Amorphous Polyester Resins Revenue Share (%), by Country 2024 & 2032
- Figure 50: Middle East & Africa Amorphous Polyester Resins Volume Share (%), by Country 2024 & 2032
- Figure 51: Asia Pacific Amorphous Polyester Resins Revenue (million), by Application 2024 & 2032
- Figure 52: Asia Pacific Amorphous Polyester Resins Volume (K), by Application 2024 & 2032
- Figure 53: Asia Pacific Amorphous Polyester Resins Revenue Share (%), by Application 2024 & 2032
- Figure 54: Asia Pacific Amorphous Polyester Resins Volume Share (%), by Application 2024 & 2032
- Figure 55: Asia Pacific Amorphous Polyester Resins Revenue (million), by Type 2024 & 2032
- Figure 56: Asia Pacific Amorphous Polyester Resins Volume (K), by Type 2024 & 2032
- Figure 57: Asia Pacific Amorphous Polyester Resins Revenue Share (%), by Type 2024 & 2032
- Figure 58: Asia Pacific Amorphous Polyester Resins Volume Share (%), by Type 2024 & 2032
- Figure 59: Asia Pacific Amorphous Polyester Resins Revenue (million), by Country 2024 & 2032
- Figure 60: Asia Pacific Amorphous Polyester Resins Volume (K), by Country 2024 & 2032
- Figure 61: Asia Pacific Amorphous Polyester Resins Revenue Share (%), by Country 2024 & 2032
- Figure 62: Asia Pacific Amorphous Polyester Resins Volume Share (%), by Country 2024 & 2032
List of Tables
- Table 1: Global Amorphous Polyester Resins Revenue million Forecast, by Region 2019 & 2032
- Table 2: Global Amorphous Polyester Resins Volume K Forecast, by Region 2019 & 2032
- Table 3: Global Amorphous Polyester Resins Revenue million Forecast, by Application 2019 & 2032
- Table 4: Global Amorphous Polyester Resins Volume K Forecast, by Application 2019 & 2032
- Table 5: Global Amorphous Polyester Resins Revenue million Forecast, by Type 2019 & 2032
- Table 6: Global Amorphous Polyester Resins Volume K Forecast, by Type 2019 & 2032
- Table 7: Global Amorphous Polyester Resins Revenue million Forecast, by Region 2019 & 2032
- Table 8: Global Amorphous Polyester Resins Volume K Forecast, by Region 2019 & 2032
- Table 9: Global Amorphous Polyester Resins Revenue million Forecast, by Application 2019 & 2032
- Table 10: Global Amorphous Polyester Resins Volume K Forecast, by Application 2019 & 2032
- Table 11: Global Amorphous Polyester Resins Revenue million Forecast, by Type 2019 & 2032
- Table 12: Global Amorphous Polyester Resins Volume K Forecast, by Type 2019 & 2032
- Table 13: Global Amorphous Polyester Resins Revenue million Forecast, by Country 2019 & 2032
- Table 14: Global Amorphous Polyester Resins Volume K Forecast, by Country 2019 & 2032
- Table 15: United States Amorphous Polyester Resins Revenue (million) Forecast, by Application 2019 & 2032
- Table 16: United States Amorphous Polyester Resins Volume (K) Forecast, by Application 2019 & 2032
- Table 17: Canada Amorphous Polyester Resins Revenue (million) Forecast, by Application 2019 & 2032
- Table 18: Canada Amorphous Polyester Resins Volume (K) Forecast, by Application 2019 & 2032
- Table 19: Mexico Amorphous Polyester Resins Revenue (million) Forecast, by Application 2019 & 2032
- Table 20: Mexico Amorphous Polyester Resins Volume (K) Forecast, by Application 2019 & 2032
- Table 21: Global Amorphous Polyester Resins Revenue million Forecast, by Application 2019 & 2032
- Table 22: Global Amorphous Polyester Resins Volume K Forecast, by Application 2019 & 2032
- Table 23: Global Amorphous Polyester Resins Revenue million Forecast, by Type 2019 & 2032
- Table 24: Global Amorphous Polyester Resins Volume K Forecast, by Type 2019 & 2032
- Table 25: Global Amorphous Polyester Resins Revenue million Forecast, by Country 2019 & 2032
- Table 26: Global Amorphous Polyester Resins Volume K Forecast, by Country 2019 & 2032
- Table 27: Brazil Amorphous Polyester Resins Revenue (million) Forecast, by Application 2019 & 2032
- Table 28: Brazil Amorphous Polyester Resins Volume (K) Forecast, by Application 2019 & 2032
- Table 29: Argentina Amorphous Polyester Resins Revenue (million) Forecast, by Application 2019 & 2032
- Table 30: Argentina Amorphous Polyester Resins Volume (K) Forecast, by Application 2019 & 2032
- Table 31: Rest of South America Amorphous Polyester Resins Revenue (million) Forecast, by Application 2019 & 2032
- Table 32: Rest of South America Amorphous Polyester Resins Volume (K) Forecast, by Application 2019 & 2032
- Table 33: Global Amorphous Polyester Resins Revenue million Forecast, by Application 2019 & 2032
- Table 34: Global Amorphous Polyester Resins Volume K Forecast, by Application 2019 & 2032
- Table 35: Global Amorphous Polyester Resins Revenue million Forecast, by Type 2019 & 2032
- Table 36: Global Amorphous Polyester Resins Volume K Forecast, by Type 2019 & 2032
- Table 37: Global Amorphous Polyester Resins Revenue million Forecast, by Country 2019 & 2032
- Table 38: Global Amorphous Polyester Resins Volume K Forecast, by Country 2019 & 2032
- Table 39: United Kingdom Amorphous Polyester Resins Revenue (million) Forecast, by Application 2019 & 2032
- Table 40: United Kingdom Amorphous Polyester Resins Volume (K) Forecast, by Application 2019 & 2032
- Table 41: Germany Amorphous Polyester Resins Revenue (million) Forecast, by Application 2019 & 2032
- Table 42: Germany Amorphous Polyester Resins Volume (K) Forecast, by Application 2019 & 2032
- Table 43: France Amorphous Polyester Resins Revenue (million) Forecast, by Application 2019 & 2032
- Table 44: France Amorphous Polyester Resins Volume (K) Forecast, by Application 2019 & 2032
- Table 45: Italy Amorphous Polyester Resins Revenue (million) Forecast, by Application 2019 & 2032
- Table 46: Italy Amorphous Polyester Resins Volume (K) Forecast, by Application 2019 & 2032
- Table 47: Spain Amorphous Polyester Resins Revenue (million) Forecast, by Application 2019 & 2032
- Table 48: Spain Amorphous Polyester Resins Volume (K) Forecast, by Application 2019 & 2032
- Table 49: Russia Amorphous Polyester Resins Revenue (million) Forecast, by Application 2019 & 2032
- Table 50: Russia Amorphous Polyester Resins Volume (K) Forecast, by Application 2019 & 2032
- Table 51: Benelux Amorphous Polyester Resins Revenue (million) Forecast, by Application 2019 & 2032
- Table 52: Benelux Amorphous Polyester Resins Volume (K) Forecast, by Application 2019 & 2032
- Table 53: Nordics Amorphous Polyester Resins Revenue (million) Forecast, by Application 2019 & 2032
- Table 54: Nordics Amorphous Polyester Resins Volume (K) Forecast, by Application 2019 & 2032
- Table 55: Rest of Europe Amorphous Polyester Resins Revenue (million) Forecast, by Application 2019 & 2032
- Table 56: Rest of Europe Amorphous Polyester Resins Volume (K) Forecast, by Application 2019 & 2032
- Table 57: Global Amorphous Polyester Resins Revenue million Forecast, by Application 2019 & 2032
- Table 58: Global Amorphous Polyester Resins Volume K Forecast, by Application 2019 & 2032
- Table 59: Global Amorphous Polyester Resins Revenue million Forecast, by Type 2019 & 2032
- Table 60: Global Amorphous Polyester Resins Volume K Forecast, by Type 2019 & 2032
- Table 61: Global Amorphous Polyester Resins Revenue million Forecast, by Country 2019 & 2032
- Table 62: Global Amorphous Polyester Resins Volume K Forecast, by Country 2019 & 2032
- Table 63: Turkey Amorphous Polyester Resins Revenue (million) Forecast, by Application 2019 & 2032
- Table 64: Turkey Amorphous Polyester Resins Volume (K) Forecast, by Application 2019 & 2032
- Table 65: Israel Amorphous Polyester Resins Revenue (million) Forecast, by Application 2019 & 2032
- Table 66: Israel Amorphous Polyester Resins Volume (K) Forecast, by Application 2019 & 2032
- Table 67: GCC Amorphous Polyester Resins Revenue (million) Forecast, by Application 2019 & 2032
- Table 68: GCC Amorphous Polyester Resins Volume (K) Forecast, by Application 2019 & 2032
- Table 69: North Africa Amorphous Polyester Resins Revenue (million) Forecast, by Application 2019 & 2032
- Table 70: North Africa Amorphous Polyester Resins Volume (K) Forecast, by Application 2019 & 2032
- Table 71: South Africa Amorphous Polyester Resins Revenue (million) Forecast, by Application 2019 & 2032
- Table 72: South Africa Amorphous Polyester Resins Volume (K) Forecast, by Application 2019 & 2032
- Table 73: Rest of Middle East & Africa Amorphous Polyester Resins Revenue (million) Forecast, by Application 2019 & 2032
- Table 74: Rest of Middle East & Africa Amorphous Polyester Resins Volume (K) Forecast, by Application 2019 & 2032
- Table 75: Global Amorphous Polyester Resins Revenue million Forecast, by Application 2019 & 2032
- Table 76: Global Amorphous Polyester Resins Volume K Forecast, by Application 2019 & 2032
- Table 77: Global Amorphous Polyester Resins Revenue million Forecast, by Type 2019 & 2032
- Table 78: Global Amorphous Polyester Resins Volume K Forecast, by Type 2019 & 2032
- Table 79: Global Amorphous Polyester Resins Revenue million Forecast, by Country 2019 & 2032
- Table 80: Global Amorphous Polyester Resins Volume K Forecast, by Country 2019 & 2032
- Table 81: China Amorphous Polyester Resins Revenue (million) Forecast, by Application 2019 & 2032
- Table 82: China Amorphous Polyester Resins Volume (K) Forecast, by Application 2019 & 2032
- Table 83: India Amorphous Polyester Resins Revenue (million) Forecast, by Application 2019 & 2032
- Table 84: India Amorphous Polyester Resins Volume (K) Forecast, by Application 2019 & 2032
- Table 85: Japan Amorphous Polyester Resins Revenue (million) Forecast, by Application 2019 & 2032
- Table 86: Japan Amorphous Polyester Resins Volume (K) Forecast, by Application 2019 & 2032
- Table 87: South Korea Amorphous Polyester Resins Revenue (million) Forecast, by Application 2019 & 2032
- Table 88: South Korea Amorphous Polyester Resins Volume (K) Forecast, by Application 2019 & 2032
- Table 89: ASEAN Amorphous Polyester Resins Revenue (million) Forecast, by Application 2019 & 2032
- Table 90: ASEAN Amorphous Polyester Resins Volume (K) Forecast, by Application 2019 & 2032
- Table 91: Oceania Amorphous Polyester Resins Revenue (million) Forecast, by Application 2019 & 2032
- Table 92: Oceania Amorphous Polyester Resins Volume (K) Forecast, by Application 2019 & 2032
- Table 93: Rest of Asia Pacific Amorphous Polyester Resins Revenue (million) Forecast, by Application 2019 & 2032
- Table 94: Rest of Asia Pacific Amorphous Polyester Resins Volume (K) Forecast, by Application 2019 & 2032
Frequently Asked Questions
1. What is the projected Compound Annual Growth Rate (CAGR) of the Amorphous Polyester Resins?
The projected CAGR is approximately 5.7%.
2. Which companies are prominent players in the Amorphous Polyester Resins?
Key companies in the market include Evonik, Toyobo, Eastman, SK Chemicals, Arkema, Covestro, Mitsubishi Chemical, Allnex, Macroocean, Shanghai Tianyang.
3. What are the main segments of the Amorphous Polyester Resins?
The market segments include Application, Type.
4. Can you provide details about the market size?
The market size is estimated to be USD 5828 million as of 2022.
5. What are some drivers contributing to market growth?
N/A
6. What are the notable trends driving market growth?
N/A
7. Are there any restraints impacting market growth?
N/A
8. Can you provide examples of recent developments in the market?
N/A
9. What pricing options are available for accessing the report?
Pricing options include single-user, multi-user, and enterprise licenses priced at USD 3950.00, USD 5925.00, and USD 7900.00 respectively.
10. Is the market size provided in terms of value or volume?
The market size is provided in terms of value, measured in million and volume, measured in K.
11. Are there any specific market keywords associated with the report?
Yes, the market keyword associated with the report is "Amorphous Polyester Resins," which aids in identifying and referencing the specific market segment covered.
12. How do I determine which pricing option suits my needs best?
The pricing options vary based on user requirements and access needs. Individual users may opt for single-user licenses, while businesses requiring broader access may choose multi-user or enterprise licenses for cost-effective access to the report.
13. Are there any additional resources or data provided in the Amorphous Polyester Resins report?
While the report offers comprehensive insights, it's advisable to review the specific contents or supplementary materials provided to ascertain if additional resources or data are available.
14. How can I stay updated on further developments or reports in the Amorphous Polyester Resins?
To stay informed about further developments, trends, and reports in the Amorphous Polyester Resins, consider subscribing to industry newsletters, following relevant companies and organizations, or regularly checking reputable industry news sources and publications.
Methodology
Step 1 - Identification of Relevant Samples Size from Population Database


Step 2 - Approaches for Defining Global Market Size (Value, Volume* & Price*)

Note*: In applicable scenarios
Step 3 - Data Sources
Primary Research
- Web Analytics
- Survey Reports
- Research Institute
- Latest Research Reports
- Opinion Leaders
Secondary Research
- Annual Reports
- White Paper
- Latest Press Release
- Industry Association
- Paid Database
- Investor Presentations

Step 4 - Data Triangulation
Involves using different sources of information in order to increase the validity of a study
These sources are likely to be stakeholders in a program - participants, other researchers, program staff, other community members, and so on.
Then we put all data in single framework & apply various statistical tools to find out the dynamic on the market.
During the analysis stage, feedback from the stakeholder groups would be compared to determine areas of agreement as well as areas of divergence
