

Key Insights
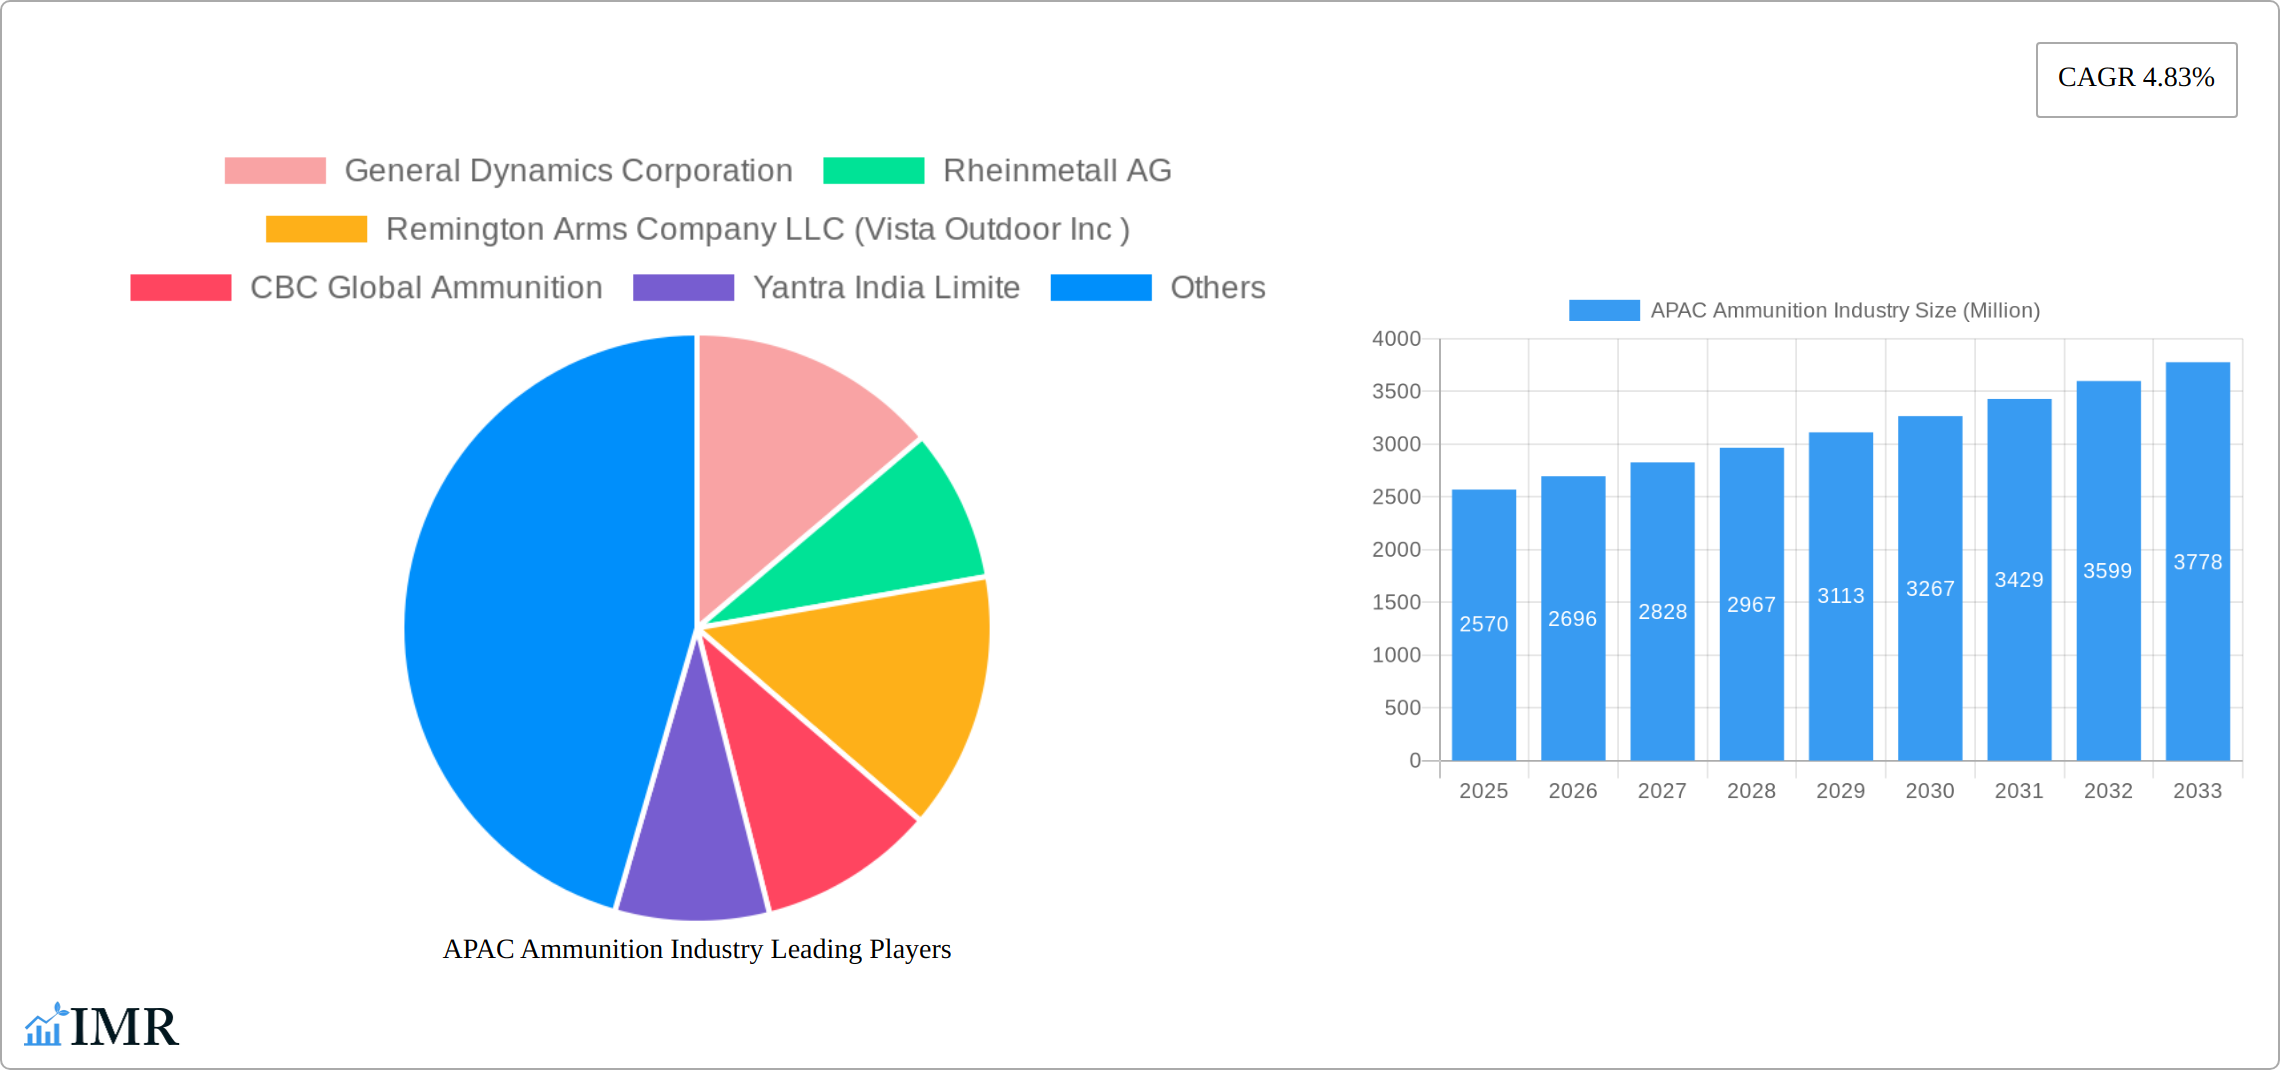
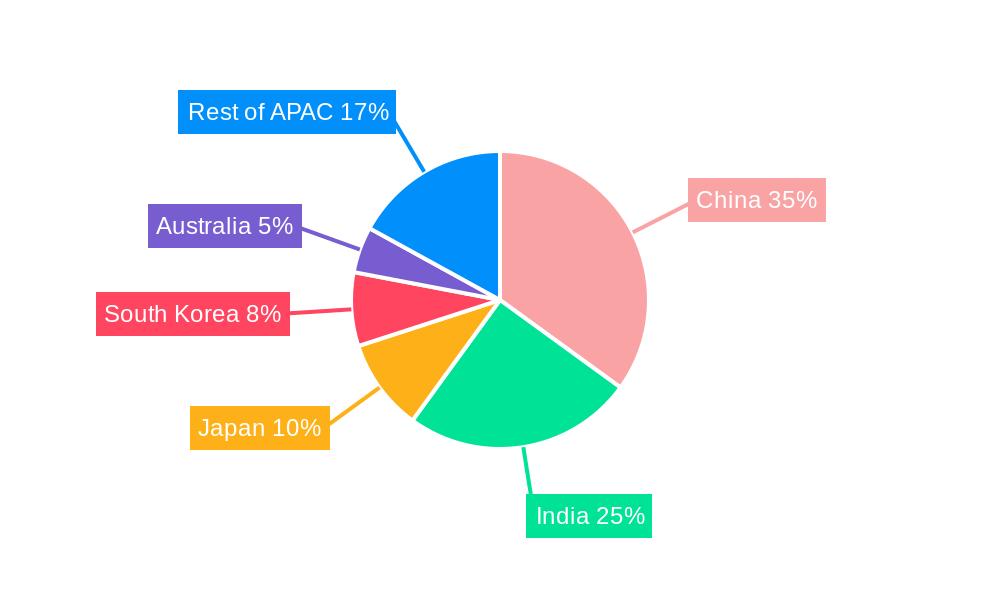
The Asia-Pacific (APAC) ammunition market, valued at $2.57 billion in 2025, is projected to experience robust growth, driven by increasing defense budgets across the region, particularly in countries like India and China. This growth is further fueled by rising internal security concerns and the modernization of armed forces in several APAC nations. The market is segmented by caliber (small, medium, large), end-user (civilian & law enforcement, military), and country (China, India, Japan, South Korea, Australia, and Rest of APAC). China and India are expected to dominate the market due to their substantial military spending and large populations. The increasing adoption of advanced ammunition technologies, including smart ammunition and precision-guided munitions, will also contribute significantly to market expansion. However, stringent regulations on ammunition sales and environmental concerns surrounding the production and disposal of ammunition are likely to pose challenges to the industry's growth. The competitive landscape is characterized by a mix of both international and domestic players, with companies like General Dynamics, Rheinmetall, and several prominent Asian manufacturers vying for market share. The forecast period (2025-2033) anticipates continued growth, propelled by ongoing geopolitical tensions and modernization efforts within the defense sector across the APAC region. While precise figures for individual countries within the "Rest of APAC" segment are unavailable, the overall CAGR of 4.83% suggests a steady expansion across all market segments.
Growth in the APAC ammunition market will be significantly influenced by the evolving geopolitical landscape, with potential conflicts and territorial disputes driving demand. The increasing focus on counter-terrorism and internal security measures in several nations will also boost ammunition sales. Furthermore, the expanding civilian and sporting market for firearms in certain APAC countries will further contribute to overall growth. However, potential future economic slowdowns or shifts in governmental priorities could impact overall spending on defense and security, thereby moderating the market's expansion. The industry's response to environmental concerns through sustainable manufacturing practices and responsible disposal solutions will also play a crucial role in shaping the long-term trajectory of the market. Technological advancements continue to be a key driver of innovation, with manufacturers continuously improving ammunition performance and effectiveness.
APAC Ammunition Industry Market Report: 2019-2033
This comprehensive report provides a detailed analysis of the Asia-Pacific (APAC) ammunition industry, covering market dynamics, growth trends, key players, and future outlook. The report utilizes data from 2019-2024 (historical period), with 2025 as the base year and forecasts extending to 2033. The study encompasses various segments including ammunition type (small, medium, and large caliber), end-users (military, civilian & law enforcement), and key APAC countries (China, India, Japan, South Korea, Australia, and Rest of APAC).
APAC Ammunition Industry Market Dynamics & Structure
The APAC ammunition market is characterized by a moderately concentrated structure with a few dominant players and numerous smaller regional manufacturers. Technological innovation, particularly in guided munitions and smart ammunition, is a key driver. Stringent regulatory frameworks governing ammunition production, storage, and usage vary across countries, impacting market dynamics. The market witnesses ongoing consolidation through mergers and acquisitions (M&A), with larger players acquiring smaller companies to expand their market share and product portfolios. Substitute products, such as non-lethal crowd control technologies, are emerging, though their impact remains limited compared to traditional ammunition. The end-user demographics are diverse, ranging from national defense forces to civilian shooting enthusiasts.
- Market Concentration: Moderately concentrated, with top 5 players holding approximately xx% market share in 2024.
- Technological Innovation: Focus on precision-guided munitions, smart ammunition, and reduced collateral damage technologies.
- Regulatory Framework: Stringent regulations vary significantly across countries, influencing production and distribution.
- M&A Activity: xx deals recorded in the past 5 years, primarily focused on expanding product lines and geographic reach.
- Innovation Barriers: High R&D costs, stringent testing & certification processes, and complex regulatory approvals.
APAC Ammunition Industry Growth Trends & Insights
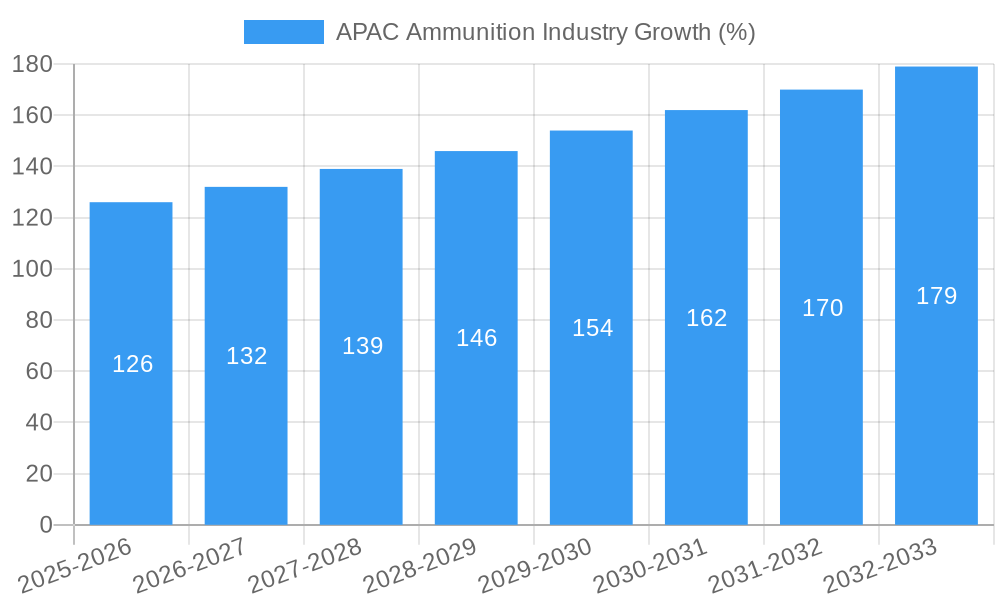
The APAC ammunition market exhibited a CAGR of xx% during 2019-2024, driven by increased military spending, rising demand for self-defense among civilians, and expanding law enforcement budgets. The market is expected to maintain a steady growth trajectory, with a projected CAGR of xx% from 2025 to 2033. This growth is influenced by factors including geopolitical instability, modernization of armed forces, and increasing urbanization leading to higher crime rates in some areas. Technological advancements, particularly in smart munitions, are further fueling market expansion. Consumer behavior is shifting towards more advanced and technologically superior ammunition products. Market penetration of advanced ammunition types is expected to increase significantly in the forecast period.
Dominant Regions, Countries, or Segments in APAC Ammunition Industry
China and India are the dominant markets in the APAC ammunition industry, primarily due to substantial military spending and large domestic demand. The military segment holds the largest market share, followed by law enforcement and civilian sectors. Within ammunition types, small caliber ammunition dominates in terms of volume, while large caliber ammunition commands higher value due to its specialized applications.
- Key Drivers (China): Significant military modernization programs, focus on domestic manufacturing, and strong economic growth.
- Key Drivers (India): Increasing defense budgets, modernization of armed forces, and a focus on indigenous ammunition production.
- Market Share: China holds approximately xx% of the market, while India accounts for xx%. The military segment constitutes about xx% of total market volume.
- Growth Potential: The Rest of APAC region presents significant growth potential due to increasing defense spending and modernization initiatives.
APAC Ammunition Industry Product Landscape
The APAC ammunition market offers a wide range of products, encompassing small, medium, and large caliber ammunition. Innovations focus on enhanced accuracy, reduced recoil, improved lethality, and specialized functionalities like guided munitions and smart projectiles. These advancements cater to diverse applications, from small arms to heavy artillery. Key selling propositions include superior range, accuracy, and reduced collateral damage.
Key Drivers, Barriers & Challenges in APAP Ammunition Industry
Key Drivers:
- Increased defense spending across several APAC nations.
- Modernization of armed forces and adoption of advanced weaponry.
- Growing demand for self-defense products in civilian markets.
- Technological advancements leading to improved ammunition performance.
Challenges & Restraints:
- Stringent regulations and export controls impact market growth.
- Supply chain disruptions due to geopolitical tensions and raw material scarcity.
- Intense competition among domestic and international players.
- Environmental concerns related to ammunition production and disposal.
Emerging Opportunities in APAC Ammunition Industry
- Growing demand for precision-guided munitions in counter-terrorism operations.
- Expanding markets for less-lethal ammunition for law enforcement.
- Increasing adoption of smart ammunition with advanced functionalities.
- Opportunities in developing specialized ammunition for niche applications.
Growth Accelerators in the APAC Ammunition Industry
Technological breakthroughs in ammunition design and manufacturing are expected to drive long-term growth. Strategic partnerships between domestic and international companies are also facilitating market expansion. Investments in research and development of advanced ammunition systems will further accelerate market growth.
Key Players Shaping the APAC Ammunition Industry Market
- General Dynamics Corporation
- Rheinmetall AG
- Remington Arms Company LLC (Vista Outdoor Inc)
- CBC Global Ammunition
- Yantra India Limited
- BAE Systems PLC
- Winchester Ammunition (Olin Corporation)
- Munitions India Limited
- Singapore Technologies Engineering Ltd
- Poongson Corporation
- Hanwha Corporation
- KNDS NV
Notable Milestones in APAC Ammunition Industry Sector
- February 2024: China showcased its newly developed ASN-301 loitering munition, highlighting advancements in precision-guided munitions.
- February 2023: The Indian MoD selected five domestic ammunition manufacturers to supply 2,000 155mm terminally guided munitions, boosting domestic production.
In-Depth APAC Ammunition Industry Market Outlook
The APAC ammunition market is poised for continued growth, driven by sustained military spending, technological advancements, and the increasing demand for advanced ammunition systems. Strategic partnerships, investments in R&D, and the focus on domestic manufacturing will further shape the market landscape. The emergence of smart ammunition and other innovative technologies presents significant opportunities for market expansion and increased revenue generation.
APAC Ammunition Industry Segmentation
- 1. Production Analysis
- 2. Consumption Analysis
- 3. Import Market Analysis (Value & Volume)
- 4. Export Market Analysis (Value & Volume)
- 5. Price Trend Analysis
APAC Ammunition Industry Segmentation By Geography
-
1. North America
- 1.1. United States
- 1.2. Canada
- 1.3. Mexico
-
2. South America
- 2.1. Brazil
- 2.2. Argentina
- 2.3. Rest of South America
-
3. Europe
- 3.1. United Kingdom
- 3.2. Germany
- 3.3. France
- 3.4. Italy
- 3.5. Spain
- 3.6. Russia
- 3.7. Benelux
- 3.8. Nordics
- 3.9. Rest of Europe
-
4. Middle East & Africa
- 4.1. Turkey
- 4.2. Israel
- 4.3. GCC
- 4.4. North Africa
- 4.5. South Africa
- 4.6. Rest of Middle East & Africa
-
5. Asia Pacific
- 5.1. China
- 5.2. India
- 5.3. Japan
- 5.4. South Korea
- 5.5. ASEAN
- 5.6. Oceania
- 5.7. Rest of Asia Pacific
APAC Ammunition Industry REPORT HIGHLIGHTS
| Aspects | Details |
|---|---|
| Study Period | 2019-2033 |
| Base Year | 2024 |
| Estimated Year | 2025 |
| Forecast Period | 2025-2033 |
| Historical Period | 2019-2024 |
| Growth Rate | CAGR of 4.83% from 2019-2033 |
| Segmentation |
|
Table of Contents
- 1. Introduction
- 1.1. Research Scope
- 1.2. Market Segmentation
- 1.3. Research Methodology
- 1.4. Definitions and Assumptions
- 2. Executive Summary
- 2.1. Introduction
- 3. Market Dynamics
- 3.1. Introduction
- 3.2. Market Drivers
- 3.2.1. ; Increasing Number Of Air Passengers; Use Of Portable Electronic Devices
- 3.3. Market Restrains
- 3.3.1. ; High Cost Of Connectivity Equipments
- 3.4. Market Trends
- 3.4.1. Military Segment is Expected to Dominate the Market During the Forecast Period
- 4. Market Factor Analysis
- 4.1. Porters Five Forces
- 4.2. Supply/Value Chain
- 4.3. PESTEL analysis
- 4.4. Market Entropy
- 4.5. Patent/Trademark Analysis
- 5. Global APAC Ammunition Industry Analysis, Insights and Forecast, 2019-2031
- 5.1. Market Analysis, Insights and Forecast - by Production Analysis
- 5.2. Market Analysis, Insights and Forecast - by Consumption Analysis
- 5.3. Market Analysis, Insights and Forecast - by Import Market Analysis (Value & Volume)
- 5.4. Market Analysis, Insights and Forecast - by Export Market Analysis (Value & Volume)
- 5.5. Market Analysis, Insights and Forecast - by Price Trend Analysis
- 5.6. Market Analysis, Insights and Forecast - by Region
- 5.6.1. North America
- 5.6.2. South America
- 5.6.3. Europe
- 5.6.4. Middle East & Africa
- 5.6.5. Asia Pacific
- 5.1. Market Analysis, Insights and Forecast - by Production Analysis
- 6. North America APAC Ammunition Industry Analysis, Insights and Forecast, 2019-2031
- 6.1. Market Analysis, Insights and Forecast - by Production Analysis
- 6.2. Market Analysis, Insights and Forecast - by Consumption Analysis
- 6.3. Market Analysis, Insights and Forecast - by Import Market Analysis (Value & Volume)
- 6.4. Market Analysis, Insights and Forecast - by Export Market Analysis (Value & Volume)
- 6.5. Market Analysis, Insights and Forecast - by Price Trend Analysis
- 6.1. Market Analysis, Insights and Forecast - by Production Analysis
- 7. South America APAC Ammunition Industry Analysis, Insights and Forecast, 2019-2031
- 7.1. Market Analysis, Insights and Forecast - by Production Analysis
- 7.2. Market Analysis, Insights and Forecast - by Consumption Analysis
- 7.3. Market Analysis, Insights and Forecast - by Import Market Analysis (Value & Volume)
- 7.4. Market Analysis, Insights and Forecast - by Export Market Analysis (Value & Volume)
- 7.5. Market Analysis, Insights and Forecast - by Price Trend Analysis
- 7.1. Market Analysis, Insights and Forecast - by Production Analysis
- 8. Europe APAC Ammunition Industry Analysis, Insights and Forecast, 2019-2031
- 8.1. Market Analysis, Insights and Forecast - by Production Analysis
- 8.2. Market Analysis, Insights and Forecast - by Consumption Analysis
- 8.3. Market Analysis, Insights and Forecast - by Import Market Analysis (Value & Volume)
- 8.4. Market Analysis, Insights and Forecast - by Export Market Analysis (Value & Volume)
- 8.5. Market Analysis, Insights and Forecast - by Price Trend Analysis
- 8.1. Market Analysis, Insights and Forecast - by Production Analysis
- 9. Middle East & Africa APAC Ammunition Industry Analysis, Insights and Forecast, 2019-2031
- 9.1. Market Analysis, Insights and Forecast - by Production Analysis
- 9.2. Market Analysis, Insights and Forecast - by Consumption Analysis
- 9.3. Market Analysis, Insights and Forecast - by Import Market Analysis (Value & Volume)
- 9.4. Market Analysis, Insights and Forecast - by Export Market Analysis (Value & Volume)
- 9.5. Market Analysis, Insights and Forecast - by Price Trend Analysis
- 9.1. Market Analysis, Insights and Forecast - by Production Analysis
- 10. Asia Pacific APAC Ammunition Industry Analysis, Insights and Forecast, 2019-2031
- 10.1. Market Analysis, Insights and Forecast - by Production Analysis
- 10.2. Market Analysis, Insights and Forecast - by Consumption Analysis
- 10.3. Market Analysis, Insights and Forecast - by Import Market Analysis (Value & Volume)
- 10.4. Market Analysis, Insights and Forecast - by Export Market Analysis (Value & Volume)
- 10.5. Market Analysis, Insights and Forecast - by Price Trend Analysis
- 10.1. Market Analysis, Insights and Forecast - by Production Analysis
- 11. United Kingdom APAC Ammunition Industry Analysis, Insights and Forecast, 2019-2031
- 11.1. Market Analysis, Insights and Forecast - By Country/Sub-region
- 11.1.1.
- 12. France APAC Ammunition Industry Analysis, Insights and Forecast, 2019-2031
- 12.1. Market Analysis, Insights and Forecast - By Country/Sub-region
- 12.1.1.
- 13. Germany APAC Ammunition Industry Analysis, Insights and Forecast, 2019-2031
- 13.1. Market Analysis, Insights and Forecast - By Country/Sub-region
- 13.1.1.
- 14. Russia APAC Ammunition Industry Analysis, Insights and Forecast, 2019-2031
- 14.1. Market Analysis, Insights and Forecast - By Country/Sub-region
- 14.1.1.
- 15. Rest of Europe APAC Ammunition Industry Analysis, Insights and Forecast, 2019-2031
- 15.1. Market Analysis, Insights and Forecast - By Country/Sub-region
- 15.1.1.
- 16. Competitive Analysis
- 16.1. Global Market Share Analysis 2024
- 16.2. Company Profiles
- 16.2.1 General Dynamics Corporation
- 16.2.1.1. Overview
- 16.2.1.2. Products
- 16.2.1.3. SWOT Analysis
- 16.2.1.4. Recent Developments
- 16.2.1.5. Financials (Based on Availability)
- 16.2.2 Rheinmetall AG
- 16.2.2.1. Overview
- 16.2.2.2. Products
- 16.2.2.3. SWOT Analysis
- 16.2.2.4. Recent Developments
- 16.2.2.5. Financials (Based on Availability)
- 16.2.3 Remington Arms Company LLC (Vista Outdoor Inc )
- 16.2.3.1. Overview
- 16.2.3.2. Products
- 16.2.3.3. SWOT Analysis
- 16.2.3.4. Recent Developments
- 16.2.3.5. Financials (Based on Availability)
- 16.2.4 CBC Global Ammunition
- 16.2.4.1. Overview
- 16.2.4.2. Products
- 16.2.4.3. SWOT Analysis
- 16.2.4.4. Recent Developments
- 16.2.4.5. Financials (Based on Availability)
- 16.2.5 Yantra India Limite
- 16.2.5.1. Overview
- 16.2.5.2. Products
- 16.2.5.3. SWOT Analysis
- 16.2.5.4. Recent Developments
- 16.2.5.5. Financials (Based on Availability)
- 16.2.6 BAE Systems PLC
- 16.2.6.1. Overview
- 16.2.6.2. Products
- 16.2.6.3. SWOT Analysis
- 16.2.6.4. Recent Developments
- 16.2.6.5. Financials (Based on Availability)
- 16.2.7 Winchester Ammunition (Olin Corporation)
- 16.2.7.1. Overview
- 16.2.7.2. Products
- 16.2.7.3. SWOT Analysis
- 16.2.7.4. Recent Developments
- 16.2.7.5. Financials (Based on Availability)
- 16.2.8 Munitions India Limited
- 16.2.8.1. Overview
- 16.2.8.2. Products
- 16.2.8.3. SWOT Analysis
- 16.2.8.4. Recent Developments
- 16.2.8.5. Financials (Based on Availability)
- 16.2.9 Singapore Technologies Engineering Ltd
- 16.2.9.1. Overview
- 16.2.9.2. Products
- 16.2.9.3. SWOT Analysis
- 16.2.9.4. Recent Developments
- 16.2.9.5. Financials (Based on Availability)
- 16.2.10 Poongson Corporation
- 16.2.10.1. Overview
- 16.2.10.2. Products
- 16.2.10.3. SWOT Analysis
- 16.2.10.4. Recent Developments
- 16.2.10.5. Financials (Based on Availability)
- 16.2.11 Hanwha Corporation
- 16.2.11.1. Overview
- 16.2.11.2. Products
- 16.2.11.3. SWOT Analysis
- 16.2.11.4. Recent Developments
- 16.2.11.5. Financials (Based on Availability)
- 16.2.12 KNDS NV
- 16.2.12.1. Overview
- 16.2.12.2. Products
- 16.2.12.3. SWOT Analysis
- 16.2.12.4. Recent Developments
- 16.2.12.5. Financials (Based on Availability)
- 16.2.1 General Dynamics Corporation
List of Figures
- Figure 1: Global APAC Ammunition Industry Revenue Breakdown (Million, %) by Region 2024 & 2032
- Figure 2: United Kingdom APAC Ammunition Industry Revenue (Million), by Country 2024 & 2032
- Figure 3: United Kingdom APAC Ammunition Industry Revenue Share (%), by Country 2024 & 2032
- Figure 4: France APAC Ammunition Industry Revenue (Million), by Country 2024 & 2032
- Figure 5: France APAC Ammunition Industry Revenue Share (%), by Country 2024 & 2032
- Figure 6: Germany APAC Ammunition Industry Revenue (Million), by Country 2024 & 2032
- Figure 7: Germany APAC Ammunition Industry Revenue Share (%), by Country 2024 & 2032
- Figure 8: Russia APAC Ammunition Industry Revenue (Million), by Country 2024 & 2032
- Figure 9: Russia APAC Ammunition Industry Revenue Share (%), by Country 2024 & 2032
- Figure 10: Rest of Europe APAC Ammunition Industry Revenue (Million), by Country 2024 & 2032
- Figure 11: Rest of Europe APAC Ammunition Industry Revenue Share (%), by Country 2024 & 2032
- Figure 12: North America APAC Ammunition Industry Revenue (Million), by Production Analysis 2024 & 2032
- Figure 13: North America APAC Ammunition Industry Revenue Share (%), by Production Analysis 2024 & 2032
- Figure 14: North America APAC Ammunition Industry Revenue (Million), by Consumption Analysis 2024 & 2032
- Figure 15: North America APAC Ammunition Industry Revenue Share (%), by Consumption Analysis 2024 & 2032
- Figure 16: North America APAC Ammunition Industry Revenue (Million), by Import Market Analysis (Value & Volume) 2024 & 2032
- Figure 17: North America APAC Ammunition Industry Revenue Share (%), by Import Market Analysis (Value & Volume) 2024 & 2032
- Figure 18: North America APAC Ammunition Industry Revenue (Million), by Export Market Analysis (Value & Volume) 2024 & 2032
- Figure 19: North America APAC Ammunition Industry Revenue Share (%), by Export Market Analysis (Value & Volume) 2024 & 2032
- Figure 20: North America APAC Ammunition Industry Revenue (Million), by Price Trend Analysis 2024 & 2032
- Figure 21: North America APAC Ammunition Industry Revenue Share (%), by Price Trend Analysis 2024 & 2032
- Figure 22: North America APAC Ammunition Industry Revenue (Million), by Country 2024 & 2032
- Figure 23: North America APAC Ammunition Industry Revenue Share (%), by Country 2024 & 2032
- Figure 24: South America APAC Ammunition Industry Revenue (Million), by Production Analysis 2024 & 2032
- Figure 25: South America APAC Ammunition Industry Revenue Share (%), by Production Analysis 2024 & 2032
- Figure 26: South America APAC Ammunition Industry Revenue (Million), by Consumption Analysis 2024 & 2032
- Figure 27: South America APAC Ammunition Industry Revenue Share (%), by Consumption Analysis 2024 & 2032
- Figure 28: South America APAC Ammunition Industry Revenue (Million), by Import Market Analysis (Value & Volume) 2024 & 2032
- Figure 29: South America APAC Ammunition Industry Revenue Share (%), by Import Market Analysis (Value & Volume) 2024 & 2032
- Figure 30: South America APAC Ammunition Industry Revenue (Million), by Export Market Analysis (Value & Volume) 2024 & 2032
- Figure 31: South America APAC Ammunition Industry Revenue Share (%), by Export Market Analysis (Value & Volume) 2024 & 2032
- Figure 32: South America APAC Ammunition Industry Revenue (Million), by Price Trend Analysis 2024 & 2032
- Figure 33: South America APAC Ammunition Industry Revenue Share (%), by Price Trend Analysis 2024 & 2032
- Figure 34: South America APAC Ammunition Industry Revenue (Million), by Country 2024 & 2032
- Figure 35: South America APAC Ammunition Industry Revenue Share (%), by Country 2024 & 2032
- Figure 36: Europe APAC Ammunition Industry Revenue (Million), by Production Analysis 2024 & 2032
- Figure 37: Europe APAC Ammunition Industry Revenue Share (%), by Production Analysis 2024 & 2032
- Figure 38: Europe APAC Ammunition Industry Revenue (Million), by Consumption Analysis 2024 & 2032
- Figure 39: Europe APAC Ammunition Industry Revenue Share (%), by Consumption Analysis 2024 & 2032
- Figure 40: Europe APAC Ammunition Industry Revenue (Million), by Import Market Analysis (Value & Volume) 2024 & 2032
- Figure 41: Europe APAC Ammunition Industry Revenue Share (%), by Import Market Analysis (Value & Volume) 2024 & 2032
- Figure 42: Europe APAC Ammunition Industry Revenue (Million), by Export Market Analysis (Value & Volume) 2024 & 2032
- Figure 43: Europe APAC Ammunition Industry Revenue Share (%), by Export Market Analysis (Value & Volume) 2024 & 2032
- Figure 44: Europe APAC Ammunition Industry Revenue (Million), by Price Trend Analysis 2024 & 2032
- Figure 45: Europe APAC Ammunition Industry Revenue Share (%), by Price Trend Analysis 2024 & 2032
- Figure 46: Europe APAC Ammunition Industry Revenue (Million), by Country 2024 & 2032
- Figure 47: Europe APAC Ammunition Industry Revenue Share (%), by Country 2024 & 2032
- Figure 48: Middle East & Africa APAC Ammunition Industry Revenue (Million), by Production Analysis 2024 & 2032
- Figure 49: Middle East & Africa APAC Ammunition Industry Revenue Share (%), by Production Analysis 2024 & 2032
- Figure 50: Middle East & Africa APAC Ammunition Industry Revenue (Million), by Consumption Analysis 2024 & 2032
- Figure 51: Middle East & Africa APAC Ammunition Industry Revenue Share (%), by Consumption Analysis 2024 & 2032
- Figure 52: Middle East & Africa APAC Ammunition Industry Revenue (Million), by Import Market Analysis (Value & Volume) 2024 & 2032
- Figure 53: Middle East & Africa APAC Ammunition Industry Revenue Share (%), by Import Market Analysis (Value & Volume) 2024 & 2032
- Figure 54: Middle East & Africa APAC Ammunition Industry Revenue (Million), by Export Market Analysis (Value & Volume) 2024 & 2032
- Figure 55: Middle East & Africa APAC Ammunition Industry Revenue Share (%), by Export Market Analysis (Value & Volume) 2024 & 2032
- Figure 56: Middle East & Africa APAC Ammunition Industry Revenue (Million), by Price Trend Analysis 2024 & 2032
- Figure 57: Middle East & Africa APAC Ammunition Industry Revenue Share (%), by Price Trend Analysis 2024 & 2032
- Figure 58: Middle East & Africa APAC Ammunition Industry Revenue (Million), by Country 2024 & 2032
- Figure 59: Middle East & Africa APAC Ammunition Industry Revenue Share (%), by Country 2024 & 2032
- Figure 60: Asia Pacific APAC Ammunition Industry Revenue (Million), by Production Analysis 2024 & 2032
- Figure 61: Asia Pacific APAC Ammunition Industry Revenue Share (%), by Production Analysis 2024 & 2032
- Figure 62: Asia Pacific APAC Ammunition Industry Revenue (Million), by Consumption Analysis 2024 & 2032
- Figure 63: Asia Pacific APAC Ammunition Industry Revenue Share (%), by Consumption Analysis 2024 & 2032
- Figure 64: Asia Pacific APAC Ammunition Industry Revenue (Million), by Import Market Analysis (Value & Volume) 2024 & 2032
- Figure 65: Asia Pacific APAC Ammunition Industry Revenue Share (%), by Import Market Analysis (Value & Volume) 2024 & 2032
- Figure 66: Asia Pacific APAC Ammunition Industry Revenue (Million), by Export Market Analysis (Value & Volume) 2024 & 2032
- Figure 67: Asia Pacific APAC Ammunition Industry Revenue Share (%), by Export Market Analysis (Value & Volume) 2024 & 2032
- Figure 68: Asia Pacific APAC Ammunition Industry Revenue (Million), by Price Trend Analysis 2024 & 2032
- Figure 69: Asia Pacific APAC Ammunition Industry Revenue Share (%), by Price Trend Analysis 2024 & 2032
- Figure 70: Asia Pacific APAC Ammunition Industry Revenue (Million), by Country 2024 & 2032
- Figure 71: Asia Pacific APAC Ammunition Industry Revenue Share (%), by Country 2024 & 2032
List of Tables
- Table 1: Global APAC Ammunition Industry Revenue Million Forecast, by Region 2019 & 2032
- Table 2: Global APAC Ammunition Industry Revenue Million Forecast, by Production Analysis 2019 & 2032
- Table 3: Global APAC Ammunition Industry Revenue Million Forecast, by Consumption Analysis 2019 & 2032
- Table 4: Global APAC Ammunition Industry Revenue Million Forecast, by Import Market Analysis (Value & Volume) 2019 & 2032
- Table 5: Global APAC Ammunition Industry Revenue Million Forecast, by Export Market Analysis (Value & Volume) 2019 & 2032
- Table 6: Global APAC Ammunition Industry Revenue Million Forecast, by Price Trend Analysis 2019 & 2032
- Table 7: Global APAC Ammunition Industry Revenue Million Forecast, by Region 2019 & 2032
- Table 8: Global APAC Ammunition Industry Revenue Million Forecast, by Country 2019 & 2032
- Table 9: APAC Ammunition Industry Revenue (Million) Forecast, by Application 2019 & 2032
- Table 10: Global APAC Ammunition Industry Revenue Million Forecast, by Country 2019 & 2032
- Table 11: APAC Ammunition Industry Revenue (Million) Forecast, by Application 2019 & 2032
- Table 12: Global APAC Ammunition Industry Revenue Million Forecast, by Country 2019 & 2032
- Table 13: APAC Ammunition Industry Revenue (Million) Forecast, by Application 2019 & 2032
- Table 14: Global APAC Ammunition Industry Revenue Million Forecast, by Country 2019 & 2032
- Table 15: APAC Ammunition Industry Revenue (Million) Forecast, by Application 2019 & 2032
- Table 16: Global APAC Ammunition Industry Revenue Million Forecast, by Country 2019 & 2032
- Table 17: APAC Ammunition Industry Revenue (Million) Forecast, by Application 2019 & 2032
- Table 18: Global APAC Ammunition Industry Revenue Million Forecast, by Production Analysis 2019 & 2032
- Table 19: Global APAC Ammunition Industry Revenue Million Forecast, by Consumption Analysis 2019 & 2032
- Table 20: Global APAC Ammunition Industry Revenue Million Forecast, by Import Market Analysis (Value & Volume) 2019 & 2032
- Table 21: Global APAC Ammunition Industry Revenue Million Forecast, by Export Market Analysis (Value & Volume) 2019 & 2032
- Table 22: Global APAC Ammunition Industry Revenue Million Forecast, by Price Trend Analysis 2019 & 2032
- Table 23: Global APAC Ammunition Industry Revenue Million Forecast, by Country 2019 & 2032
- Table 24: United States APAC Ammunition Industry Revenue (Million) Forecast, by Application 2019 & 2032
- Table 25: Canada APAC Ammunition Industry Revenue (Million) Forecast, by Application 2019 & 2032
- Table 26: Mexico APAC Ammunition Industry Revenue (Million) Forecast, by Application 2019 & 2032
- Table 27: Global APAC Ammunition Industry Revenue Million Forecast, by Production Analysis 2019 & 2032
- Table 28: Global APAC Ammunition Industry Revenue Million Forecast, by Consumption Analysis 2019 & 2032
- Table 29: Global APAC Ammunition Industry Revenue Million Forecast, by Import Market Analysis (Value & Volume) 2019 & 2032
- Table 30: Global APAC Ammunition Industry Revenue Million Forecast, by Export Market Analysis (Value & Volume) 2019 & 2032
- Table 31: Global APAC Ammunition Industry Revenue Million Forecast, by Price Trend Analysis 2019 & 2032
- Table 32: Global APAC Ammunition Industry Revenue Million Forecast, by Country 2019 & 2032
- Table 33: Brazil APAC Ammunition Industry Revenue (Million) Forecast, by Application 2019 & 2032
- Table 34: Argentina APAC Ammunition Industry Revenue (Million) Forecast, by Application 2019 & 2032
- Table 35: Rest of South America APAC Ammunition Industry Revenue (Million) Forecast, by Application 2019 & 2032
- Table 36: Global APAC Ammunition Industry Revenue Million Forecast, by Production Analysis 2019 & 2032
- Table 37: Global APAC Ammunition Industry Revenue Million Forecast, by Consumption Analysis 2019 & 2032
- Table 38: Global APAC Ammunition Industry Revenue Million Forecast, by Import Market Analysis (Value & Volume) 2019 & 2032
- Table 39: Global APAC Ammunition Industry Revenue Million Forecast, by Export Market Analysis (Value & Volume) 2019 & 2032
- Table 40: Global APAC Ammunition Industry Revenue Million Forecast, by Price Trend Analysis 2019 & 2032
- Table 41: Global APAC Ammunition Industry Revenue Million Forecast, by Country 2019 & 2032
- Table 42: United Kingdom APAC Ammunition Industry Revenue (Million) Forecast, by Application 2019 & 2032
- Table 43: Germany APAC Ammunition Industry Revenue (Million) Forecast, by Application 2019 & 2032
- Table 44: France APAC Ammunition Industry Revenue (Million) Forecast, by Application 2019 & 2032
- Table 45: Italy APAC Ammunition Industry Revenue (Million) Forecast, by Application 2019 & 2032
- Table 46: Spain APAC Ammunition Industry Revenue (Million) Forecast, by Application 2019 & 2032
- Table 47: Russia APAC Ammunition Industry Revenue (Million) Forecast, by Application 2019 & 2032
- Table 48: Benelux APAC Ammunition Industry Revenue (Million) Forecast, by Application 2019 & 2032
- Table 49: Nordics APAC Ammunition Industry Revenue (Million) Forecast, by Application 2019 & 2032
- Table 50: Rest of Europe APAC Ammunition Industry Revenue (Million) Forecast, by Application 2019 & 2032
- Table 51: Global APAC Ammunition Industry Revenue Million Forecast, by Production Analysis 2019 & 2032
- Table 52: Global APAC Ammunition Industry Revenue Million Forecast, by Consumption Analysis 2019 & 2032
- Table 53: Global APAC Ammunition Industry Revenue Million Forecast, by Import Market Analysis (Value & Volume) 2019 & 2032
- Table 54: Global APAC Ammunition Industry Revenue Million Forecast, by Export Market Analysis (Value & Volume) 2019 & 2032
- Table 55: Global APAC Ammunition Industry Revenue Million Forecast, by Price Trend Analysis 2019 & 2032
- Table 56: Global APAC Ammunition Industry Revenue Million Forecast, by Country 2019 & 2032
- Table 57: Turkey APAC Ammunition Industry Revenue (Million) Forecast, by Application 2019 & 2032
- Table 58: Israel APAC Ammunition Industry Revenue (Million) Forecast, by Application 2019 & 2032
- Table 59: GCC APAC Ammunition Industry Revenue (Million) Forecast, by Application 2019 & 2032
- Table 60: North Africa APAC Ammunition Industry Revenue (Million) Forecast, by Application 2019 & 2032
- Table 61: South Africa APAC Ammunition Industry Revenue (Million) Forecast, by Application 2019 & 2032
- Table 62: Rest of Middle East & Africa APAC Ammunition Industry Revenue (Million) Forecast, by Application 2019 & 2032
- Table 63: Global APAC Ammunition Industry Revenue Million Forecast, by Production Analysis 2019 & 2032
- Table 64: Global APAC Ammunition Industry Revenue Million Forecast, by Consumption Analysis 2019 & 2032
- Table 65: Global APAC Ammunition Industry Revenue Million Forecast, by Import Market Analysis (Value & Volume) 2019 & 2032
- Table 66: Global APAC Ammunition Industry Revenue Million Forecast, by Export Market Analysis (Value & Volume) 2019 & 2032
- Table 67: Global APAC Ammunition Industry Revenue Million Forecast, by Price Trend Analysis 2019 & 2032
- Table 68: Global APAC Ammunition Industry Revenue Million Forecast, by Country 2019 & 2032
- Table 69: China APAC Ammunition Industry Revenue (Million) Forecast, by Application 2019 & 2032
- Table 70: India APAC Ammunition Industry Revenue (Million) Forecast, by Application 2019 & 2032
- Table 71: Japan APAC Ammunition Industry Revenue (Million) Forecast, by Application 2019 & 2032
- Table 72: South Korea APAC Ammunition Industry Revenue (Million) Forecast, by Application 2019 & 2032
- Table 73: ASEAN APAC Ammunition Industry Revenue (Million) Forecast, by Application 2019 & 2032
- Table 74: Oceania APAC Ammunition Industry Revenue (Million) Forecast, by Application 2019 & 2032
- Table 75: Rest of Asia Pacific APAC Ammunition Industry Revenue (Million) Forecast, by Application 2019 & 2032
Frequently Asked Questions
1. What is the projected Compound Annual Growth Rate (CAGR) of the APAC Ammunition Industry?
The projected CAGR is approximately 4.83%.
2. Which companies are prominent players in the APAC Ammunition Industry?
Key companies in the market include General Dynamics Corporation, Rheinmetall AG, Remington Arms Company LLC (Vista Outdoor Inc ), CBC Global Ammunition, Yantra India Limite, BAE Systems PLC, Winchester Ammunition (Olin Corporation), Munitions India Limited, Singapore Technologies Engineering Ltd, Poongson Corporation, Hanwha Corporation, KNDS NV.
3. What are the main segments of the APAC Ammunition Industry?
The market segments include Production Analysis, Consumption Analysis, Import Market Analysis (Value & Volume), Export Market Analysis (Value & Volume), Price Trend Analysis.
4. Can you provide details about the market size?
The market size is estimated to be USD 2.57 Million as of 2022.
5. What are some drivers contributing to market growth?
; Increasing Number Of Air Passengers; Use Of Portable Electronic Devices.
6. What are the notable trends driving market growth?
Military Segment is Expected to Dominate the Market During the Forecast Period.
7. Are there any restraints impacting market growth?
; High Cost Of Connectivity Equipments.
8. Can you provide examples of recent developments in the market?
February 2024: China showcased its newly developed ASN-301 loitering munition in Saudi Arabia. Designed to infiltrate adversary airspace, the ASN-301's main function is to loiter until it picks up a radar signal. Upon detection, the ASN-301 targets the signal and precisely strikes. Equipped with a warhead containing 7,000 fragments, the munition is activated by a proximity laser fuse, ensuring a lethal radius of 20 meters.
9. What pricing options are available for accessing the report?
Pricing options include single-user, multi-user, and enterprise licenses priced at USD 4750, USD 4950, and USD 6800 respectively.
10. Is the market size provided in terms of value or volume?
The market size is provided in terms of value, measured in Million.
11. Are there any specific market keywords associated with the report?
Yes, the market keyword associated with the report is "APAC Ammunition Industry," which aids in identifying and referencing the specific market segment covered.
12. How do I determine which pricing option suits my needs best?
The pricing options vary based on user requirements and access needs. Individual users may opt for single-user licenses, while businesses requiring broader access may choose multi-user or enterprise licenses for cost-effective access to the report.
13. Are there any additional resources or data provided in the APAC Ammunition Industry report?
While the report offers comprehensive insights, it's advisable to review the specific contents or supplementary materials provided to ascertain if additional resources or data are available.
14. How can I stay updated on further developments or reports in the APAC Ammunition Industry?
To stay informed about further developments, trends, and reports in the APAC Ammunition Industry, consider subscribing to industry newsletters, following relevant companies and organizations, or regularly checking reputable industry news sources and publications.
Methodology
Step 1 - Identification of Relevant Samples Size from Population Database


Step 2 - Approaches for Defining Global Market Size (Value, Volume* & Price*)

Note*: In applicable scenarios
Step 3 - Data Sources
Primary Research
- Web Analytics
- Survey Reports
- Research Institute
- Latest Research Reports
- Opinion Leaders
Secondary Research
- Annual Reports
- White Paper
- Latest Press Release
- Industry Association
- Paid Database
- Investor Presentations

Step 4 - Data Triangulation
Involves using different sources of information in order to increase the validity of a study
These sources are likely to be stakeholders in a program - participants, other researchers, program staff, other community members, and so on.
Then we put all data in single framework & apply various statistical tools to find out the dynamic on the market.
During the analysis stage, feedback from the stakeholder groups would be compared to determine areas of agreement as well as areas of divergence
