

Key Insights
The Asia-Pacific (APAC) fruit and vegetable ingredients market is experiencing robust growth, driven by increasing health consciousness, rising disposable incomes, and the burgeoning food processing industry within the region. The market's expansion is fueled by strong demand for convenient, healthy food options, particularly in rapidly developing economies like China and India. The preference for natural and minimally processed ingredients is further stimulating growth within the concentrates, pastes, and purees segments, surpassing the growth of other product types. Key application areas like beverages, confectionery, and bakery products are major consumers of these ingredients, contributing significantly to the overall market value. While the precise market size for APAC in 2025 is unavailable, considering the global CAGR of 4.98% and the region's significant growth potential, a conservative estimate places the APAC market size at approximately $15 billion in 2025. This is based on reasonable extrapolation considering the global market size and APAC's significant contribution to the global food processing sector. Furthermore, the proliferation of quick-service restaurants and the increasing adoption of ready-to-eat (RTE) meals are further catalysts driving market expansion.
However, challenges remain. Supply chain disruptions, fluctuating raw material prices, and stringent regulatory compliance requirements pose potential restraints. The market's future growth trajectory hinges on effective supply chain management, technological advancements in processing and preservation techniques, and sustained consumer demand for healthier food choices. Companies operating in this space must strategically leverage these factors and address the constraints to maximize their market share and capitalize on the considerable growth opportunities presented by the APAC region. Increased investment in research and development to produce innovative and sustainable fruit and vegetable ingredients will also be crucial in shaping the future of this dynamic market. The competitive landscape is marked by both multinational corporations and regional players, indicating further opportunities for growth and consolidation in the coming years.
APAC Fruit and Vegetable Ingredients Market: A Comprehensive Report (2019-2033)
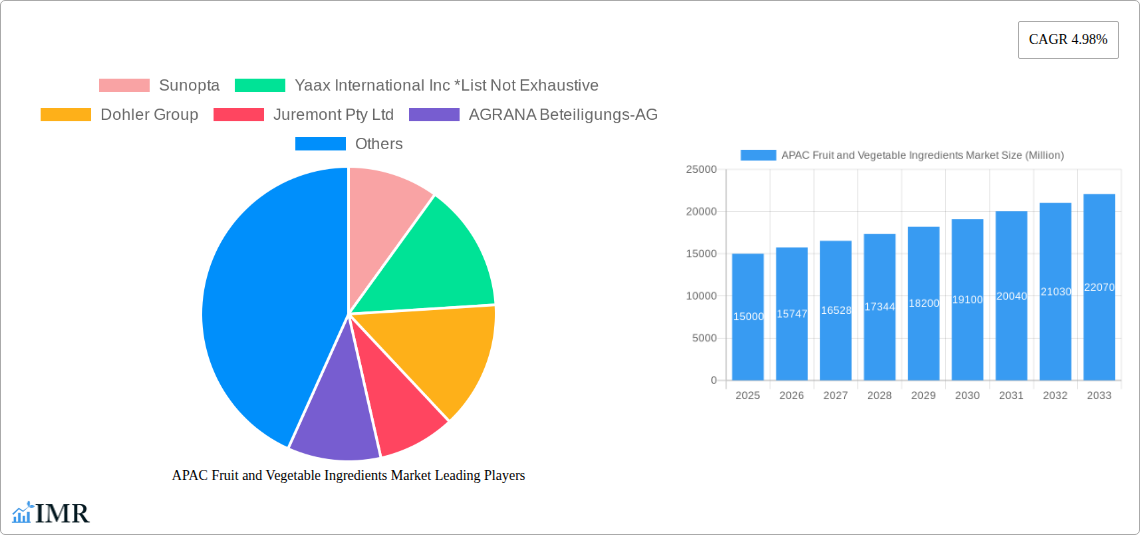
This comprehensive report offers an in-depth analysis of the Asia-Pacific (APAC) fruit and vegetable ingredients market, providing crucial insights for industry professionals, investors, and strategic decision-makers. The study covers the period 2019-2033, with a focus on the base year 2025 and a forecast period of 2025-2033. The market is segmented by ingredient type (fruits, vegetables), product type (concentrates, pastes & purees, pieces & powders, NFC juices), and application (beverages, confectionery, bakery, soups & sauces, dairy, RTE products). Key players include Sunopta, Yaax International Inc, Dohler Group, Juremont Pty Ltd, AGRANA Beteiligungs-AG, Archer Daniels Midland Company, Sensient Technologies Corporation, and Frutarom (Taura Natural Ingredient), among others. The report's estimated market value in 2025 is XX Million.
APAC Fruit and Vegetable Ingredients Market Dynamics & Structure
The APAC fruit and vegetable ingredients market is characterized by a moderately concentrated landscape, with a few major players holding significant market share. Technological innovation, particularly in processing and preservation techniques, is a key driver. Stringent food safety regulations and evolving consumer preferences towards natural and healthier food products significantly influence market dynamics. The market witnesses continuous mergers and acquisitions (M&A) activity, with an estimated xx number of deals in the historical period (2019-2024). Substitute products, such as artificial flavorings and colorings, pose a competitive challenge.
- Market Concentration: The top 5 players hold approximately xx% of the market share in 2025.
- Technological Innovation: Advancements in high-pressure processing (HPP) and freeze-drying are driving product quality and shelf life.
- Regulatory Framework: Stringent food safety standards and labeling regulations are impacting product development and manufacturing processes.
- M&A Activity: Consolidation within the industry is evident, with an average of xx M&A deals annually during 2019-2024.
- Consumer Preferences: Growing demand for natural, organic, and functional ingredients is shaping market trends.
- Innovation Barriers: High R&D costs and stringent regulatory approvals pose challenges to innovation.
APAC Fruit and Vegetable Ingredients Market Growth Trends & Insights
The APAC fruit and vegetable ingredients market is experiencing robust growth, driven by factors such as increasing disposable incomes, changing dietary habits, and the rising popularity of processed foods. The market exhibited a CAGR of xx% during the historical period (2019-2024) and is projected to grow at a CAGR of xx% during the forecast period (2025-2033). The market penetration rate for fruit and vegetable ingredients in key application segments such as beverages and confectionery is steadily increasing. Technological disruptions like automation in processing and supply chain optimization are improving efficiency and reducing costs. Consumer behavior is shifting towards healthier options, with a strong preference for minimally processed, natural ingredients. This is boosting demand for high-quality fruit and vegetable ingredients.
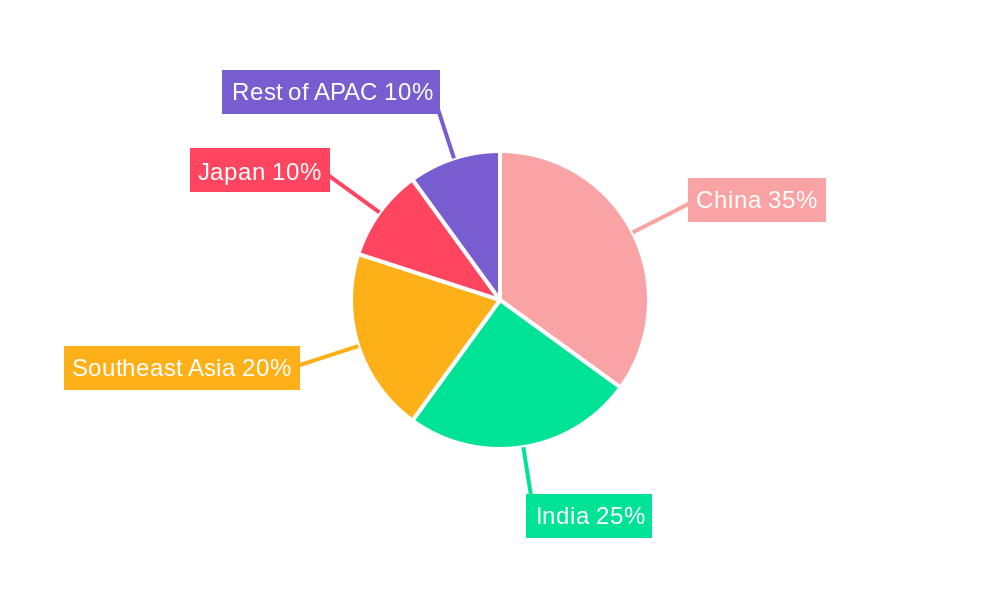
Dominant Regions, Countries, or Segments in APAC Fruit and Vegetable Ingredients Market
China and India are the dominant markets within the APAC region, driven by robust economic growth, large populations, and rising consumer spending. Within the segments, the “Fruits” ingredient type holds the largest market share, followed by “Vegetables.” Among product types, “Concentrates, Pastes and Purees” segment enjoys significant demand due to its versatility and cost-effectiveness. The "Beverages" application segment is the leading end-use industry, followed by “Confectionery Products.”
- Key Drivers in China: Rapid urbanization, increasing disposable incomes, and evolving consumer preferences toward convenient and processed foods are driving market growth.
- Key Drivers in India: Growing middle class, rising health awareness, and increased demand for processed and convenient food items contribute to market expansion.
- Fruits Segment Dominance: High availability, diverse varieties, and versatility in applications contribute to the segment's leadership.
- Beverages Application Dominance: The widespread consumption of beverages across various demographics drives demand for fruit and vegetable-based ingredients.
APAC Fruit and Vegetable Ingredients Market Product Landscape
The APAC fruit and vegetable ingredients market is witnessing significant product innovation, focusing on improved preservation methods, enhanced flavor profiles, and functional benefits. Companies are developing products with extended shelf life, natural colors, and added nutrients to cater to the growing health-conscious consumer base. Technological advancements in extraction, concentration, and drying techniques are leading to higher-quality and more cost-effective products. Unique selling propositions include organic certification, traceability, and sustainable sourcing.
Key Drivers, Barriers & Challenges in APAP Fruit and Vegetable Ingredients Market
Key Drivers: Rising consumer demand for healthy and convenient foods, expanding food processing industry, increasing investments in research and development, and favorable government policies supporting the food processing sector are key drivers.
Key Challenges: Fluctuations in raw material prices, stringent regulatory requirements, and intense competition from both domestic and international players pose significant challenges. Supply chain disruptions and inconsistent raw material quality also impact market growth.
Emerging Opportunities in APAP Fruit and Vegetable Ingredients Market
Untapped markets in Southeast Asia present significant growth opportunities. Increased demand for functional foods and beverages enriched with fruit and vegetable ingredients creates potential. Innovations in ingredient processing and delivery systems, such as microencapsulation and freeze-drying, offer opportunities to enhance product quality and shelf life.
Growth Accelerators in the APAC Fruit and Vegetable Ingredients Market Industry
Technological advancements in processing and preservation are accelerating market growth. Strategic partnerships between ingredient suppliers and food manufacturers are driving innovation and market expansion. Increasing investments in research and development are leading to the development of new and improved products.
Key Players Shaping the APAC Fruit and Vegetable Ingredients Market Market
- Sunopta
- Yaax International Inc
- Dohler Group
- Juremont Pty Ltd
- AGRANA Beteiligungs-AG
- Archer Daniels Midland Company
- Sensient Technologies Corporation
- Frutarom (Taura Natural Ingredient)
Notable Milestones in APAC Fruit and Vegetable Ingredients Market Sector
- 2020-Q3: Launch of a new line of organic fruit purees by [Company Name].
- 2021-Q1: Acquisition of [Company A] by [Company B], consolidating market share.
- 2022-Q4: Introduction of a novel fruit and vegetable powder with enhanced nutritional value by [Company Name]. (Further milestones can be added here)
In-Depth APAC Fruit and Vegetable Ingredients Market Outlook
The APAC fruit and vegetable ingredients market is poised for continued growth, driven by sustained demand for healthy and convenient foods. Strategic investments in research and development, sustainable sourcing, and innovative processing techniques will shape the future of the market. Expanding into untapped markets and leveraging technological advancements will offer significant opportunities for growth and market leadership.
APAC Fruit and Vegetable Ingredients Market Segmentation
-
1. Ingredient Type
- 1.1. Fruits
- 1.2. Vegetables
-
2. Product Type
- 2.1. Concentrates
- 2.2. Pastes and Purees
- 2.3. Pieces and Powders
- 2.4. NFC Juices
-
3. Application
- 3.1. Beverages
- 3.2. Confectionery Products
- 3.3. Bakery Products
- 3.4. Soups and Sauces
- 3.5. Dairy Products
- 3.6. RTE Products
-
4. Geography
- 4.1. China
- 4.2. Japan
- 4.3. India
- 4.4. Australia
- 4.5. Rest of Asia-Pacific
APAC Fruit and Vegetable Ingredients Market Segmentation By Geography
- 1. China
- 2. Japan
- 3. India
- 4. Australia
- 5. Rest of Asia Pacific
APAC Fruit and Vegetable Ingredients Market REPORT HIGHLIGHTS
| Aspects | Details |
|---|---|
| Study Period | 2019-2033 |
| Base Year | 2024 |
| Estimated Year | 2025 |
| Forecast Period | 2025-2033 |
| Historical Period | 2019-2024 |
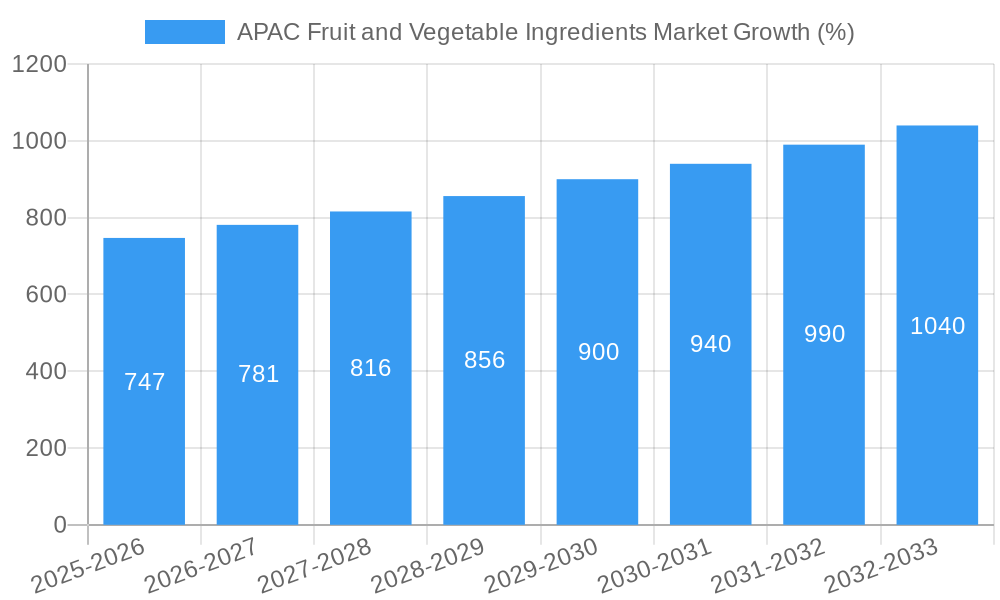
| Growth Rate | CAGR of 4.98% from 2019-2033 |
| Segmentation |
|
Table of Contents
- 1. Introduction
- 1.1. Research Scope
- 1.2. Market Segmentation
- 1.3. Research Methodology
- 1.4. Definitions and Assumptions
- 2. Executive Summary
- 2.1. Introduction
- 3. Market Dynamics
- 3.1. Introduction
- 3.2. Market Drivers
- 3.2.1. Increasing Demand for Protein-Rich Food; Increasing Demand for Plant-Based and Organic Ingredients
- 3.3. Market Restrains
- 3.3.1. Presence of Alternative Proteins
- 3.4. Market Trends
- 3.4.1. Growing Application of Natural Ingredients
- 4. Market Factor Analysis
- 4.1. Porters Five Forces
- 4.2. Supply/Value Chain
- 4.3. PESTEL analysis
- 4.4. Market Entropy
- 4.5. Patent/Trademark Analysis
- 5. Global APAC Fruit and Vegetable Ingredients Market Analysis, Insights and Forecast, 2019-2031
- 5.1. Market Analysis, Insights and Forecast - by Ingredient Type
- 5.1.1. Fruits
- 5.1.2. Vegetables
- 5.2. Market Analysis, Insights and Forecast - by Product Type
- 5.2.1. Concentrates
- 5.2.2. Pastes and Purees
- 5.2.3. Pieces and Powders
- 5.2.4. NFC Juices
- 5.3. Market Analysis, Insights and Forecast - by Application
- 5.3.1. Beverages
- 5.3.2. Confectionery Products
- 5.3.3. Bakery Products
- 5.3.4. Soups and Sauces
- 5.3.5. Dairy Products
- 5.3.6. RTE Products
- 5.4. Market Analysis, Insights and Forecast - by Geography
- 5.4.1. China
- 5.4.2. Japan
- 5.4.3. India
- 5.4.4. Australia
- 5.4.5. Rest of Asia-Pacific
- 5.5. Market Analysis, Insights and Forecast - by Region
- 5.5.1. China
- 5.5.2. Japan
- 5.5.3. India
- 5.5.4. Australia
- 5.5.5. Rest of Asia Pacific
- 5.1. Market Analysis, Insights and Forecast - by Ingredient Type
- 6. China APAC Fruit and Vegetable Ingredients Market Analysis, Insights and Forecast, 2019-2031
- 6.1. Market Analysis, Insights and Forecast - by Ingredient Type
- 6.1.1. Fruits
- 6.1.2. Vegetables
- 6.2. Market Analysis, Insights and Forecast - by Product Type
- 6.2.1. Concentrates
- 6.2.2. Pastes and Purees
- 6.2.3. Pieces and Powders
- 6.2.4. NFC Juices
- 6.3. Market Analysis, Insights and Forecast - by Application
- 6.3.1. Beverages
- 6.3.2. Confectionery Products
- 6.3.3. Bakery Products
- 6.3.4. Soups and Sauces
- 6.3.5. Dairy Products
- 6.3.6. RTE Products
- 6.4. Market Analysis, Insights and Forecast - by Geography
- 6.4.1. China
- 6.4.2. Japan
- 6.4.3. India
- 6.4.4. Australia
- 6.4.5. Rest of Asia-Pacific
- 6.1. Market Analysis, Insights and Forecast - by Ingredient Type
- 7. Japan APAC Fruit and Vegetable Ingredients Market Analysis, Insights and Forecast, 2019-2031
- 7.1. Market Analysis, Insights and Forecast - by Ingredient Type
- 7.1.1. Fruits
- 7.1.2. Vegetables
- 7.2. Market Analysis, Insights and Forecast - by Product Type
- 7.2.1. Concentrates
- 7.2.2. Pastes and Purees
- 7.2.3. Pieces and Powders
- 7.2.4. NFC Juices
- 7.3. Market Analysis, Insights and Forecast - by Application
- 7.3.1. Beverages
- 7.3.2. Confectionery Products
- 7.3.3. Bakery Products
- 7.3.4. Soups and Sauces
- 7.3.5. Dairy Products
- 7.3.6. RTE Products
- 7.4. Market Analysis, Insights and Forecast - by Geography
- 7.4.1. China
- 7.4.2. Japan
- 7.4.3. India
- 7.4.4. Australia
- 7.4.5. Rest of Asia-Pacific
- 7.1. Market Analysis, Insights and Forecast - by Ingredient Type
- 8. India APAC Fruit and Vegetable Ingredients Market Analysis, Insights and Forecast, 2019-2031
- 8.1. Market Analysis, Insights and Forecast - by Ingredient Type
- 8.1.1. Fruits
- 8.1.2. Vegetables
- 8.2. Market Analysis, Insights and Forecast - by Product Type
- 8.2.1. Concentrates
- 8.2.2. Pastes and Purees
- 8.2.3. Pieces and Powders
- 8.2.4. NFC Juices
- 8.3. Market Analysis, Insights and Forecast - by Application
- 8.3.1. Beverages
- 8.3.2. Confectionery Products
- 8.3.3. Bakery Products
- 8.3.4. Soups and Sauces
- 8.3.5. Dairy Products
- 8.3.6. RTE Products
- 8.4. Market Analysis, Insights and Forecast - by Geography
- 8.4.1. China
- 8.4.2. Japan
- 8.4.3. India
- 8.4.4. Australia
- 8.4.5. Rest of Asia-Pacific
- 8.1. Market Analysis, Insights and Forecast - by Ingredient Type
- 9. Australia APAC Fruit and Vegetable Ingredients Market Analysis, Insights and Forecast, 2019-2031
- 9.1. Market Analysis, Insights and Forecast - by Ingredient Type
- 9.1.1. Fruits
- 9.1.2. Vegetables
- 9.2. Market Analysis, Insights and Forecast - by Product Type
- 9.2.1. Concentrates
- 9.2.2. Pastes and Purees
- 9.2.3. Pieces and Powders
- 9.2.4. NFC Juices
- 9.3. Market Analysis, Insights and Forecast - by Application
- 9.3.1. Beverages
- 9.3.2. Confectionery Products
- 9.3.3. Bakery Products
- 9.3.4. Soups and Sauces
- 9.3.5. Dairy Products
- 9.3.6. RTE Products
- 9.4. Market Analysis, Insights and Forecast - by Geography
- 9.4.1. China
- 9.4.2. Japan
- 9.4.3. India
- 9.4.4. Australia
- 9.4.5. Rest of Asia-Pacific
- 9.1. Market Analysis, Insights and Forecast - by Ingredient Type
- 10. Rest of Asia Pacific APAC Fruit and Vegetable Ingredients Market Analysis, Insights and Forecast, 2019-2031
- 10.1. Market Analysis, Insights and Forecast - by Ingredient Type
- 10.1.1. Fruits
- 10.1.2. Vegetables
- 10.2. Market Analysis, Insights and Forecast - by Product Type
- 10.2.1. Concentrates
- 10.2.2. Pastes and Purees
- 10.2.3. Pieces and Powders
- 10.2.4. NFC Juices
- 10.3. Market Analysis, Insights and Forecast - by Application
- 10.3.1. Beverages
- 10.3.2. Confectionery Products
- 10.3.3. Bakery Products
- 10.3.4. Soups and Sauces
- 10.3.5. Dairy Products
- 10.3.6. RTE Products
- 10.4. Market Analysis, Insights and Forecast - by Geography
- 10.4.1. China
- 10.4.2. Japan
- 10.4.3. India
- 10.4.4. Australia
- 10.4.5. Rest of Asia-Pacific
- 10.1. Market Analysis, Insights and Forecast - by Ingredient Type
- 11. North America APAC Fruit and Vegetable Ingredients Market Analysis, Insights and Forecast, 2019-2031
- 11.1. Market Analysis, Insights and Forecast - By Country/Sub-region
- 11.1.1 United States
- 11.1.2 Canada
- 11.1.3 Mexico
- 12. Europe APAC Fruit and Vegetable Ingredients Market Analysis, Insights and Forecast, 2019-2031
- 12.1. Market Analysis, Insights and Forecast - By Country/Sub-region
- 12.1.1 Germany
- 12.1.2 United Kingdom
- 12.1.3 France
- 12.1.4 Spain
- 12.1.5 Italy
- 12.1.6 Spain
- 12.1.7 Belgium
- 12.1.8 Netherland
- 12.1.9 Nordics
- 12.1.10 Rest of Europe
- 13. Asia Pacific APAC Fruit and Vegetable Ingredients Market Analysis, Insights and Forecast, 2019-2031
- 13.1. Market Analysis, Insights and Forecast - By Country/Sub-region
- 13.1.1 China
- 13.1.2 Japan
- 13.1.3 India
- 13.1.4 South Korea
- 13.1.5 Southeast Asia
- 13.1.6 Australia
- 13.1.7 Indonesia
- 13.1.8 Phillipes
- 13.1.9 Singapore
- 13.1.10 Thailandc
- 13.1.11 Rest of Asia Pacific
- 14. South America APAC Fruit and Vegetable Ingredients Market Analysis, Insights and Forecast, 2019-2031
- 14.1. Market Analysis, Insights and Forecast - By Country/Sub-region
- 14.1.1 Brazil
- 14.1.2 Argentina
- 14.1.3 Peru
- 14.1.4 Chile
- 14.1.5 Colombia
- 14.1.6 Ecuador
- 14.1.7 Venezuela
- 14.1.8 Rest of South America
- 15. North America APAC Fruit and Vegetable Ingredients Market Analysis, Insights and Forecast, 2019-2031
- 15.1. Market Analysis, Insights and Forecast - By Country/Sub-region
- 15.1.1 United States
- 15.1.2 Canada
- 15.1.3 Mexico
- 16. MEA APAC Fruit and Vegetable Ingredients Market Analysis, Insights and Forecast, 2019-2031
- 16.1. Market Analysis, Insights and Forecast - By Country/Sub-region
- 16.1.1 United Arab Emirates
- 16.1.2 Saudi Arabia
- 16.1.3 South Africa
- 16.1.4 Rest of Middle East and Africa
- 17. Competitive Analysis
- 17.1. Global Market Share Analysis 2024
- 17.2. Company Profiles
- 17.2.1 Sunopta
- 17.2.1.1. Overview
- 17.2.1.2. Products
- 17.2.1.3. SWOT Analysis
- 17.2.1.4. Recent Developments
- 17.2.1.5. Financials (Based on Availability)
- 17.2.2 Yaax International Inc *List Not Exhaustive
- 17.2.2.1. Overview
- 17.2.2.2. Products
- 17.2.2.3. SWOT Analysis
- 17.2.2.4. Recent Developments
- 17.2.2.5. Financials (Based on Availability)
- 17.2.3 Dohler Group
- 17.2.3.1. Overview
- 17.2.3.2. Products
- 17.2.3.3. SWOT Analysis
- 17.2.3.4. Recent Developments
- 17.2.3.5. Financials (Based on Availability)
- 17.2.4 Juremont Pty Ltd
- 17.2.4.1. Overview
- 17.2.4.2. Products
- 17.2.4.3. SWOT Analysis
- 17.2.4.4. Recent Developments
- 17.2.4.5. Financials (Based on Availability)
- 17.2.5 AGRANA Beteiligungs-AG
- 17.2.5.1. Overview
- 17.2.5.2. Products
- 17.2.5.3. SWOT Analysis
- 17.2.5.4. Recent Developments
- 17.2.5.5. Financials (Based on Availability)
- 17.2.6 Archer Daniels Midland Company
- 17.2.6.1. Overview
- 17.2.6.2. Products
- 17.2.6.3. SWOT Analysis
- 17.2.6.4. Recent Developments
- 17.2.6.5. Financials (Based on Availability)
- 17.2.7 Sensient Technologies Corporation
- 17.2.7.1. Overview
- 17.2.7.2. Products
- 17.2.7.3. SWOT Analysis
- 17.2.7.4. Recent Developments
- 17.2.7.5. Financials (Based on Availability)
- 17.2.8 Frutarom (Taura Natural Ingredient)
- 17.2.8.1. Overview
- 17.2.8.2. Products
- 17.2.8.3. SWOT Analysis
- 17.2.8.4. Recent Developments
- 17.2.8.5. Financials (Based on Availability)
- 17.2.1 Sunopta
List of Figures
- Figure 1: Global APAC Fruit and Vegetable Ingredients Market Revenue Breakdown (Million, %) by Region 2024 & 2032
- Figure 2: Global APAC Fruit and Vegetable Ingredients Market Volume Breakdown (K Tons, %) by Region 2024 & 2032
- Figure 3: North America APAC Fruit and Vegetable Ingredients Market Revenue (Million), by Country 2024 & 2032
- Figure 4: North America APAC Fruit and Vegetable Ingredients Market Volume (K Tons), by Country 2024 & 2032
- Figure 5: North America APAC Fruit and Vegetable Ingredients Market Revenue Share (%), by Country 2024 & 2032
- Figure 6: North America APAC Fruit and Vegetable Ingredients Market Volume Share (%), by Country 2024 & 2032
- Figure 7: Europe APAC Fruit and Vegetable Ingredients Market Revenue (Million), by Country 2024 & 2032
- Figure 8: Europe APAC Fruit and Vegetable Ingredients Market Volume (K Tons), by Country 2024 & 2032
- Figure 9: Europe APAC Fruit and Vegetable Ingredients Market Revenue Share (%), by Country 2024 & 2032
- Figure 10: Europe APAC Fruit and Vegetable Ingredients Market Volume Share (%), by Country 2024 & 2032
- Figure 11: Asia Pacific APAC Fruit and Vegetable Ingredients Market Revenue (Million), by Country 2024 & 2032
- Figure 12: Asia Pacific APAC Fruit and Vegetable Ingredients Market Volume (K Tons), by Country 2024 & 2032
- Figure 13: Asia Pacific APAC Fruit and Vegetable Ingredients Market Revenue Share (%), by Country 2024 & 2032
- Figure 14: Asia Pacific APAC Fruit and Vegetable Ingredients Market Volume Share (%), by Country 2024 & 2032
- Figure 15: South America APAC Fruit and Vegetable Ingredients Market Revenue (Million), by Country 2024 & 2032
- Figure 16: South America APAC Fruit and Vegetable Ingredients Market Volume (K Tons), by Country 2024 & 2032
- Figure 17: South America APAC Fruit and Vegetable Ingredients Market Revenue Share (%), by Country 2024 & 2032
- Figure 18: South America APAC Fruit and Vegetable Ingredients Market Volume Share (%), by Country 2024 & 2032
- Figure 19: North America APAC Fruit and Vegetable Ingredients Market Revenue (Million), by Country 2024 & 2032
- Figure 20: North America APAC Fruit and Vegetable Ingredients Market Volume (K Tons), by Country 2024 & 2032
- Figure 21: North America APAC Fruit and Vegetable Ingredients Market Revenue Share (%), by Country 2024 & 2032
- Figure 22: North America APAC Fruit and Vegetable Ingredients Market Volume Share (%), by Country 2024 & 2032
- Figure 23: MEA APAC Fruit and Vegetable Ingredients Market Revenue (Million), by Country 2024 & 2032
- Figure 24: MEA APAC Fruit and Vegetable Ingredients Market Volume (K Tons), by Country 2024 & 2032
- Figure 25: MEA APAC Fruit and Vegetable Ingredients Market Revenue Share (%), by Country 2024 & 2032
- Figure 26: MEA APAC Fruit and Vegetable Ingredients Market Volume Share (%), by Country 2024 & 2032
- Figure 27: China APAC Fruit and Vegetable Ingredients Market Revenue (Million), by Ingredient Type 2024 & 2032
- Figure 28: China APAC Fruit and Vegetable Ingredients Market Volume (K Tons), by Ingredient Type 2024 & 2032
- Figure 29: China APAC Fruit and Vegetable Ingredients Market Revenue Share (%), by Ingredient Type 2024 & 2032
- Figure 30: China APAC Fruit and Vegetable Ingredients Market Volume Share (%), by Ingredient Type 2024 & 2032
- Figure 31: China APAC Fruit and Vegetable Ingredients Market Revenue (Million), by Product Type 2024 & 2032
- Figure 32: China APAC Fruit and Vegetable Ingredients Market Volume (K Tons), by Product Type 2024 & 2032
- Figure 33: China APAC Fruit and Vegetable Ingredients Market Revenue Share (%), by Product Type 2024 & 2032
- Figure 34: China APAC Fruit and Vegetable Ingredients Market Volume Share (%), by Product Type 2024 & 2032
- Figure 35: China APAC Fruit and Vegetable Ingredients Market Revenue (Million), by Application 2024 & 2032
- Figure 36: China APAC Fruit and Vegetable Ingredients Market Volume (K Tons), by Application 2024 & 2032
- Figure 37: China APAC Fruit and Vegetable Ingredients Market Revenue Share (%), by Application 2024 & 2032
- Figure 38: China APAC Fruit and Vegetable Ingredients Market Volume Share (%), by Application 2024 & 2032
- Figure 39: China APAC Fruit and Vegetable Ingredients Market Revenue (Million), by Geography 2024 & 2032
- Figure 40: China APAC Fruit and Vegetable Ingredients Market Volume (K Tons), by Geography 2024 & 2032
- Figure 41: China APAC Fruit and Vegetable Ingredients Market Revenue Share (%), by Geography 2024 & 2032
- Figure 42: China APAC Fruit and Vegetable Ingredients Market Volume Share (%), by Geography 2024 & 2032
- Figure 43: China APAC Fruit and Vegetable Ingredients Market Revenue (Million), by Country 2024 & 2032
- Figure 44: China APAC Fruit and Vegetable Ingredients Market Volume (K Tons), by Country 2024 & 2032
- Figure 45: China APAC Fruit and Vegetable Ingredients Market Revenue Share (%), by Country 2024 & 2032
- Figure 46: China APAC Fruit and Vegetable Ingredients Market Volume Share (%), by Country 2024 & 2032
- Figure 47: Japan APAC Fruit and Vegetable Ingredients Market Revenue (Million), by Ingredient Type 2024 & 2032
- Figure 48: Japan APAC Fruit and Vegetable Ingredients Market Volume (K Tons), by Ingredient Type 2024 & 2032
- Figure 49: Japan APAC Fruit and Vegetable Ingredients Market Revenue Share (%), by Ingredient Type 2024 & 2032
- Figure 50: Japan APAC Fruit and Vegetable Ingredients Market Volume Share (%), by Ingredient Type 2024 & 2032
- Figure 51: Japan APAC Fruit and Vegetable Ingredients Market Revenue (Million), by Product Type 2024 & 2032
- Figure 52: Japan APAC Fruit and Vegetable Ingredients Market Volume (K Tons), by Product Type 2024 & 2032
- Figure 53: Japan APAC Fruit and Vegetable Ingredients Market Revenue Share (%), by Product Type 2024 & 2032
- Figure 54: Japan APAC Fruit and Vegetable Ingredients Market Volume Share (%), by Product Type 2024 & 2032
- Figure 55: Japan APAC Fruit and Vegetable Ingredients Market Revenue (Million), by Application 2024 & 2032
- Figure 56: Japan APAC Fruit and Vegetable Ingredients Market Volume (K Tons), by Application 2024 & 2032
- Figure 57: Japan APAC Fruit and Vegetable Ingredients Market Revenue Share (%), by Application 2024 & 2032
- Figure 58: Japan APAC Fruit and Vegetable Ingredients Market Volume Share (%), by Application 2024 & 2032
- Figure 59: Japan APAC Fruit and Vegetable Ingredients Market Revenue (Million), by Geography 2024 & 2032
- Figure 60: Japan APAC Fruit and Vegetable Ingredients Market Volume (K Tons), by Geography 2024 & 2032
- Figure 61: Japan APAC Fruit and Vegetable Ingredients Market Revenue Share (%), by Geography 2024 & 2032
- Figure 62: Japan APAC Fruit and Vegetable Ingredients Market Volume Share (%), by Geography 2024 & 2032
- Figure 63: Japan APAC Fruit and Vegetable Ingredients Market Revenue (Million), by Country 2024 & 2032
- Figure 64: Japan APAC Fruit and Vegetable Ingredients Market Volume (K Tons), by Country 2024 & 2032
- Figure 65: Japan APAC Fruit and Vegetable Ingredients Market Revenue Share (%), by Country 2024 & 2032
- Figure 66: Japan APAC Fruit and Vegetable Ingredients Market Volume Share (%), by Country 2024 & 2032
- Figure 67: India APAC Fruit and Vegetable Ingredients Market Revenue (Million), by Ingredient Type 2024 & 2032
- Figure 68: India APAC Fruit and Vegetable Ingredients Market Volume (K Tons), by Ingredient Type 2024 & 2032
- Figure 69: India APAC Fruit and Vegetable Ingredients Market Revenue Share (%), by Ingredient Type 2024 & 2032
- Figure 70: India APAC Fruit and Vegetable Ingredients Market Volume Share (%), by Ingredient Type 2024 & 2032
- Figure 71: India APAC Fruit and Vegetable Ingredients Market Revenue (Million), by Product Type 2024 & 2032
- Figure 72: India APAC Fruit and Vegetable Ingredients Market Volume (K Tons), by Product Type 2024 & 2032
- Figure 73: India APAC Fruit and Vegetable Ingredients Market Revenue Share (%), by Product Type 2024 & 2032
- Figure 74: India APAC Fruit and Vegetable Ingredients Market Volume Share (%), by Product Type 2024 & 2032
- Figure 75: India APAC Fruit and Vegetable Ingredients Market Revenue (Million), by Application 2024 & 2032
- Figure 76: India APAC Fruit and Vegetable Ingredients Market Volume (K Tons), by Application 2024 & 2032
- Figure 77: India APAC Fruit and Vegetable Ingredients Market Revenue Share (%), by Application 2024 & 2032
- Figure 78: India APAC Fruit and Vegetable Ingredients Market Volume Share (%), by Application 2024 & 2032
- Figure 79: India APAC Fruit and Vegetable Ingredients Market Revenue (Million), by Geography 2024 & 2032
- Figure 80: India APAC Fruit and Vegetable Ingredients Market Volume (K Tons), by Geography 2024 & 2032
- Figure 81: India APAC Fruit and Vegetable Ingredients Market Revenue Share (%), by Geography 2024 & 2032
- Figure 82: India APAC Fruit and Vegetable Ingredients Market Volume Share (%), by Geography 2024 & 2032
- Figure 83: India APAC Fruit and Vegetable Ingredients Market Revenue (Million), by Country 2024 & 2032
- Figure 84: India APAC Fruit and Vegetable Ingredients Market Volume (K Tons), by Country 2024 & 2032
- Figure 85: India APAC Fruit and Vegetable Ingredients Market Revenue Share (%), by Country 2024 & 2032
- Figure 86: India APAC Fruit and Vegetable Ingredients Market Volume Share (%), by Country 2024 & 2032
- Figure 87: Australia APAC Fruit and Vegetable Ingredients Market Revenue (Million), by Ingredient Type 2024 & 2032
- Figure 88: Australia APAC Fruit and Vegetable Ingredients Market Volume (K Tons), by Ingredient Type 2024 & 2032
- Figure 89: Australia APAC Fruit and Vegetable Ingredients Market Revenue Share (%), by Ingredient Type 2024 & 2032
- Figure 90: Australia APAC Fruit and Vegetable Ingredients Market Volume Share (%), by Ingredient Type 2024 & 2032
- Figure 91: Australia APAC Fruit and Vegetable Ingredients Market Revenue (Million), by Product Type 2024 & 2032
- Figure 92: Australia APAC Fruit and Vegetable Ingredients Market Volume (K Tons), by Product Type 2024 & 2032
- Figure 93: Australia APAC Fruit and Vegetable Ingredients Market Revenue Share (%), by Product Type 2024 & 2032
- Figure 94: Australia APAC Fruit and Vegetable Ingredients Market Volume Share (%), by Product Type 2024 & 2032
- Figure 95: Australia APAC Fruit and Vegetable Ingredients Market Revenue (Million), by Application 2024 & 2032
- Figure 96: Australia APAC Fruit and Vegetable Ingredients Market Volume (K Tons), by Application 2024 & 2032
- Figure 97: Australia APAC Fruit and Vegetable Ingredients Market Revenue Share (%), by Application 2024 & 2032
- Figure 98: Australia APAC Fruit and Vegetable Ingredients Market Volume Share (%), by Application 2024 & 2032
- Figure 99: Australia APAC Fruit and Vegetable Ingredients Market Revenue (Million), by Geography 2024 & 2032
- Figure 100: Australia APAC Fruit and Vegetable Ingredients Market Volume (K Tons), by Geography 2024 & 2032
- Figure 101: Australia APAC Fruit and Vegetable Ingredients Market Revenue Share (%), by Geography 2024 & 2032
- Figure 102: Australia APAC Fruit and Vegetable Ingredients Market Volume Share (%), by Geography 2024 & 2032
- Figure 103: Australia APAC Fruit and Vegetable Ingredients Market Revenue (Million), by Country 2024 & 2032
- Figure 104: Australia APAC Fruit and Vegetable Ingredients Market Volume (K Tons), by Country 2024 & 2032
- Figure 105: Australia APAC Fruit and Vegetable Ingredients Market Revenue Share (%), by Country 2024 & 2032
- Figure 106: Australia APAC Fruit and Vegetable Ingredients Market Volume Share (%), by Country 2024 & 2032
- Figure 107: Rest of Asia Pacific APAC Fruit and Vegetable Ingredients Market Revenue (Million), by Ingredient Type 2024 & 2032
- Figure 108: Rest of Asia Pacific APAC Fruit and Vegetable Ingredients Market Volume (K Tons), by Ingredient Type 2024 & 2032
- Figure 109: Rest of Asia Pacific APAC Fruit and Vegetable Ingredients Market Revenue Share (%), by Ingredient Type 2024 & 2032
- Figure 110: Rest of Asia Pacific APAC Fruit and Vegetable Ingredients Market Volume Share (%), by Ingredient Type 2024 & 2032
- Figure 111: Rest of Asia Pacific APAC Fruit and Vegetable Ingredients Market Revenue (Million), by Product Type 2024 & 2032
- Figure 112: Rest of Asia Pacific APAC Fruit and Vegetable Ingredients Market Volume (K Tons), by Product Type 2024 & 2032
- Figure 113: Rest of Asia Pacific APAC Fruit and Vegetable Ingredients Market Revenue Share (%), by Product Type 2024 & 2032
- Figure 114: Rest of Asia Pacific APAC Fruit and Vegetable Ingredients Market Volume Share (%), by Product Type 2024 & 2032
- Figure 115: Rest of Asia Pacific APAC Fruit and Vegetable Ingredients Market Revenue (Million), by Application 2024 & 2032
- Figure 116: Rest of Asia Pacific APAC Fruit and Vegetable Ingredients Market Volume (K Tons), by Application 2024 & 2032
- Figure 117: Rest of Asia Pacific APAC Fruit and Vegetable Ingredients Market Revenue Share (%), by Application 2024 & 2032
- Figure 118: Rest of Asia Pacific APAC Fruit and Vegetable Ingredients Market Volume Share (%), by Application 2024 & 2032
- Figure 119: Rest of Asia Pacific APAC Fruit and Vegetable Ingredients Market Revenue (Million), by Geography 2024 & 2032
- Figure 120: Rest of Asia Pacific APAC Fruit and Vegetable Ingredients Market Volume (K Tons), by Geography 2024 & 2032
- Figure 121: Rest of Asia Pacific APAC Fruit and Vegetable Ingredients Market Revenue Share (%), by Geography 2024 & 2032
- Figure 122: Rest of Asia Pacific APAC Fruit and Vegetable Ingredients Market Volume Share (%), by Geography 2024 & 2032
- Figure 123: Rest of Asia Pacific APAC Fruit and Vegetable Ingredients Market Revenue (Million), by Country 2024 & 2032
- Figure 124: Rest of Asia Pacific APAC Fruit and Vegetable Ingredients Market Volume (K Tons), by Country 2024 & 2032
- Figure 125: Rest of Asia Pacific APAC Fruit and Vegetable Ingredients Market Revenue Share (%), by Country 2024 & 2032
- Figure 126: Rest of Asia Pacific APAC Fruit and Vegetable Ingredients Market Volume Share (%), by Country 2024 & 2032
List of Tables
- Table 1: Global APAC Fruit and Vegetable Ingredients Market Revenue Million Forecast, by Region 2019 & 2032
- Table 2: Global APAC Fruit and Vegetable Ingredients Market Volume K Tons Forecast, by Region 2019 & 2032
- Table 3: Global APAC Fruit and Vegetable Ingredients Market Revenue Million Forecast, by Ingredient Type 2019 & 2032
- Table 4: Global APAC Fruit and Vegetable Ingredients Market Volume K Tons Forecast, by Ingredient Type 2019 & 2032
- Table 5: Global APAC Fruit and Vegetable Ingredients Market Revenue Million Forecast, by Product Type 2019 & 2032
- Table 6: Global APAC Fruit and Vegetable Ingredients Market Volume K Tons Forecast, by Product Type 2019 & 2032
- Table 7: Global APAC Fruit and Vegetable Ingredients Market Revenue Million Forecast, by Application 2019 & 2032
- Table 8: Global APAC Fruit and Vegetable Ingredients Market Volume K Tons Forecast, by Application 2019 & 2032
- Table 9: Global APAC Fruit and Vegetable Ingredients Market Revenue Million Forecast, by Geography 2019 & 2032
- Table 10: Global APAC Fruit and Vegetable Ingredients Market Volume K Tons Forecast, by Geography 2019 & 2032
- Table 11: Global APAC Fruit and Vegetable Ingredients Market Revenue Million Forecast, by Region 2019 & 2032
- Table 12: Global APAC Fruit and Vegetable Ingredients Market Volume K Tons Forecast, by Region 2019 & 2032
- Table 13: Global APAC Fruit and Vegetable Ingredients Market Revenue Million Forecast, by Country 2019 & 2032
- Table 14: Global APAC Fruit and Vegetable Ingredients Market Volume K Tons Forecast, by Country 2019 & 2032
- Table 15: United States APAC Fruit and Vegetable Ingredients Market Revenue (Million) Forecast, by Application 2019 & 2032
- Table 16: United States APAC Fruit and Vegetable Ingredients Market Volume (K Tons) Forecast, by Application 2019 & 2032
- Table 17: Canada APAC Fruit and Vegetable Ingredients Market Revenue (Million) Forecast, by Application 2019 & 2032
- Table 18: Canada APAC Fruit and Vegetable Ingredients Market Volume (K Tons) Forecast, by Application 2019 & 2032
- Table 19: Mexico APAC Fruit and Vegetable Ingredients Market Revenue (Million) Forecast, by Application 2019 & 2032
- Table 20: Mexico APAC Fruit and Vegetable Ingredients Market Volume (K Tons) Forecast, by Application 2019 & 2032
- Table 21: Global APAC Fruit and Vegetable Ingredients Market Revenue Million Forecast, by Country 2019 & 2032
- Table 22: Global APAC Fruit and Vegetable Ingredients Market Volume K Tons Forecast, by Country 2019 & 2032
- Table 23: Germany APAC Fruit and Vegetable Ingredients Market Revenue (Million) Forecast, by Application 2019 & 2032
- Table 24: Germany APAC Fruit and Vegetable Ingredients Market Volume (K Tons) Forecast, by Application 2019 & 2032
- Table 25: United Kingdom APAC Fruit and Vegetable Ingredients Market Revenue (Million) Forecast, by Application 2019 & 2032
- Table 26: United Kingdom APAC Fruit and Vegetable Ingredients Market Volume (K Tons) Forecast, by Application 2019 & 2032
- Table 27: France APAC Fruit and Vegetable Ingredients Market Revenue (Million) Forecast, by Application 2019 & 2032
- Table 28: France APAC Fruit and Vegetable Ingredients Market Volume (K Tons) Forecast, by Application 2019 & 2032
- Table 29: Spain APAC Fruit and Vegetable Ingredients Market Revenue (Million) Forecast, by Application 2019 & 2032
- Table 30: Spain APAC Fruit and Vegetable Ingredients Market Volume (K Tons) Forecast, by Application 2019 & 2032
- Table 31: Italy APAC Fruit and Vegetable Ingredients Market Revenue (Million) Forecast, by Application 2019 & 2032
- Table 32: Italy APAC Fruit and Vegetable Ingredients Market Volume (K Tons) Forecast, by Application 2019 & 2032
- Table 33: Spain APAC Fruit and Vegetable Ingredients Market Revenue (Million) Forecast, by Application 2019 & 2032
- Table 34: Spain APAC Fruit and Vegetable Ingredients Market Volume (K Tons) Forecast, by Application 2019 & 2032
- Table 35: Belgium APAC Fruit and Vegetable Ingredients Market Revenue (Million) Forecast, by Application 2019 & 2032
- Table 36: Belgium APAC Fruit and Vegetable Ingredients Market Volume (K Tons) Forecast, by Application 2019 & 2032
- Table 37: Netherland APAC Fruit and Vegetable Ingredients Market Revenue (Million) Forecast, by Application 2019 & 2032
- Table 38: Netherland APAC Fruit and Vegetable Ingredients Market Volume (K Tons) Forecast, by Application 2019 & 2032
- Table 39: Nordics APAC Fruit and Vegetable Ingredients Market Revenue (Million) Forecast, by Application 2019 & 2032
- Table 40: Nordics APAC Fruit and Vegetable Ingredients Market Volume (K Tons) Forecast, by Application 2019 & 2032
- Table 41: Rest of Europe APAC Fruit and Vegetable Ingredients Market Revenue (Million) Forecast, by Application 2019 & 2032
- Table 42: Rest of Europe APAC Fruit and Vegetable Ingredients Market Volume (K Tons) Forecast, by Application 2019 & 2032
- Table 43: Global APAC Fruit and Vegetable Ingredients Market Revenue Million Forecast, by Country 2019 & 2032
- Table 44: Global APAC Fruit and Vegetable Ingredients Market Volume K Tons Forecast, by Country 2019 & 2032
- Table 45: China APAC Fruit and Vegetable Ingredients Market Revenue (Million) Forecast, by Application 2019 & 2032
- Table 46: China APAC Fruit and Vegetable Ingredients Market Volume (K Tons) Forecast, by Application 2019 & 2032
- Table 47: Japan APAC Fruit and Vegetable Ingredients Market Revenue (Million) Forecast, by Application 2019 & 2032
- Table 48: Japan APAC Fruit and Vegetable Ingredients Market Volume (K Tons) Forecast, by Application 2019 & 2032
- Table 49: India APAC Fruit and Vegetable Ingredients Market Revenue (Million) Forecast, by Application 2019 & 2032
- Table 50: India APAC Fruit and Vegetable Ingredients Market Volume (K Tons) Forecast, by Application 2019 & 2032
- Table 51: South Korea APAC Fruit and Vegetable Ingredients Market Revenue (Million) Forecast, by Application 2019 & 2032
- Table 52: South Korea APAC Fruit and Vegetable Ingredients Market Volume (K Tons) Forecast, by Application 2019 & 2032
- Table 53: Southeast Asia APAC Fruit and Vegetable Ingredients Market Revenue (Million) Forecast, by Application 2019 & 2032
- Table 54: Southeast Asia APAC Fruit and Vegetable Ingredients Market Volume (K Tons) Forecast, by Application 2019 & 2032
- Table 55: Australia APAC Fruit and Vegetable Ingredients Market Revenue (Million) Forecast, by Application 2019 & 2032
- Table 56: Australia APAC Fruit and Vegetable Ingredients Market Volume (K Tons) Forecast, by Application 2019 & 2032
- Table 57: Indonesia APAC Fruit and Vegetable Ingredients Market Revenue (Million) Forecast, by Application 2019 & 2032
- Table 58: Indonesia APAC Fruit and Vegetable Ingredients Market Volume (K Tons) Forecast, by Application 2019 & 2032
- Table 59: Phillipes APAC Fruit and Vegetable Ingredients Market Revenue (Million) Forecast, by Application 2019 & 2032
- Table 60: Phillipes APAC Fruit and Vegetable Ingredients Market Volume (K Tons) Forecast, by Application 2019 & 2032
- Table 61: Singapore APAC Fruit and Vegetable Ingredients Market Revenue (Million) Forecast, by Application 2019 & 2032
- Table 62: Singapore APAC Fruit and Vegetable Ingredients Market Volume (K Tons) Forecast, by Application 2019 & 2032
- Table 63: Thailandc APAC Fruit and Vegetable Ingredients Market Revenue (Million) Forecast, by Application 2019 & 2032
- Table 64: Thailandc APAC Fruit and Vegetable Ingredients Market Volume (K Tons) Forecast, by Application 2019 & 2032
- Table 65: Rest of Asia Pacific APAC Fruit and Vegetable Ingredients Market Revenue (Million) Forecast, by Application 2019 & 2032
- Table 66: Rest of Asia Pacific APAC Fruit and Vegetable Ingredients Market Volume (K Tons) Forecast, by Application 2019 & 2032
- Table 67: Global APAC Fruit and Vegetable Ingredients Market Revenue Million Forecast, by Country 2019 & 2032
- Table 68: Global APAC Fruit and Vegetable Ingredients Market Volume K Tons Forecast, by Country 2019 & 2032
- Table 69: Brazil APAC Fruit and Vegetable Ingredients Market Revenue (Million) Forecast, by Application 2019 & 2032
- Table 70: Brazil APAC Fruit and Vegetable Ingredients Market Volume (K Tons) Forecast, by Application 2019 & 2032
- Table 71: Argentina APAC Fruit and Vegetable Ingredients Market Revenue (Million) Forecast, by Application 2019 & 2032
- Table 72: Argentina APAC Fruit and Vegetable Ingredients Market Volume (K Tons) Forecast, by Application 2019 & 2032
- Table 73: Peru APAC Fruit and Vegetable Ingredients Market Revenue (Million) Forecast, by Application 2019 & 2032
- Table 74: Peru APAC Fruit and Vegetable Ingredients Market Volume (K Tons) Forecast, by Application 2019 & 2032
- Table 75: Chile APAC Fruit and Vegetable Ingredients Market Revenue (Million) Forecast, by Application 2019 & 2032
- Table 76: Chile APAC Fruit and Vegetable Ingredients Market Volume (K Tons) Forecast, by Application 2019 & 2032
- Table 77: Colombia APAC Fruit and Vegetable Ingredients Market Revenue (Million) Forecast, by Application 2019 & 2032
- Table 78: Colombia APAC Fruit and Vegetable Ingredients Market Volume (K Tons) Forecast, by Application 2019 & 2032
- Table 79: Ecuador APAC Fruit and Vegetable Ingredients Market Revenue (Million) Forecast, by Application 2019 & 2032
- Table 80: Ecuador APAC Fruit and Vegetable Ingredients Market Volume (K Tons) Forecast, by Application 2019 & 2032
- Table 81: Venezuela APAC Fruit and Vegetable Ingredients Market Revenue (Million) Forecast, by Application 2019 & 2032
- Table 82: Venezuela APAC Fruit and Vegetable Ingredients Market Volume (K Tons) Forecast, by Application 2019 & 2032
- Table 83: Rest of South America APAC Fruit and Vegetable Ingredients Market Revenue (Million) Forecast, by Application 2019 & 2032
- Table 84: Rest of South America APAC Fruit and Vegetable Ingredients Market Volume (K Tons) Forecast, by Application 2019 & 2032
- Table 85: Global APAC Fruit and Vegetable Ingredients Market Revenue Million Forecast, by Country 2019 & 2032
- Table 86: Global APAC Fruit and Vegetable Ingredients Market Volume K Tons Forecast, by Country 2019 & 2032
- Table 87: United States APAC Fruit and Vegetable Ingredients Market Revenue (Million) Forecast, by Application 2019 & 2032
- Table 88: United States APAC Fruit and Vegetable Ingredients Market Volume (K Tons) Forecast, by Application 2019 & 2032
- Table 89: Canada APAC Fruit and Vegetable Ingredients Market Revenue (Million) Forecast, by Application 2019 & 2032
- Table 90: Canada APAC Fruit and Vegetable Ingredients Market Volume (K Tons) Forecast, by Application 2019 & 2032
- Table 91: Mexico APAC Fruit and Vegetable Ingredients Market Revenue (Million) Forecast, by Application 2019 & 2032
- Table 92: Mexico APAC Fruit and Vegetable Ingredients Market Volume (K Tons) Forecast, by Application 2019 & 2032
- Table 93: Global APAC Fruit and Vegetable Ingredients Market Revenue Million Forecast, by Country 2019 & 2032
- Table 94: Global APAC Fruit and Vegetable Ingredients Market Volume K Tons Forecast, by Country 2019 & 2032
- Table 95: United Arab Emirates APAC Fruit and Vegetable Ingredients Market Revenue (Million) Forecast, by Application 2019 & 2032
- Table 96: United Arab Emirates APAC Fruit and Vegetable Ingredients Market Volume (K Tons) Forecast, by Application 2019 & 2032
- Table 97: Saudi Arabia APAC Fruit and Vegetable Ingredients Market Revenue (Million) Forecast, by Application 2019 & 2032
- Table 98: Saudi Arabia APAC Fruit and Vegetable Ingredients Market Volume (K Tons) Forecast, by Application 2019 & 2032
- Table 99: South Africa APAC Fruit and Vegetable Ingredients Market Revenue (Million) Forecast, by Application 2019 & 2032
- Table 100: South Africa APAC Fruit and Vegetable Ingredients Market Volume (K Tons) Forecast, by Application 2019 & 2032
- Table 101: Rest of Middle East and Africa APAC Fruit and Vegetable Ingredients Market Revenue (Million) Forecast, by Application 2019 & 2032
- Table 102: Rest of Middle East and Africa APAC Fruit and Vegetable Ingredients Market Volume (K Tons) Forecast, by Application 2019 & 2032
- Table 103: Global APAC Fruit and Vegetable Ingredients Market Revenue Million Forecast, by Ingredient Type 2019 & 2032
- Table 104: Global APAC Fruit and Vegetable Ingredients Market Volume K Tons Forecast, by Ingredient Type 2019 & 2032
- Table 105: Global APAC Fruit and Vegetable Ingredients Market Revenue Million Forecast, by Product Type 2019 & 2032
- Table 106: Global APAC Fruit and Vegetable Ingredients Market Volume K Tons Forecast, by Product Type 2019 & 2032
- Table 107: Global APAC Fruit and Vegetable Ingredients Market Revenue Million Forecast, by Application 2019 & 2032
- Table 108: Global APAC Fruit and Vegetable Ingredients Market Volume K Tons Forecast, by Application 2019 & 2032
- Table 109: Global APAC Fruit and Vegetable Ingredients Market Revenue Million Forecast, by Geography 2019 & 2032
- Table 110: Global APAC Fruit and Vegetable Ingredients Market Volume K Tons Forecast, by Geography 2019 & 2032
- Table 111: Global APAC Fruit and Vegetable Ingredients Market Revenue Million Forecast, by Country 2019 & 2032
- Table 112: Global APAC Fruit and Vegetable Ingredients Market Volume K Tons Forecast, by Country 2019 & 2032
- Table 113: Global APAC Fruit and Vegetable Ingredients Market Revenue Million Forecast, by Ingredient Type 2019 & 2032
- Table 114: Global APAC Fruit and Vegetable Ingredients Market Volume K Tons Forecast, by Ingredient Type 2019 & 2032
- Table 115: Global APAC Fruit and Vegetable Ingredients Market Revenue Million Forecast, by Product Type 2019 & 2032
- Table 116: Global APAC Fruit and Vegetable Ingredients Market Volume K Tons Forecast, by Product Type 2019 & 2032
- Table 117: Global APAC Fruit and Vegetable Ingredients Market Revenue Million Forecast, by Application 2019 & 2032
- Table 118: Global APAC Fruit and Vegetable Ingredients Market Volume K Tons Forecast, by Application 2019 & 2032
- Table 119: Global APAC Fruit and Vegetable Ingredients Market Revenue Million Forecast, by Geography 2019 & 2032
- Table 120: Global APAC Fruit and Vegetable Ingredients Market Volume K Tons Forecast, by Geography 2019 & 2032
- Table 121: Global APAC Fruit and Vegetable Ingredients Market Revenue Million Forecast, by Country 2019 & 2032
- Table 122: Global APAC Fruit and Vegetable Ingredients Market Volume K Tons Forecast, by Country 2019 & 2032
- Table 123: Global APAC Fruit and Vegetable Ingredients Market Revenue Million Forecast, by Ingredient Type 2019 & 2032
- Table 124: Global APAC Fruit and Vegetable Ingredients Market Volume K Tons Forecast, by Ingredient Type 2019 & 2032
- Table 125: Global APAC Fruit and Vegetable Ingredients Market Revenue Million Forecast, by Product Type 2019 & 2032
- Table 126: Global APAC Fruit and Vegetable Ingredients Market Volume K Tons Forecast, by Product Type 2019 & 2032
- Table 127: Global APAC Fruit and Vegetable Ingredients Market Revenue Million Forecast, by Application 2019 & 2032
- Table 128: Global APAC Fruit and Vegetable Ingredients Market Volume K Tons Forecast, by Application 2019 & 2032
- Table 129: Global APAC Fruit and Vegetable Ingredients Market Revenue Million Forecast, by Geography 2019 & 2032
- Table 130: Global APAC Fruit and Vegetable Ingredients Market Volume K Tons Forecast, by Geography 2019 & 2032
- Table 131: Global APAC Fruit and Vegetable Ingredients Market Revenue Million Forecast, by Country 2019 & 2032
- Table 132: Global APAC Fruit and Vegetable Ingredients Market Volume K Tons Forecast, by Country 2019 & 2032
- Table 133: Global APAC Fruit and Vegetable Ingredients Market Revenue Million Forecast, by Ingredient Type 2019 & 2032
- Table 134: Global APAC Fruit and Vegetable Ingredients Market Volume K Tons Forecast, by Ingredient Type 2019 & 2032
- Table 135: Global APAC Fruit and Vegetable Ingredients Market Revenue Million Forecast, by Product Type 2019 & 2032
- Table 136: Global APAC Fruit and Vegetable Ingredients Market Volume K Tons Forecast, by Product Type 2019 & 2032
- Table 137: Global APAC Fruit and Vegetable Ingredients Market Revenue Million Forecast, by Application 2019 & 2032
- Table 138: Global APAC Fruit and Vegetable Ingredients Market Volume K Tons Forecast, by Application 2019 & 2032
- Table 139: Global APAC Fruit and Vegetable Ingredients Market Revenue Million Forecast, by Geography 2019 & 2032
- Table 140: Global APAC Fruit and Vegetable Ingredients Market Volume K Tons Forecast, by Geography 2019 & 2032
- Table 141: Global APAC Fruit and Vegetable Ingredients Market Revenue Million Forecast, by Country 2019 & 2032
- Table 142: Global APAC Fruit and Vegetable Ingredients Market Volume K Tons Forecast, by Country 2019 & 2032
- Table 143: Global APAC Fruit and Vegetable Ingredients Market Revenue Million Forecast, by Ingredient Type 2019 & 2032
- Table 144: Global APAC Fruit and Vegetable Ingredients Market Volume K Tons Forecast, by Ingredient Type 2019 & 2032
- Table 145: Global APAC Fruit and Vegetable Ingredients Market Revenue Million Forecast, by Product Type 2019 & 2032
- Table 146: Global APAC Fruit and Vegetable Ingredients Market Volume K Tons Forecast, by Product Type 2019 & 2032
- Table 147: Global APAC Fruit and Vegetable Ingredients Market Revenue Million Forecast, by Application 2019 & 2032
- Table 148: Global APAC Fruit and Vegetable Ingredients Market Volume K Tons Forecast, by Application 2019 & 2032
- Table 149: Global APAC Fruit and Vegetable Ingredients Market Revenue Million Forecast, by Geography 2019 & 2032
- Table 150: Global APAC Fruit and Vegetable Ingredients Market Volume K Tons Forecast, by Geography 2019 & 2032
- Table 151: Global APAC Fruit and Vegetable Ingredients Market Revenue Million Forecast, by Country 2019 & 2032
- Table 152: Global APAC Fruit and Vegetable Ingredients Market Volume K Tons Forecast, by Country 2019 & 2032
Frequently Asked Questions
1. What is the projected Compound Annual Growth Rate (CAGR) of the APAC Fruit and Vegetable Ingredients Market?
The projected CAGR is approximately 4.98%.
2. Which companies are prominent players in the APAC Fruit and Vegetable Ingredients Market?
Key companies in the market include Sunopta, Yaax International Inc *List Not Exhaustive, Dohler Group, Juremont Pty Ltd, AGRANA Beteiligungs-AG, Archer Daniels Midland Company, Sensient Technologies Corporation, Frutarom (Taura Natural Ingredient).
3. What are the main segments of the APAC Fruit and Vegetable Ingredients Market?
The market segments include Ingredient Type, Product Type, Application, Geography.
4. Can you provide details about the market size?
The market size is estimated to be USD XX Million as of 2022.
5. What are some drivers contributing to market growth?
Increasing Demand for Protein-Rich Food; Increasing Demand for Plant-Based and Organic Ingredients.
6. What are the notable trends driving market growth?
Growing Application of Natural Ingredients.
7. Are there any restraints impacting market growth?
Presence of Alternative Proteins.
8. Can you provide examples of recent developments in the market?
N/A
9. What pricing options are available for accessing the report?
Pricing options include single-user, multi-user, and enterprise licenses priced at USD 4750, USD 5250, and USD 8750 respectively.
10. Is the market size provided in terms of value or volume?
The market size is provided in terms of value, measured in Million and volume, measured in K Tons.
11. Are there any specific market keywords associated with the report?
Yes, the market keyword associated with the report is "APAC Fruit and Vegetable Ingredients Market," which aids in identifying and referencing the specific market segment covered.
12. How do I determine which pricing option suits my needs best?
The pricing options vary based on user requirements and access needs. Individual users may opt for single-user licenses, while businesses requiring broader access may choose multi-user or enterprise licenses for cost-effective access to the report.
13. Are there any additional resources or data provided in the APAC Fruit and Vegetable Ingredients Market report?
While the report offers comprehensive insights, it's advisable to review the specific contents or supplementary materials provided to ascertain if additional resources or data are available.
14. How can I stay updated on further developments or reports in the APAC Fruit and Vegetable Ingredients Market?
To stay informed about further developments, trends, and reports in the APAC Fruit and Vegetable Ingredients Market, consider subscribing to industry newsletters, following relevant companies and organizations, or regularly checking reputable industry news sources and publications.
Methodology
Step 1 - Identification of Relevant Samples Size from Population Database


Step 2 - Approaches for Defining Global Market Size (Value, Volume* & Price*)

Note*: In applicable scenarios
Step 3 - Data Sources
Primary Research
- Web Analytics
- Survey Reports
- Research Institute
- Latest Research Reports
- Opinion Leaders
Secondary Research
- Annual Reports
- White Paper
- Latest Press Release
- Industry Association
- Paid Database
- Investor Presentations

Step 4 - Data Triangulation
Involves using different sources of information in order to increase the validity of a study
These sources are likely to be stakeholders in a program - participants, other researchers, program staff, other community members, and so on.
Then we put all data in single framework & apply various statistical tools to find out the dynamic on the market.
During the analysis stage, feedback from the stakeholder groups would be compared to determine areas of agreement as well as areas of divergence
