

Key Insights
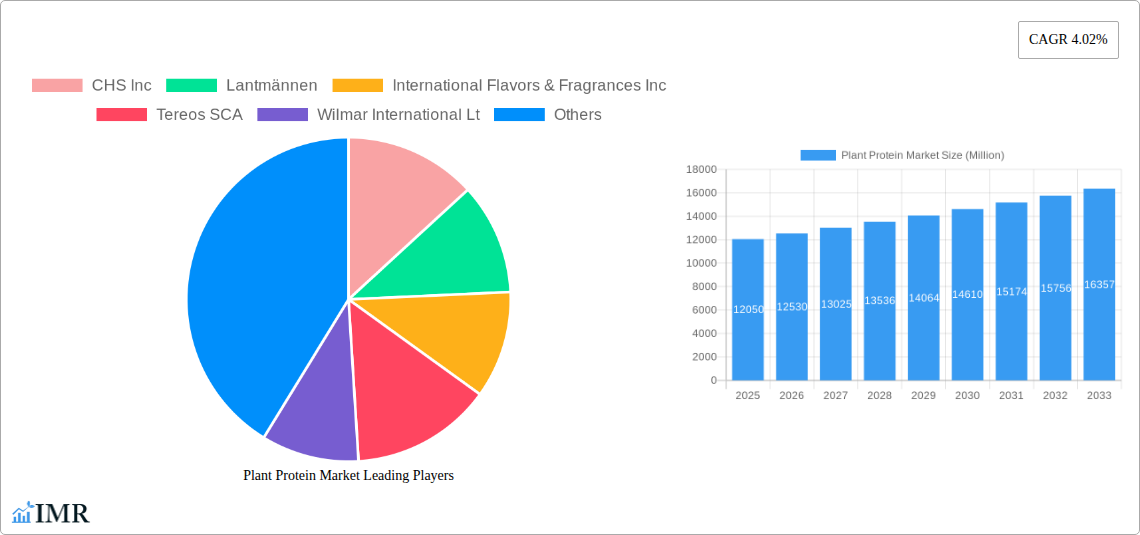
The global plant protein market, valued at $12,050 million in 2025, is projected to experience robust growth, driven by increasing consumer demand for plant-based diets and the rising popularity of vegan and vegetarian lifestyles. This shift in consumer preferences is fueled by growing awareness of the health benefits associated with plant-based proteins, including reduced risk of heart disease, improved gut health, and better weight management. Furthermore, the market is propelled by the expanding food and beverage industry, incorporating plant proteins into a wider variety of products, from meat alternatives to protein bars and beverages. The growing sports nutrition sector also significantly contributes to market expansion, with plant-based protein powders and supplements gaining traction among athletes and fitness enthusiasts seeking clean and sustainable protein sources. Key segments within the market include soy protein, pea protein, and hemp protein, each exhibiting unique growth trajectories based on factors such as production costs, nutritional profiles, and consumer perceptions. Geographical growth is expected to be diverse, with North America and Europe maintaining strong positions due to established markets and high consumer awareness, while the Asia-Pacific region is projected to demonstrate significant growth potential owing to rapid economic development and rising disposable incomes.
The competitive landscape is characterized by both established agricultural giants and specialized ingredient suppliers. Companies like Archer Daniels Midland, Bunge Limited, and Roquette Frère are leveraging their existing infrastructure and expertise to expand their plant protein portfolios. Smaller, more agile companies are focusing on innovation and niche markets, offering unique protein sources and value-added products. Challenges to market growth include the relatively higher cost of plant proteins compared to animal proteins in some regions, fluctuations in raw material prices, and concerns regarding the nutritional completeness of certain plant protein sources. However, ongoing research and development efforts are focused on improving the bioavailability and functionality of plant proteins, addressing these concerns and further stimulating market expansion. The forecast period (2025-2033) anticipates a continued upward trend, driven by ongoing innovation, evolving consumer preferences, and the expanding applications of plant proteins across diverse sectors.
Plant Protein Market Report: 2019-2033
This comprehensive report provides a detailed analysis of the Plant Protein Market, encompassing historical data (2019-2024), current estimations (2025), and future projections (2025-2033). It delves into market dynamics, growth trends, regional dominance, product innovation, key players, and emerging opportunities across various segments, including protein types (hemp, pea, potato, rice, soy, wheat, and others) and end-users (animal feed, food & beverages, and sports/performance nutrition). The report is an essential resource for industry professionals, investors, and strategic decision-makers seeking a thorough understanding of this rapidly evolving market. The total market size is projected to reach xx Million units by 2033.
Plant Protein Market Dynamics & Structure
The plant protein market is characterized by a moderately concentrated landscape, with key players like Archer Daniels Midland Company, Bunge Limited, and Kerry Group PLC holding significant market share (estimated at xx% collectively in 2025). Technological innovation, driven by the demand for healthier and more sustainable food options, is a major growth driver. Stringent regulatory frameworks concerning food safety and labeling influence market dynamics. Competitive substitutes include animal-based proteins, but increasing consumer awareness of health and environmental concerns favors plant-based alternatives.
- Market Concentration: Moderately concentrated, with top 5 players holding xx% market share in 2025.
- Technological Innovation: Focus on improving protein extraction methods, enhancing functionality, and creating novel applications.
- Regulatory Framework: Stringent food safety and labeling regulations impact product development and market entry.
- Competitive Substitutes: Animal-based proteins pose a significant challenge, though plant-based alternatives are gaining traction due to increased health awareness and sustainability concerns.
- End-User Demographics: Growing vegan and vegetarian populations are a key driver for market expansion.
- M&A Trends: Increased M&A activity indicates consolidation and expansion within the plant-based protein industry, with an estimated xx M&A deals in the period 2019-2024, driven by companies seeking to expand their product portfolio.
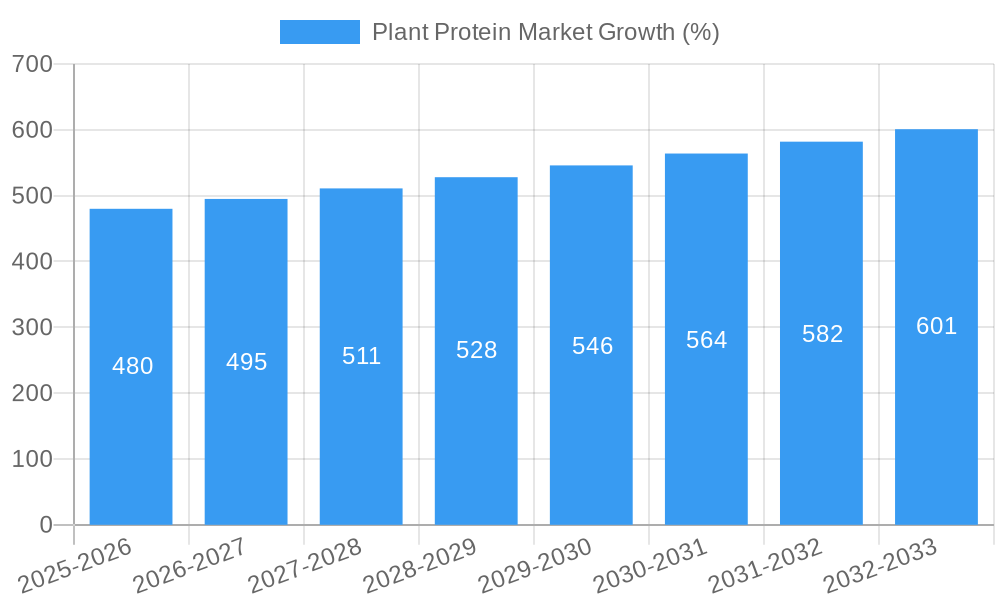
Plant Protein Market Growth Trends & Insights
The plant protein market exhibits strong growth potential, driven by rising consumer demand for plant-based diets, increasing health awareness, and growing concerns about the environmental impact of animal agriculture. The market has experienced a CAGR of xx% during the historical period (2019-2024) and is projected to maintain a robust CAGR of xx% during the forecast period (2025-2033). This growth is fueled by various factors, including increased adoption of plant-based diets, the rise of veganism and vegetarianism, and the increasing popularity of plant-based meat alternatives and sports nutrition products. Technological advancements in protein extraction and processing have significantly improved the functionality and quality of plant proteins, making them more appealing to consumers. The market penetration of plant-based protein in food & beverages is estimated at xx% in 2025.
Dominant Regions, Countries, or Segments in Plant Protein Market
North America and Europe currently dominate the plant protein market, driven by high consumer awareness, strong regulatory frameworks, and a well-established infrastructure supporting plant-based product development and distribution. However, Asia-Pacific is expected to exhibit the highest growth rate during the forecast period (2025-2033), fueled by rapidly expanding middle class, rising disposable incomes, and increased awareness of health and sustainability.
- Soy Protein: Remains the dominant protein type, holding a market share of approximately xx% in 2025.
- Pea Protein: Experiencing rapid growth due to its high protein content and excellent functional properties.
- North America: Strong market leader due to high consumer demand and technological advancements.
- Europe: Significant market share driven by a mature plant-based food market and supportive regulatory environment.
- Asia-Pacific: Fastest growing region due to increasing consumer awareness, rising disposable incomes, and expanding middle class.
Plant Protein Market Product Landscape
The plant protein market showcases continuous product innovation. New product launches focus on improving taste, texture, and functionality, addressing consumer demands for improved flavor profiles and better compatibility in diverse applications. Technological advancements are focused on enhancing protein extraction, minimizing processing, and increasing nutritional value, leading to premium offerings. Unique selling propositions include high protein content, sustainability credentials, and versatility in various food and beverage applications. For instance, Roquette's new Nutralys rice protein line offers superior functionality in meat substitutes.
Key Drivers, Barriers & Challenges in Plant Protein Market
Key Drivers:
- Growing consumer demand for plant-based diets due to health and environmental concerns.
- Technological advancements leading to improved taste, texture, and functionality of plant-based proteins.
- Favorable government regulations promoting the use of plant-based alternatives.
Key Challenges:
- Higher production costs compared to traditional protein sources.
- Allergenicity concerns and potential for cross-contamination in certain plant proteins.
- Maintaining consistent quality and supply chain management.
- Competition from traditional protein sources and established players in the market.
Emerging Opportunities in Plant Protein Market
- Untapped Markets: Expanding into emerging economies with increasing consumer awareness of plant-based diets.
- Innovative Applications: Development of new plant-based protein products in areas like ready-to-eat meals and snacks.
- Evolving Consumer Preferences: Catering to niche demands, like organic, non-GMO, and functional plant proteins.
Growth Accelerators in the Plant Protein Market Industry
Strategic partnerships and collaborations between plant protein manufacturers and food companies are fueling growth. Technological breakthroughs in protein extraction and processing are driving down costs and improving product quality. Expanding into new geographic markets, particularly in developing regions, provides significant growth potential.
Key Players Shaping the Plant Protein Market Market
- CHS Inc
- Lantmännen
- International Flavors & Fragrances Inc
- Tereos SCA
- Wilmar International Ltd
- Archer Daniels Midland Company
- Bunge Limited
- Fuji Oil Group
- Kerry Group PLC
- Südzucker AG
- Roquette Frère
Notable Milestones in Plant Protein Market Sector
- June 2022: Roquette launched its Nutralys rice protein line, addressing the growing demand for meat substitute ingredients.
- May 2022: BENEO (a Südzucker subsidiary) acquired Meatless BV, expanding its texturizing solutions for meat alternatives.
- January 2022: Kerry opened a new state-of-the-art facility in Saudi Arabia, boosting its production capacity in the Middle East.
In-Depth Plant Protein Market Market Outlook
The plant protein market is poised for sustained growth, driven by consistent technological advancements, increasing consumer demand, and expanding geographic reach. Strategic partnerships and collaborations within the industry, along with continued innovation in product development, will be vital in shaping the future of this dynamic sector, opening new opportunities for market expansion and sustainable growth.
Plant Protein Market Segmentation
-
1. Protein Type
- 1.1. Hemp Protein
- 1.2. Pea Protein
- 1.3. Potato Protein
- 1.4. Rice Protein
- 1.5. Soy Protein
- 1.6. Wheat Protein
- 1.7. Other Plant Protein
-
2. End User
- 2.1. Animal Feed
-
2.2. Food and Beverages
-
2.2.1. By Sub End User
- 2.2.1.1. Bakery
- 2.2.1.2. Breakfast Cereals
- 2.2.1.3. Condiments/Sauces
- 2.2.1.4. Confectionery
- 2.2.1.5. Dairy and Dairy Alternative Products
- 2.2.1.6. Meat/Poultry/Seafood and Meat Alternative Products
- 2.2.1.7. RTE/RTC Food Products
- 2.2.1.8. Snacks
-
2.2.1. By Sub End User
- 2.3. Personal Care and Cosmetics
-
2.4. Supplements
- 2.4.1. Baby Food and Infant Formula
- 2.4.2. Elderly Nutrition and Medical Nutrition
- 2.4.3. Sport/Performance Nutrition
Plant Protein Market Segmentation By Geography
-
1. North America
- 1.1. United States
- 1.2. Canada
- 1.3. Mexico
-
2. South America
- 2.1. Brazil
- 2.2. Argentina
- 2.3. Rest of South America
-
3. Europe
- 3.1. United Kingdom
- 3.2. Germany
- 3.3. France
- 3.4. Italy
- 3.5. Spain
- 3.6. Russia
- 3.7. Benelux
- 3.8. Nordics
- 3.9. Rest of Europe
-
4. Middle East & Africa
- 4.1. Turkey
- 4.2. Israel
- 4.3. GCC
- 4.4. North Africa
- 4.5. South Africa
- 4.6. Rest of Middle East & Africa
-
5. Asia Pacific
- 5.1. China
- 5.2. India
- 5.3. Japan
- 5.4. South Korea
- 5.5. ASEAN
- 5.6. Oceania
- 5.7. Rest of Asia Pacific

Plant Protein Market REPORT HIGHLIGHTS
| Aspects | Details |
|---|---|
| Study Period | 2019-2033 |
| Base Year | 2024 |
| Estimated Year | 2025 |
| Forecast Period | 2025-2033 |
| Historical Period | 2019-2024 |
| Growth Rate | CAGR of 4.02% from 2019-2033 |
| Segmentation |
|
Table of Contents
- 1. Introduction
- 1.1. Research Scope
- 1.2. Market Segmentation
- 1.3. Research Methodology
- 1.4. Definitions and Assumptions
- 2. Executive Summary
- 2.1. Introduction
- 3. Market Dynamics
- 3.1. Introduction
- 3.2. Market Drivers
- 3.2.1. Increasing awareness towards fitness among consumers; Demand for convenient fortified foods
- 3.3. Market Restrains
- 3.3.1. Prevalence of allergen intolerance among the consumers
- 3.4. Market Trends
- 3.4.1. OTHER KEY INDUSTRY TRENDS COVERED IN THE REPORT
- 4. Market Factor Analysis
- 4.1. Porters Five Forces
- 4.2. Supply/Value Chain
- 4.3. PESTEL analysis
- 4.4. Market Entropy
- 4.5. Patent/Trademark Analysis
- 5. Global Plant Protein Market Analysis, Insights and Forecast, 2019-2031
- 5.1. Market Analysis, Insights and Forecast - by Protein Type
- 5.1.1. Hemp Protein
- 5.1.2. Pea Protein
- 5.1.3. Potato Protein
- 5.1.4. Rice Protein
- 5.1.5. Soy Protein
- 5.1.6. Wheat Protein
- 5.1.7. Other Plant Protein
- 5.2. Market Analysis, Insights and Forecast - by End User
- 5.2.1. Animal Feed
- 5.2.2. Food and Beverages
- 5.2.2.1. By Sub End User
- 5.2.2.1.1. Bakery
- 5.2.2.1.2. Breakfast Cereals
- 5.2.2.1.3. Condiments/Sauces
- 5.2.2.1.4. Confectionery
- 5.2.2.1.5. Dairy and Dairy Alternative Products
- 5.2.2.1.6. Meat/Poultry/Seafood and Meat Alternative Products
- 5.2.2.1.7. RTE/RTC Food Products
- 5.2.2.1.8. Snacks
- 5.2.2.1. By Sub End User
- 5.2.3. Personal Care and Cosmetics
- 5.2.4. Supplements
- 5.2.4.1. Baby Food and Infant Formula
- 5.2.4.2. Elderly Nutrition and Medical Nutrition
- 5.2.4.3. Sport/Performance Nutrition
- 5.3. Market Analysis, Insights and Forecast - by Region
- 5.3.1. North America
- 5.3.2. South America
- 5.3.3. Europe
- 5.3.4. Middle East & Africa
- 5.3.5. Asia Pacific
- 5.1. Market Analysis, Insights and Forecast - by Protein Type
- 6. North America Plant Protein Market Analysis, Insights and Forecast, 2019-2031
- 6.1. Market Analysis, Insights and Forecast - by Protein Type
- 6.1.1. Hemp Protein
- 6.1.2. Pea Protein
- 6.1.3. Potato Protein
- 6.1.4. Rice Protein
- 6.1.5. Soy Protein
- 6.1.6. Wheat Protein
- 6.1.7. Other Plant Protein
- 6.2. Market Analysis, Insights and Forecast - by End User
- 6.2.1. Animal Feed
- 6.2.2. Food and Beverages
- 6.2.2.1. By Sub End User
- 6.2.2.1.1. Bakery
- 6.2.2.1.2. Breakfast Cereals
- 6.2.2.1.3. Condiments/Sauces
- 6.2.2.1.4. Confectionery
- 6.2.2.1.5. Dairy and Dairy Alternative Products
- 6.2.2.1.6. Meat/Poultry/Seafood and Meat Alternative Products
- 6.2.2.1.7. RTE/RTC Food Products
- 6.2.2.1.8. Snacks
- 6.2.2.1. By Sub End User
- 6.2.3. Personal Care and Cosmetics
- 6.2.4. Supplements
- 6.2.4.1. Baby Food and Infant Formula
- 6.2.4.2. Elderly Nutrition and Medical Nutrition
- 6.2.4.3. Sport/Performance Nutrition
- 6.1. Market Analysis, Insights and Forecast - by Protein Type
- 7. South America Plant Protein Market Analysis, Insights and Forecast, 2019-2031
- 7.1. Market Analysis, Insights and Forecast - by Protein Type
- 7.1.1. Hemp Protein
- 7.1.2. Pea Protein
- 7.1.3. Potato Protein
- 7.1.4. Rice Protein
- 7.1.5. Soy Protein
- 7.1.6. Wheat Protein
- 7.1.7. Other Plant Protein
- 7.2. Market Analysis, Insights and Forecast - by End User
- 7.2.1. Animal Feed
- 7.2.2. Food and Beverages
- 7.2.2.1. By Sub End User
- 7.2.2.1.1. Bakery
- 7.2.2.1.2. Breakfast Cereals
- 7.2.2.1.3. Condiments/Sauces
- 7.2.2.1.4. Confectionery
- 7.2.2.1.5. Dairy and Dairy Alternative Products
- 7.2.2.1.6. Meat/Poultry/Seafood and Meat Alternative Products
- 7.2.2.1.7. RTE/RTC Food Products
- 7.2.2.1.8. Snacks
- 7.2.2.1. By Sub End User
- 7.2.3. Personal Care and Cosmetics
- 7.2.4. Supplements
- 7.2.4.1. Baby Food and Infant Formula
- 7.2.4.2. Elderly Nutrition and Medical Nutrition
- 7.2.4.3. Sport/Performance Nutrition
- 7.1. Market Analysis, Insights and Forecast - by Protein Type
- 8. Europe Plant Protein Market Analysis, Insights and Forecast, 2019-2031
- 8.1. Market Analysis, Insights and Forecast - by Protein Type
- 8.1.1. Hemp Protein
- 8.1.2. Pea Protein
- 8.1.3. Potato Protein
- 8.1.4. Rice Protein
- 8.1.5. Soy Protein
- 8.1.6. Wheat Protein
- 8.1.7. Other Plant Protein
- 8.2. Market Analysis, Insights and Forecast - by End User
- 8.2.1. Animal Feed
- 8.2.2. Food and Beverages
- 8.2.2.1. By Sub End User
- 8.2.2.1.1. Bakery
- 8.2.2.1.2. Breakfast Cereals
- 8.2.2.1.3. Condiments/Sauces
- 8.2.2.1.4. Confectionery
- 8.2.2.1.5. Dairy and Dairy Alternative Products
- 8.2.2.1.6. Meat/Poultry/Seafood and Meat Alternative Products
- 8.2.2.1.7. RTE/RTC Food Products
- 8.2.2.1.8. Snacks
- 8.2.2.1. By Sub End User
- 8.2.3. Personal Care and Cosmetics
- 8.2.4. Supplements
- 8.2.4.1. Baby Food and Infant Formula
- 8.2.4.2. Elderly Nutrition and Medical Nutrition
- 8.2.4.3. Sport/Performance Nutrition
- 8.1. Market Analysis, Insights and Forecast - by Protein Type
- 9. Middle East & Africa Plant Protein Market Analysis, Insights and Forecast, 2019-2031
- 9.1. Market Analysis, Insights and Forecast - by Protein Type
- 9.1.1. Hemp Protein
- 9.1.2. Pea Protein
- 9.1.3. Potato Protein
- 9.1.4. Rice Protein
- 9.1.5. Soy Protein
- 9.1.6. Wheat Protein
- 9.1.7. Other Plant Protein
- 9.2. Market Analysis, Insights and Forecast - by End User
- 9.2.1. Animal Feed
- 9.2.2. Food and Beverages
- 9.2.2.1. By Sub End User
- 9.2.2.1.1. Bakery
- 9.2.2.1.2. Breakfast Cereals
- 9.2.2.1.3. Condiments/Sauces
- 9.2.2.1.4. Confectionery
- 9.2.2.1.5. Dairy and Dairy Alternative Products
- 9.2.2.1.6. Meat/Poultry/Seafood and Meat Alternative Products
- 9.2.2.1.7. RTE/RTC Food Products
- 9.2.2.1.8. Snacks
- 9.2.2.1. By Sub End User
- 9.2.3. Personal Care and Cosmetics
- 9.2.4. Supplements
- 9.2.4.1. Baby Food and Infant Formula
- 9.2.4.2. Elderly Nutrition and Medical Nutrition
- 9.2.4.3. Sport/Performance Nutrition
- 9.1. Market Analysis, Insights and Forecast - by Protein Type
- 10. Asia Pacific Plant Protein Market Analysis, Insights and Forecast, 2019-2031
- 10.1. Market Analysis, Insights and Forecast - by Protein Type
- 10.1.1. Hemp Protein
- 10.1.2. Pea Protein
- 10.1.3. Potato Protein
- 10.1.4. Rice Protein
- 10.1.5. Soy Protein
- 10.1.6. Wheat Protein
- 10.1.7. Other Plant Protein
- 10.2. Market Analysis, Insights and Forecast - by End User
- 10.2.1. Animal Feed
- 10.2.2. Food and Beverages
- 10.2.2.1. By Sub End User
- 10.2.2.1.1. Bakery
- 10.2.2.1.2. Breakfast Cereals
- 10.2.2.1.3. Condiments/Sauces
- 10.2.2.1.4. Confectionery
- 10.2.2.1.5. Dairy and Dairy Alternative Products
- 10.2.2.1.6. Meat/Poultry/Seafood and Meat Alternative Products
- 10.2.2.1.7. RTE/RTC Food Products
- 10.2.2.1.8. Snacks
- 10.2.2.1. By Sub End User
- 10.2.3. Personal Care and Cosmetics
- 10.2.4. Supplements
- 10.2.4.1. Baby Food and Infant Formula
- 10.2.4.2. Elderly Nutrition and Medical Nutrition
- 10.2.4.3. Sport/Performance Nutrition
- 10.1. Market Analysis, Insights and Forecast - by Protein Type
- 11. North America Plant Protein Market Analysis, Insights and Forecast, 2019-2031
- 11.1. Market Analysis, Insights and Forecast - By Country/Sub-region
- 11.1.1. undefined
- 12. Europe Plant Protein Market Analysis, Insights and Forecast, 2019-2031
- 12.1. Market Analysis, Insights and Forecast - By Country/Sub-region
- 12.1.1. undefined
- 13. Asia-Pacific Plant Protein Market Analysis, Insights and Forecast, 2019-2031
- 13.1. Market Analysis, Insights and Forecast - By Country/Sub-region
- 13.1.1. undefined
- 14. Competitive Analysis
- 14.1. Global Market Share Analysis 2024
- 14.2. Company Profiles
- 14.2.1 CHS Inc
- 14.2.1.1. Overview
- 14.2.1.2. Products
- 14.2.1.3. SWOT Analysis
- 14.2.1.4. Recent Developments
- 14.2.1.5. Financials (Based on Availability)
- 14.2.2 Lantmännen
- 14.2.2.1. Overview
- 14.2.2.2. Products
- 14.2.2.3. SWOT Analysis
- 14.2.2.4. Recent Developments
- 14.2.2.5. Financials (Based on Availability)
- 14.2.3 International Flavors & Fragrances Inc
- 14.2.3.1. Overview
- 14.2.3.2. Products
- 14.2.3.3. SWOT Analysis
- 14.2.3.4. Recent Developments
- 14.2.3.5. Financials (Based on Availability)
- 14.2.4 Tereos SCA
- 14.2.4.1. Overview
- 14.2.4.2. Products
- 14.2.4.3. SWOT Analysis
- 14.2.4.4. Recent Developments
- 14.2.4.5. Financials (Based on Availability)
- 14.2.5 Wilmar International Lt
- 14.2.5.1. Overview
- 14.2.5.2. Products
- 14.2.5.3. SWOT Analysis
- 14.2.5.4. Recent Developments
- 14.2.5.5. Financials (Based on Availability)
- 14.2.6 Archer Daniels Midland Company
- 14.2.6.1. Overview
- 14.2.6.2. Products
- 14.2.6.3. SWOT Analysis
- 14.2.6.4. Recent Developments
- 14.2.6.5. Financials (Based on Availability)
- 14.2.7 Bunge Limited
- 14.2.7.1. Overview
- 14.2.7.2. Products
- 14.2.7.3. SWOT Analysis
- 14.2.7.4. Recent Developments
- 14.2.7.5. Financials (Based on Availability)
- 14.2.8 Fuji Oil Group
- 14.2.8.1. Overview
- 14.2.8.2. Products
- 14.2.8.3. SWOT Analysis
- 14.2.8.4. Recent Developments
- 14.2.8.5. Financials (Based on Availability)
- 14.2.9 Kerry Group PLC
- 14.2.9.1. Overview
- 14.2.9.2. Products
- 14.2.9.3. SWOT Analysis
- 14.2.9.4. Recent Developments
- 14.2.9.5. Financials (Based on Availability)
- 14.2.10 Südzucker AG
- 14.2.10.1. Overview
- 14.2.10.2. Products
- 14.2.10.3. SWOT Analysis
- 14.2.10.4. Recent Developments
- 14.2.10.5. Financials (Based on Availability)
- 14.2.11 Roquette Frère
- 14.2.11.1. Overview
- 14.2.11.2. Products
- 14.2.11.3. SWOT Analysis
- 14.2.11.4. Recent Developments
- 14.2.11.5. Financials (Based on Availability)
- 14.2.1 CHS Inc
List of Figures
- Figure 1: Global Plant Protein Market Revenue Breakdown (Million, %) by Region 2024 & 2032
- Figure 2: Global Plant Protein Market Volume Breakdown (K Tons, %) by Region 2024 & 2032
- Figure 3: North America Plant Protein Market Revenue (Million), by Country 2024 & 2032
- Figure 4: North America Plant Protein Market Volume (K Tons), by Country 2024 & 2032
- Figure 5: North America Plant Protein Market Revenue Share (%), by Country 2024 & 2032
- Figure 6: North America Plant Protein Market Volume Share (%), by Country 2024 & 2032
- Figure 7: Europe Plant Protein Market Revenue (Million), by Country 2024 & 2032
- Figure 8: Europe Plant Protein Market Volume (K Tons), by Country 2024 & 2032
- Figure 9: Europe Plant Protein Market Revenue Share (%), by Country 2024 & 2032
- Figure 10: Europe Plant Protein Market Volume Share (%), by Country 2024 & 2032
- Figure 11: Asia-Pacific Plant Protein Market Revenue (Million), by Country 2024 & 2032
- Figure 12: Asia-Pacific Plant Protein Market Volume (K Tons), by Country 2024 & 2032
- Figure 13: Asia-Pacific Plant Protein Market Revenue Share (%), by Country 2024 & 2032
- Figure 14: Asia-Pacific Plant Protein Market Volume Share (%), by Country 2024 & 2032
- Figure 15: North America Plant Protein Market Revenue (Million), by Protein Type 2024 & 2032
- Figure 16: North America Plant Protein Market Volume (K Tons), by Protein Type 2024 & 2032
- Figure 17: North America Plant Protein Market Revenue Share (%), by Protein Type 2024 & 2032
- Figure 18: North America Plant Protein Market Volume Share (%), by Protein Type 2024 & 2032
- Figure 19: North America Plant Protein Market Revenue (Million), by End User 2024 & 2032
- Figure 20: North America Plant Protein Market Volume (K Tons), by End User 2024 & 2032
- Figure 21: North America Plant Protein Market Revenue Share (%), by End User 2024 & 2032
- Figure 22: North America Plant Protein Market Volume Share (%), by End User 2024 & 2032
- Figure 23: North America Plant Protein Market Revenue (Million), by Country 2024 & 2032
- Figure 24: North America Plant Protein Market Volume (K Tons), by Country 2024 & 2032
- Figure 25: North America Plant Protein Market Revenue Share (%), by Country 2024 & 2032
- Figure 26: North America Plant Protein Market Volume Share (%), by Country 2024 & 2032
- Figure 27: South America Plant Protein Market Revenue (Million), by Protein Type 2024 & 2032
- Figure 28: South America Plant Protein Market Volume (K Tons), by Protein Type 2024 & 2032
- Figure 29: South America Plant Protein Market Revenue Share (%), by Protein Type 2024 & 2032
- Figure 30: South America Plant Protein Market Volume Share (%), by Protein Type 2024 & 2032
- Figure 31: South America Plant Protein Market Revenue (Million), by End User 2024 & 2032
- Figure 32: South America Plant Protein Market Volume (K Tons), by End User 2024 & 2032
- Figure 33: South America Plant Protein Market Revenue Share (%), by End User 2024 & 2032
- Figure 34: South America Plant Protein Market Volume Share (%), by End User 2024 & 2032
- Figure 35: South America Plant Protein Market Revenue (Million), by Country 2024 & 2032
- Figure 36: South America Plant Protein Market Volume (K Tons), by Country 2024 & 2032
- Figure 37: South America Plant Protein Market Revenue Share (%), by Country 2024 & 2032
- Figure 38: South America Plant Protein Market Volume Share (%), by Country 2024 & 2032
- Figure 39: Europe Plant Protein Market Revenue (Million), by Protein Type 2024 & 2032
- Figure 40: Europe Plant Protein Market Volume (K Tons), by Protein Type 2024 & 2032
- Figure 41: Europe Plant Protein Market Revenue Share (%), by Protein Type 2024 & 2032
- Figure 42: Europe Plant Protein Market Volume Share (%), by Protein Type 2024 & 2032
- Figure 43: Europe Plant Protein Market Revenue (Million), by End User 2024 & 2032
- Figure 44: Europe Plant Protein Market Volume (K Tons), by End User 2024 & 2032
- Figure 45: Europe Plant Protein Market Revenue Share (%), by End User 2024 & 2032
- Figure 46: Europe Plant Protein Market Volume Share (%), by End User 2024 & 2032
- Figure 47: Europe Plant Protein Market Revenue (Million), by Country 2024 & 2032
- Figure 48: Europe Plant Protein Market Volume (K Tons), by Country 2024 & 2032
- Figure 49: Europe Plant Protein Market Revenue Share (%), by Country 2024 & 2032
- Figure 50: Europe Plant Protein Market Volume Share (%), by Country 2024 & 2032
- Figure 51: Middle East & Africa Plant Protein Market Revenue (Million), by Protein Type 2024 & 2032
- Figure 52: Middle East & Africa Plant Protein Market Volume (K Tons), by Protein Type 2024 & 2032
- Figure 53: Middle East & Africa Plant Protein Market Revenue Share (%), by Protein Type 2024 & 2032
- Figure 54: Middle East & Africa Plant Protein Market Volume Share (%), by Protein Type 2024 & 2032
- Figure 55: Middle East & Africa Plant Protein Market Revenue (Million), by End User 2024 & 2032
- Figure 56: Middle East & Africa Plant Protein Market Volume (K Tons), by End User 2024 & 2032
- Figure 57: Middle East & Africa Plant Protein Market Revenue Share (%), by End User 2024 & 2032
- Figure 58: Middle East & Africa Plant Protein Market Volume Share (%), by End User 2024 & 2032
- Figure 59: Middle East & Africa Plant Protein Market Revenue (Million), by Country 2024 & 2032
- Figure 60: Middle East & Africa Plant Protein Market Volume (K Tons), by Country 2024 & 2032
- Figure 61: Middle East & Africa Plant Protein Market Revenue Share (%), by Country 2024 & 2032
- Figure 62: Middle East & Africa Plant Protein Market Volume Share (%), by Country 2024 & 2032
- Figure 63: Asia Pacific Plant Protein Market Revenue (Million), by Protein Type 2024 & 2032
- Figure 64: Asia Pacific Plant Protein Market Volume (K Tons), by Protein Type 2024 & 2032
- Figure 65: Asia Pacific Plant Protein Market Revenue Share (%), by Protein Type 2024 & 2032
- Figure 66: Asia Pacific Plant Protein Market Volume Share (%), by Protein Type 2024 & 2032
- Figure 67: Asia Pacific Plant Protein Market Revenue (Million), by End User 2024 & 2032
- Figure 68: Asia Pacific Plant Protein Market Volume (K Tons), by End User 2024 & 2032
- Figure 69: Asia Pacific Plant Protein Market Revenue Share (%), by End User 2024 & 2032
- Figure 70: Asia Pacific Plant Protein Market Volume Share (%), by End User 2024 & 2032
- Figure 71: Asia Pacific Plant Protein Market Revenue (Million), by Country 2024 & 2032
- Figure 72: Asia Pacific Plant Protein Market Volume (K Tons), by Country 2024 & 2032
- Figure 73: Asia Pacific Plant Protein Market Revenue Share (%), by Country 2024 & 2032
- Figure 74: Asia Pacific Plant Protein Market Volume Share (%), by Country 2024 & 2032
List of Tables
- Table 1: Global Plant Protein Market Revenue Million Forecast, by Region 2019 & 2032
- Table 2: Global Plant Protein Market Volume K Tons Forecast, by Region 2019 & 2032
- Table 3: Global Plant Protein Market Revenue Million Forecast, by Protein Type 2019 & 2032
- Table 4: Global Plant Protein Market Volume K Tons Forecast, by Protein Type 2019 & 2032
- Table 5: Global Plant Protein Market Revenue Million Forecast, by End User 2019 & 2032
- Table 6: Global Plant Protein Market Volume K Tons Forecast, by End User 2019 & 2032
- Table 7: Global Plant Protein Market Revenue Million Forecast, by Region 2019 & 2032
- Table 8: Global Plant Protein Market Volume K Tons Forecast, by Region 2019 & 2032
- Table 9: Global Plant Protein Market Revenue Million Forecast, by Country 2019 & 2032
- Table 10: Global Plant Protein Market Volume K Tons Forecast, by Country 2019 & 2032
- Table 11: Global Plant Protein Market Revenue Million Forecast, by Country 2019 & 2032
- Table 12: Global Plant Protein Market Volume K Tons Forecast, by Country 2019 & 2032
- Table 13: Global Plant Protein Market Revenue Million Forecast, by Country 2019 & 2032
- Table 14: Global Plant Protein Market Volume K Tons Forecast, by Country 2019 & 2032
- Table 15: Global Plant Protein Market Revenue Million Forecast, by Protein Type 2019 & 2032
- Table 16: Global Plant Protein Market Volume K Tons Forecast, by Protein Type 2019 & 2032
- Table 17: Global Plant Protein Market Revenue Million Forecast, by End User 2019 & 2032
- Table 18: Global Plant Protein Market Volume K Tons Forecast, by End User 2019 & 2032
- Table 19: Global Plant Protein Market Revenue Million Forecast, by Country 2019 & 2032
- Table 20: Global Plant Protein Market Volume K Tons Forecast, by Country 2019 & 2032
- Table 21: United States Plant Protein Market Revenue (Million) Forecast, by Application 2019 & 2032
- Table 22: United States Plant Protein Market Volume (K Tons) Forecast, by Application 2019 & 2032
- Table 23: Canada Plant Protein Market Revenue (Million) Forecast, by Application 2019 & 2032
- Table 24: Canada Plant Protein Market Volume (K Tons) Forecast, by Application 2019 & 2032
- Table 25: Mexico Plant Protein Market Revenue (Million) Forecast, by Application 2019 & 2032
- Table 26: Mexico Plant Protein Market Volume (K Tons) Forecast, by Application 2019 & 2032
- Table 27: Global Plant Protein Market Revenue Million Forecast, by Protein Type 2019 & 2032
- Table 28: Global Plant Protein Market Volume K Tons Forecast, by Protein Type 2019 & 2032
- Table 29: Global Plant Protein Market Revenue Million Forecast, by End User 2019 & 2032
- Table 30: Global Plant Protein Market Volume K Tons Forecast, by End User 2019 & 2032
- Table 31: Global Plant Protein Market Revenue Million Forecast, by Country 2019 & 2032
- Table 32: Global Plant Protein Market Volume K Tons Forecast, by Country 2019 & 2032
- Table 33: Brazil Plant Protein Market Revenue (Million) Forecast, by Application 2019 & 2032
- Table 34: Brazil Plant Protein Market Volume (K Tons) Forecast, by Application 2019 & 2032
- Table 35: Argentina Plant Protein Market Revenue (Million) Forecast, by Application 2019 & 2032
- Table 36: Argentina Plant Protein Market Volume (K Tons) Forecast, by Application 2019 & 2032
- Table 37: Rest of South America Plant Protein Market Revenue (Million) Forecast, by Application 2019 & 2032
- Table 38: Rest of South America Plant Protein Market Volume (K Tons) Forecast, by Application 2019 & 2032
- Table 39: Global Plant Protein Market Revenue Million Forecast, by Protein Type 2019 & 2032
- Table 40: Global Plant Protein Market Volume K Tons Forecast, by Protein Type 2019 & 2032
- Table 41: Global Plant Protein Market Revenue Million Forecast, by End User 2019 & 2032
- Table 42: Global Plant Protein Market Volume K Tons Forecast, by End User 2019 & 2032
- Table 43: Global Plant Protein Market Revenue Million Forecast, by Country 2019 & 2032
- Table 44: Global Plant Protein Market Volume K Tons Forecast, by Country 2019 & 2032
- Table 45: United Kingdom Plant Protein Market Revenue (Million) Forecast, by Application 2019 & 2032
- Table 46: United Kingdom Plant Protein Market Volume (K Tons) Forecast, by Application 2019 & 2032
- Table 47: Germany Plant Protein Market Revenue (Million) Forecast, by Application 2019 & 2032
- Table 48: Germany Plant Protein Market Volume (K Tons) Forecast, by Application 2019 & 2032
- Table 49: France Plant Protein Market Revenue (Million) Forecast, by Application 2019 & 2032
- Table 50: France Plant Protein Market Volume (K Tons) Forecast, by Application 2019 & 2032
- Table 51: Italy Plant Protein Market Revenue (Million) Forecast, by Application 2019 & 2032
- Table 52: Italy Plant Protein Market Volume (K Tons) Forecast, by Application 2019 & 2032
- Table 53: Spain Plant Protein Market Revenue (Million) Forecast, by Application 2019 & 2032
- Table 54: Spain Plant Protein Market Volume (K Tons) Forecast, by Application 2019 & 2032
- Table 55: Russia Plant Protein Market Revenue (Million) Forecast, by Application 2019 & 2032
- Table 56: Russia Plant Protein Market Volume (K Tons) Forecast, by Application 2019 & 2032
- Table 57: Benelux Plant Protein Market Revenue (Million) Forecast, by Application 2019 & 2032
- Table 58: Benelux Plant Protein Market Volume (K Tons) Forecast, by Application 2019 & 2032
- Table 59: Nordics Plant Protein Market Revenue (Million) Forecast, by Application 2019 & 2032
- Table 60: Nordics Plant Protein Market Volume (K Tons) Forecast, by Application 2019 & 2032
- Table 61: Rest of Europe Plant Protein Market Revenue (Million) Forecast, by Application 2019 & 2032
- Table 62: Rest of Europe Plant Protein Market Volume (K Tons) Forecast, by Application 2019 & 2032
- Table 63: Global Plant Protein Market Revenue Million Forecast, by Protein Type 2019 & 2032
- Table 64: Global Plant Protein Market Volume K Tons Forecast, by Protein Type 2019 & 2032
- Table 65: Global Plant Protein Market Revenue Million Forecast, by End User 2019 & 2032
- Table 66: Global Plant Protein Market Volume K Tons Forecast, by End User 2019 & 2032
- Table 67: Global Plant Protein Market Revenue Million Forecast, by Country 2019 & 2032
- Table 68: Global Plant Protein Market Volume K Tons Forecast, by Country 2019 & 2032
- Table 69: Turkey Plant Protein Market Revenue (Million) Forecast, by Application 2019 & 2032
- Table 70: Turkey Plant Protein Market Volume (K Tons) Forecast, by Application 2019 & 2032
- Table 71: Israel Plant Protein Market Revenue (Million) Forecast, by Application 2019 & 2032
- Table 72: Israel Plant Protein Market Volume (K Tons) Forecast, by Application 2019 & 2032
- Table 73: GCC Plant Protein Market Revenue (Million) Forecast, by Application 2019 & 2032
- Table 74: GCC Plant Protein Market Volume (K Tons) Forecast, by Application 2019 & 2032
- Table 75: North Africa Plant Protein Market Revenue (Million) Forecast, by Application 2019 & 2032
- Table 76: North Africa Plant Protein Market Volume (K Tons) Forecast, by Application 2019 & 2032
- Table 77: South Africa Plant Protein Market Revenue (Million) Forecast, by Application 2019 & 2032
- Table 78: South Africa Plant Protein Market Volume (K Tons) Forecast, by Application 2019 & 2032
- Table 79: Rest of Middle East & Africa Plant Protein Market Revenue (Million) Forecast, by Application 2019 & 2032
- Table 80: Rest of Middle East & Africa Plant Protein Market Volume (K Tons) Forecast, by Application 2019 & 2032
- Table 81: Global Plant Protein Market Revenue Million Forecast, by Protein Type 2019 & 2032
- Table 82: Global Plant Protein Market Volume K Tons Forecast, by Protein Type 2019 & 2032
- Table 83: Global Plant Protein Market Revenue Million Forecast, by End User 2019 & 2032
- Table 84: Global Plant Protein Market Volume K Tons Forecast, by End User 2019 & 2032
- Table 85: Global Plant Protein Market Revenue Million Forecast, by Country 2019 & 2032
- Table 86: Global Plant Protein Market Volume K Tons Forecast, by Country 2019 & 2032
- Table 87: China Plant Protein Market Revenue (Million) Forecast, by Application 2019 & 2032
- Table 88: China Plant Protein Market Volume (K Tons) Forecast, by Application 2019 & 2032
- Table 89: India Plant Protein Market Revenue (Million) Forecast, by Application 2019 & 2032
- Table 90: India Plant Protein Market Volume (K Tons) Forecast, by Application 2019 & 2032
- Table 91: Japan Plant Protein Market Revenue (Million) Forecast, by Application 2019 & 2032
- Table 92: Japan Plant Protein Market Volume (K Tons) Forecast, by Application 2019 & 2032
- Table 93: South Korea Plant Protein Market Revenue (Million) Forecast, by Application 2019 & 2032
- Table 94: South Korea Plant Protein Market Volume (K Tons) Forecast, by Application 2019 & 2032
- Table 95: ASEAN Plant Protein Market Revenue (Million) Forecast, by Application 2019 & 2032
- Table 96: ASEAN Plant Protein Market Volume (K Tons) Forecast, by Application 2019 & 2032
- Table 97: Oceania Plant Protein Market Revenue (Million) Forecast, by Application 2019 & 2032
- Table 98: Oceania Plant Protein Market Volume (K Tons) Forecast, by Application 2019 & 2032
- Table 99: Rest of Asia Pacific Plant Protein Market Revenue (Million) Forecast, by Application 2019 & 2032
- Table 100: Rest of Asia Pacific Plant Protein Market Volume (K Tons) Forecast, by Application 2019 & 2032
Frequently Asked Questions
1. What is the projected Compound Annual Growth Rate (CAGR) of the Plant Protein Market?
The projected CAGR is approximately 4.02%.
2. Which companies are prominent players in the Plant Protein Market?
Key companies in the market include CHS Inc, Lantmännen, International Flavors & Fragrances Inc, Tereos SCA, Wilmar International Lt, Archer Daniels Midland Company, Bunge Limited, Fuji Oil Group, Kerry Group PLC, Südzucker AG, Roquette Frère.
3. What are the main segments of the Plant Protein Market?
The market segments include Protein Type, End User.
4. Can you provide details about the market size?
The market size is estimated to be USD 12050 Million as of 2022.
5. What are some drivers contributing to market growth?
Increasing awareness towards fitness among consumers; Demand for convenient fortified foods.
6. What are the notable trends driving market growth?
OTHER KEY INDUSTRY TRENDS COVERED IN THE REPORT.
7. Are there any restraints impacting market growth?
Prevalence of allergen intolerance among the consumers.
8. Can you provide examples of recent developments in the market?
June 2022: Roquette, a plant-based protein manufacturer, released two novel rice proteins to address the market demand for meat substitute applications. The new Nutralys rice protein line includes a rice protein isolate and a rice protein concentrate. May 2022: BENEO, a subsidiary of Südzucker, entered a purchase agreement to acquire Meatless BV, a producer of functional ingredients. BENEO is expanding its existing product offering with the acquisition to offer an even broader range of texturizing solutions for meat and fish alternatives.January 2022: Kerry, the largest taste and nutrition company, officially opened a new 21,500-square-foot state-of-the-art facility at its Jeddah location in Saudi Arabia. The company has invested more than USD 90 million in the region, and this new facility is one of the most modern and efficient, which produces great tasting, nutritious, and sustainable food ingredients which will be distributed throughout the Middle East.
9. What pricing options are available for accessing the report?
Pricing options include single-user, multi-user, and enterprise licenses priced at USD 3800, USD 4500, and USD 5800 respectively.
10. Is the market size provided in terms of value or volume?
The market size is provided in terms of value, measured in Million and volume, measured in K Tons.
11. Are there any specific market keywords associated with the report?
Yes, the market keyword associated with the report is "Plant Protein Market," which aids in identifying and referencing the specific market segment covered.
12. How do I determine which pricing option suits my needs best?
The pricing options vary based on user requirements and access needs. Individual users may opt for single-user licenses, while businesses requiring broader access may choose multi-user or enterprise licenses for cost-effective access to the report.
13. Are there any additional resources or data provided in the Plant Protein Market report?
While the report offers comprehensive insights, it's advisable to review the specific contents or supplementary materials provided to ascertain if additional resources or data are available.
14. How can I stay updated on further developments or reports in the Plant Protein Market?
To stay informed about further developments, trends, and reports in the Plant Protein Market, consider subscribing to industry newsletters, following relevant companies and organizations, or regularly checking reputable industry news sources and publications.
Methodology
Step 1 - Identification of Relevant Samples Size from Population Database


Step 2 - Approaches for Defining Global Market Size (Value, Volume* & Price*)

Note*: In applicable scenarios
Step 3 - Data Sources
Primary Research
- Web Analytics
- Survey Reports
- Research Institute
- Latest Research Reports
- Opinion Leaders
Secondary Research
- Annual Reports
- White Paper
- Latest Press Release
- Industry Association
- Paid Database
- Investor Presentations

Step 4 - Data Triangulation
Involves using different sources of information in order to increase the validity of a study
These sources are likely to be stakeholders in a program - participants, other researchers, program staff, other community members, and so on.
Then we put all data in single framework & apply various statistical tools to find out the dynamic on the market.
During the analysis stage, feedback from the stakeholder groups would be compared to determine areas of agreement as well as areas of divergence
