

Key Insights
The Asia-Pacific (APAC) fruits and vegetables juice market presents a dynamic landscape with substantial growth potential. Driven by increasing health consciousness, rising disposable incomes, and a growing preference for convenient and healthy beverage options, the market is experiencing robust expansion. The region's diverse population and varied culinary traditions contribute to the demand for a wide range of juice products, from traditional fruit juices to innovative blends incorporating exotic fruits and vegetables. Key growth drivers include the expanding middle class, particularly in countries like India and China, which fuels demand for premium and functional juices. Furthermore, the rise of e-commerce platforms and organized retail channels is improving accessibility and distribution, further boosting market growth. While challenges exist, such as seasonal variations in fruit and vegetable supply and fluctuating raw material prices, the overall market outlook remains positive. The market is segmented by product type (nectar, still juice drinks, 100% juice), distribution channel (supermarkets/hypermarkets, convenience stores, specialty stores, online retail stores), and fruit/vegetable category. Competitive intensity is high, with both multinational corporations and local players vying for market share. Strategic initiatives such as product diversification, brand building, and expansion into newer markets are crucial for success within this competitive environment. The market's segmentation offers opportunities for niche players to focus on specific consumer preferences and develop targeted marketing strategies. The increasing demand for organic and functional juices, along with the growing trend of health and wellness, presents further avenues for innovation and growth.
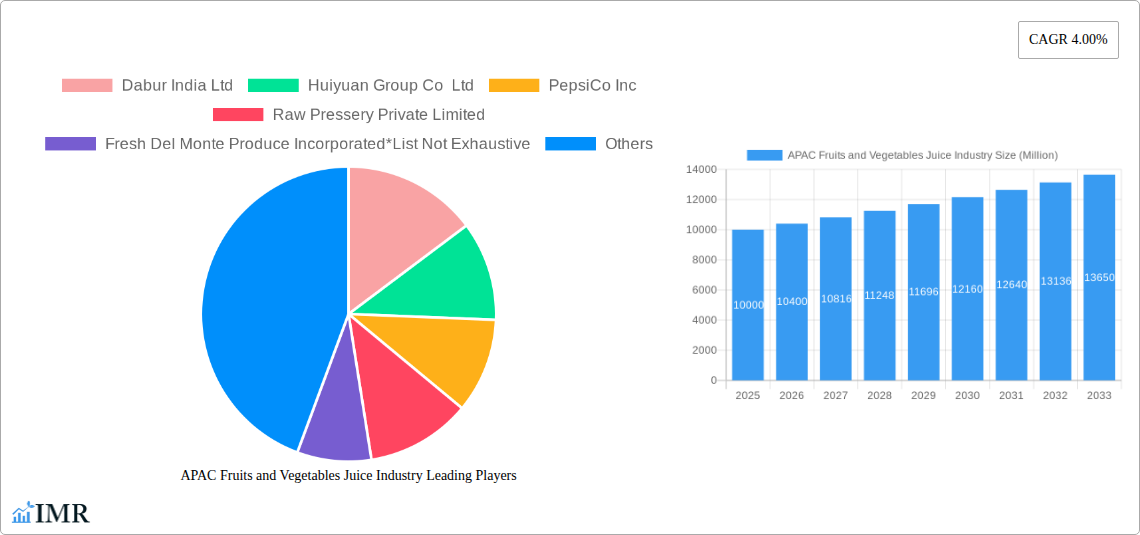
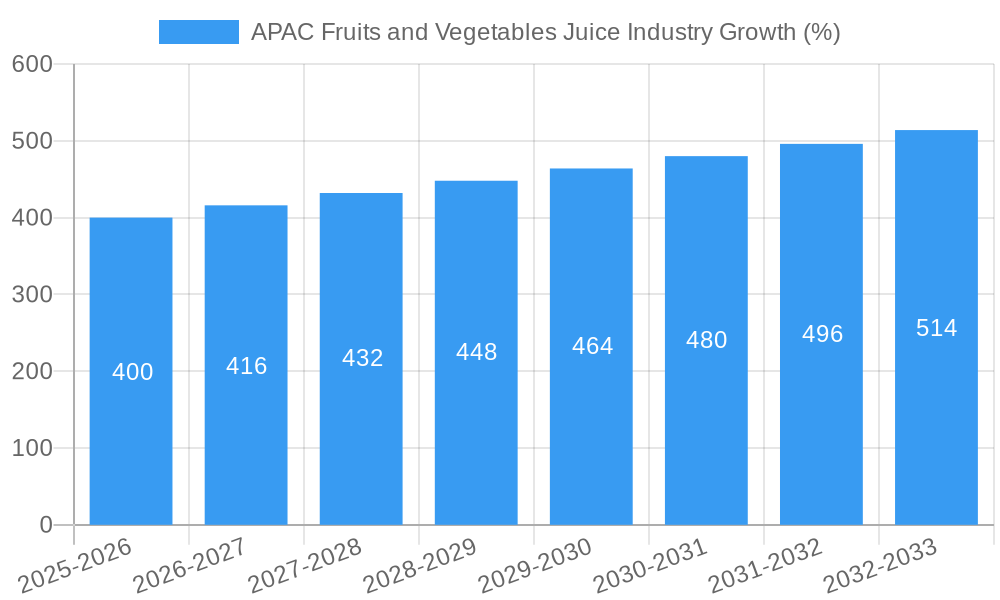
The projected Compound Annual Growth Rate (CAGR) of 4% for the global market suggests a steady increase in the APAC region as well. While precise regional data is not provided, a reasonable estimation based on the global CAGR and APAC's significant market share would predict a similar or slightly higher growth rate within the region. Assuming a 2025 APAC market size of approximately 10 billion USD (a reasonable estimate considering its significant population and consumption patterns), the market size can be projected over the forecast period (2025-2033) using this growth rate. The contribution of major players like Dabur, PepsiCo, and Coca-Cola significantly impacts the market dynamics. Their established distribution networks and marketing capabilities allow them to influence consumer choices and market trends. However, the emergence of smaller, regional players specializing in organic or functional juices presents a dynamic challenge and underscores the need for established players to innovate and adapt. The evolving preferences of health-conscious consumers create opportunities for specialized juice offerings to thrive alongside mainstream products.
APAC Fruits and Vegetables Juice Industry Report: 2019-2033
This comprehensive report provides a detailed analysis of the Asia-Pacific (APAC) fruits and vegetables juice industry, covering the period 2019-2033. It offers invaluable insights into market dynamics, growth trends, key players, and future opportunities, equipping industry professionals with the knowledge needed to navigate this dynamic sector. The report segments the market by category (fruit, vegetable), type (nectar, still juice drinks, 100% juice), and distribution channel (supermarkets/hypermarkets, convenience stores, specialty stores, online retail stores, other distribution channels), providing a granular understanding of market performance across various parameters. The base year for this report is 2025, with data covering the historical period (2019-2024), estimated year (2025), and forecast period (2025-2033). Key players analyzed include Dabur India Ltd, Huiyuan Group Co Ltd, PepsiCo Inc, Raw Pressery Private Limited, Fresh Del Monte Produce Incorporated, Citropak Limited, The Coca-Cola Company, The Juice Brothers Co, ITC Limited, and Patanjali Ayurved Limited.
APAC Fruits and Vegetables Juice Industry Market Dynamics & Structure
The APAC fruits and vegetables juice market is characterized by a moderately concentrated landscape with several major players and numerous smaller regional brands. Technological innovation, particularly in packaging and processing, plays a crucial role in driving growth, while evolving regulatory frameworks related to food safety and labeling influence market dynamics. Competitive pressures arise from the availability of substitute beverages, including carbonated drinks and other healthier options. The demographic shift toward health-conscious consumers is a significant tailwind. M&A activity has been moderate in recent years, primarily focused on consolidating smaller players.
- Market Concentration: The top 5 players hold an estimated xx% market share in 2025.
- Technological Innovation: Focus on extending shelf life, improving taste and nutritional value, and sustainable packaging.
- Regulatory Framework: Increasing emphasis on labeling transparency and food safety standards.
- Competitive Substitutes: Carbonated soft drinks, bottled water, and other functional beverages pose competition.
- End-User Demographics: Growing middle class and rising health awareness are key drivers of demand.
- M&A Trends: xx M&A deals were recorded between 2019 and 2024, primarily involving smaller companies. Further consolidation is anticipated.
APAC Fruits and Vegetables Juice Industry Growth Trends & Insights
The APAC fruits and vegetables juice market experienced significant growth between 2019 and 2024, driven primarily by increasing disposable incomes, changing consumer preferences towards healthier beverages, and rising health consciousness. The market is witnessing a shift towards premium and functional juices, with consumers increasingly demanding products enriched with vitamins, minerals, and other added benefits. Technological advancements in juice processing and packaging have extended shelf life and improved product quality, boosting market growth. The increasing adoption of online retail channels is further driving sales. The market is projected to witness a CAGR of xx% from 2025 to 2033, reaching a market size of xx Million units by 2033. Market penetration is currently at xx%, expected to increase to xx% by 2033. Technological disruptions, such as the introduction of innovative packaging solutions and advanced processing techniques, are further accelerating market expansion. Consumer behavior shifts are noticeable in the growing demand for organic and sustainably sourced juices.
Dominant Regions, Countries, or Segments in APAC Fruits and Vegetables Juice Industry
Within APAC, [Country X] and [Country Y] are currently the leading markets, accounting for xx% and xx% of the total market value in 2025, respectively. Strong economic growth, rising disposable incomes, and favorable consumer preferences towards fruit and vegetable juices are key drivers in these regions. The 100% juice segment holds the largest market share, driven by growing health consciousness. Supermarkets and hypermarkets dominate distribution channels due to their widespread availability and reach.
- Key Drivers in [Country X]: Strong economic growth, extensive supermarket networks, and a large, health-conscious population.
- Key Drivers in [Country Y]: Rapid urbanization, increasing disposable incomes, and a preference for convenient packaging formats.
- Segment Dominance: 100% juice segment shows significant growth potential due to its health benefits.
- Distribution Channel Dominance: Supermarkets/Hypermarkets hold a commanding position, with strong growth predicted in online retail channels.
APAC Fruits and Vegetables Juice Industry Product Landscape
Product innovation is a key driver in the APAC fruits and vegetables juice market. Manufacturers are constantly developing new flavors, functional ingredients, and convenient packaging formats to cater to evolving consumer preferences. The trend is toward premium juices, with enhanced taste and nutritional value, and innovative packaging solutions that extend shelf life and enhance the consumer experience. Key innovations include the use of aseptic packaging technologies, which enhance the shelf life of juice products.
Key Drivers, Barriers & Challenges in APAP Fruits and Vegetables Juice Industry
Key Drivers: Rising health awareness, increasing disposable incomes, expanding retail infrastructure, and growing demand for convenient beverages are key drivers. Technological advancements, particularly in packaging and processing, play a crucial role. Government initiatives promoting healthy lifestyles also contribute positively.
Key Challenges: Fluctuating raw material prices, stringent food safety regulations, and intense competition from other beverage categories pose significant challenges. Supply chain disruptions and the need for sustainable sourcing practices also add to the complexity of the market.
Emerging Opportunities in APAC Fruits and Vegetables Juice Industry
Untapped markets in rural areas, growing demand for organic and functional juices, and the increasing adoption of online and e-commerce channels present significant opportunities. The development of innovative packaging solutions and the integration of advanced technologies in processing are also creating new opportunities for growth. Developing specialized juices catering to niche dietary requirements is a promising avenue.
Growth Accelerators in the APAC Fruits and Vegetables Juice Industry
Technological breakthroughs in juice extraction and preservation, strategic partnerships between beverage manufacturers and agricultural producers, and expansion into new and emerging markets will propel market growth. Focus on innovative packaging solutions and expansion into online retail channels will further stimulate market development.
Key Players Shaping the APAC Fruits and Vegetables Juice Industry Market
- Dabur India Ltd
- Huiyuan Group Co Ltd
- PepsiCo Inc
- Raw Pressery Private Limited
- Fresh Del Monte Produce Incorporated
- Citropak Limited
- The Coca-Cola Company
- The Juice Brothers Co
- ITC Limited
- Patanjali Ayurved Limited
Notable Milestones in APAC Fruits and Vegetables Juice Industry Sector
- October 2022: Dabur announced a INR 325.87 crore investment in its Indore (India) plant to expand juice production capacity.
- October 2022: Minute Maid launched Honey Infused and Vita Punch variants in Punjab (India), expanding its product portfolio.
- November 2022: Tetra Pak introduced the Tetra Stelo Aseptic Package in India with Coca-Cola's Minute Maid Juice Range, signifying innovation in packaging.
In-Depth APAC Fruits and Vegetables Juice Industry Market Outlook
The APAC fruits and vegetables juice market is poised for robust growth in the coming years, driven by a confluence of factors, including increasing health awareness, rising disposable incomes, and the introduction of innovative products and technologies. Strategic partnerships, expansion into new markets, and a focus on sustainable sourcing practices will further enhance market growth. The focus on functional juices and convenient packaging formats, combined with the expansion of e-commerce channels, will propel market expansion, leading to significant opportunities for businesses operating in this segment.
APAC Fruits and Vegetables Juice Industry Segmentation
-
1. Category
- 1.1. Fruit
- 1.2. Vegetable
-
2. Type
- 2.1. Nectar
- 2.2. Still Juice Drinks
- 2.3. 100% Juice
-
3. Distribution Channel
- 3.1. Supermarkets/Hypermarkets
- 3.2. Convenience Stores
- 3.3. Speciality Stores
- 3.4. Online Retail Stores
- 3.5. Other Distribution Channels
-
4. Geography
- 4.1. China
- 4.2. Japan
- 4.3. India
- 4.4. Australia
- 4.5. Rest of Asia-Pacific
APAC Fruits and Vegetables Juice Industry Segmentation By Geography
- 1. China
- 2. Japan
- 3. India
- 4. Australia
- 5. Rest of Asia Pacific
APAC Fruits and Vegetables Juice Industry REPORT HIGHLIGHTS
| Aspects | Details |
|---|---|
| Study Period | 2019-2033 |
| Base Year | 2024 |
| Estimated Year | 2025 |
| Forecast Period | 2025-2033 |
| Historical Period | 2019-2024 |
| Growth Rate | CAGR of 4.00% from 2019-2033 |
| Segmentation |
|
Table of Contents
- 1. Introduction
- 1.1. Research Scope
- 1.2. Market Segmentation
- 1.3. Research Methodology
- 1.4. Definitions and Assumptions
- 2. Executive Summary
- 2.1. Introduction
- 3. Market Dynamics
- 3.1. Introduction
- 3.2. Market Drivers
- 3.2.1. Increasing Health Consciousness Among Consumers; Increasing Demand for Vegan Food Products
- 3.3. Market Restrains
- 3.3.1. Poor Supply Chain
- 3.4. Market Trends
- 3.4.1. Growing Demand for Organic Beverages
- 4. Market Factor Analysis
- 4.1. Porters Five Forces
- 4.2. Supply/Value Chain
- 4.3. PESTEL analysis
- 4.4. Market Entropy
- 4.5. Patent/Trademark Analysis
- 5. Global APAC Fruits and Vegetables Juice Industry Analysis, Insights and Forecast, 2019-2031
- 5.1. Market Analysis, Insights and Forecast - by Category
- 5.1.1. Fruit
- 5.1.2. Vegetable
- 5.2. Market Analysis, Insights and Forecast - by Type
- 5.2.1. Nectar
- 5.2.2. Still Juice Drinks
- 5.2.3. 100% Juice
- 5.3. Market Analysis, Insights and Forecast - by Distribution Channel
- 5.3.1. Supermarkets/Hypermarkets
- 5.3.2. Convenience Stores
- 5.3.3. Speciality Stores
- 5.3.4. Online Retail Stores
- 5.3.5. Other Distribution Channels
- 5.4. Market Analysis, Insights and Forecast - by Geography
- 5.4.1. China
- 5.4.2. Japan
- 5.4.3. India
- 5.4.4. Australia
- 5.4.5. Rest of Asia-Pacific
- 5.5. Market Analysis, Insights and Forecast - by Region
- 5.5.1. China
- 5.5.2. Japan
- 5.5.3. India
- 5.5.4. Australia
- 5.5.5. Rest of Asia Pacific
- 5.1. Market Analysis, Insights and Forecast - by Category
- 6. China APAC Fruits and Vegetables Juice Industry Analysis, Insights and Forecast, 2019-2031
- 6.1. Market Analysis, Insights and Forecast - by Category
- 6.1.1. Fruit
- 6.1.2. Vegetable
- 6.2. Market Analysis, Insights and Forecast - by Type
- 6.2.1. Nectar
- 6.2.2. Still Juice Drinks
- 6.2.3. 100% Juice
- 6.3. Market Analysis, Insights and Forecast - by Distribution Channel
- 6.3.1. Supermarkets/Hypermarkets
- 6.3.2. Convenience Stores
- 6.3.3. Speciality Stores
- 6.3.4. Online Retail Stores
- 6.3.5. Other Distribution Channels
- 6.4. Market Analysis, Insights and Forecast - by Geography
- 6.4.1. China
- 6.4.2. Japan
- 6.4.3. India
- 6.4.4. Australia
- 6.4.5. Rest of Asia-Pacific
- 6.1. Market Analysis, Insights and Forecast - by Category
- 7. Japan APAC Fruits and Vegetables Juice Industry Analysis, Insights and Forecast, 2019-2031
- 7.1. Market Analysis, Insights and Forecast - by Category
- 7.1.1. Fruit
- 7.1.2. Vegetable
- 7.2. Market Analysis, Insights and Forecast - by Type
- 7.2.1. Nectar
- 7.2.2. Still Juice Drinks
- 7.2.3. 100% Juice
- 7.3. Market Analysis, Insights and Forecast - by Distribution Channel
- 7.3.1. Supermarkets/Hypermarkets
- 7.3.2. Convenience Stores
- 7.3.3. Speciality Stores
- 7.3.4. Online Retail Stores
- 7.3.5. Other Distribution Channels
- 7.4. Market Analysis, Insights and Forecast - by Geography
- 7.4.1. China
- 7.4.2. Japan
- 7.4.3. India
- 7.4.4. Australia
- 7.4.5. Rest of Asia-Pacific
- 7.1. Market Analysis, Insights and Forecast - by Category
- 8. India APAC Fruits and Vegetables Juice Industry Analysis, Insights and Forecast, 2019-2031
- 8.1. Market Analysis, Insights and Forecast - by Category
- 8.1.1. Fruit
- 8.1.2. Vegetable
- 8.2. Market Analysis, Insights and Forecast - by Type
- 8.2.1. Nectar
- 8.2.2. Still Juice Drinks
- 8.2.3. 100% Juice
- 8.3. Market Analysis, Insights and Forecast - by Distribution Channel
- 8.3.1. Supermarkets/Hypermarkets
- 8.3.2. Convenience Stores
- 8.3.3. Speciality Stores
- 8.3.4. Online Retail Stores
- 8.3.5. Other Distribution Channels
- 8.4. Market Analysis, Insights and Forecast - by Geography
- 8.4.1. China
- 8.4.2. Japan
- 8.4.3. India
- 8.4.4. Australia
- 8.4.5. Rest of Asia-Pacific
- 8.1. Market Analysis, Insights and Forecast - by Category
- 9. Australia APAC Fruits and Vegetables Juice Industry Analysis, Insights and Forecast, 2019-2031
- 9.1. Market Analysis, Insights and Forecast - by Category
- 9.1.1. Fruit
- 9.1.2. Vegetable
- 9.2. Market Analysis, Insights and Forecast - by Type
- 9.2.1. Nectar
- 9.2.2. Still Juice Drinks
- 9.2.3. 100% Juice
- 9.3. Market Analysis, Insights and Forecast - by Distribution Channel
- 9.3.1. Supermarkets/Hypermarkets
- 9.3.2. Convenience Stores
- 9.3.3. Speciality Stores
- 9.3.4. Online Retail Stores
- 9.3.5. Other Distribution Channels
- 9.4. Market Analysis, Insights and Forecast - by Geography
- 9.4.1. China
- 9.4.2. Japan
- 9.4.3. India
- 9.4.4. Australia
- 9.4.5. Rest of Asia-Pacific
- 9.1. Market Analysis, Insights and Forecast - by Category
- 10. Rest of Asia Pacific APAC Fruits and Vegetables Juice Industry Analysis, Insights and Forecast, 2019-2031
- 10.1. Market Analysis, Insights and Forecast - by Category
- 10.1.1. Fruit
- 10.1.2. Vegetable
- 10.2. Market Analysis, Insights and Forecast - by Type
- 10.2.1. Nectar
- 10.2.2. Still Juice Drinks
- 10.2.3. 100% Juice
- 10.3. Market Analysis, Insights and Forecast - by Distribution Channel
- 10.3.1. Supermarkets/Hypermarkets
- 10.3.2. Convenience Stores
- 10.3.3. Speciality Stores
- 10.3.4. Online Retail Stores
- 10.3.5. Other Distribution Channels
- 10.4. Market Analysis, Insights and Forecast - by Geography
- 10.4.1. China
- 10.4.2. Japan
- 10.4.3. India
- 10.4.4. Australia
- 10.4.5. Rest of Asia-Pacific
- 10.1. Market Analysis, Insights and Forecast - by Category
- 11. North America APAC Fruits and Vegetables Juice Industry Analysis, Insights and Forecast, 2019-2031
- 11.1. Market Analysis, Insights and Forecast - By Country/Sub-region
- 11.1.1 United States
- 11.1.2 Canada
- 11.1.3 Mexico
- 12. Europe APAC Fruits and Vegetables Juice Industry Analysis, Insights and Forecast, 2019-2031
- 12.1. Market Analysis, Insights and Forecast - By Country/Sub-region
- 12.1.1 Germany
- 12.1.2 United Kingdom
- 12.1.3 France
- 12.1.4 Spain
- 12.1.5 Italy
- 12.1.6 Spain
- 12.1.7 Belgium
- 12.1.8 Netherland
- 12.1.9 Nordics
- 12.1.10 Rest of Europe
- 13. Asia Pacific APAC Fruits and Vegetables Juice Industry Analysis, Insights and Forecast, 2019-2031
- 13.1. Market Analysis, Insights and Forecast - By Country/Sub-region
- 13.1.1 China
- 13.1.2 Japan
- 13.1.3 India
- 13.1.4 South Korea
- 13.1.5 Southeast Asia
- 13.1.6 Australia
- 13.1.7 Indonesia
- 13.1.8 Phillipes
- 13.1.9 Singapore
- 13.1.10 Thailandc
- 13.1.11 Rest of Asia Pacific
- 14. South America APAC Fruits and Vegetables Juice Industry Analysis, Insights and Forecast, 2019-2031
- 14.1. Market Analysis, Insights and Forecast - By Country/Sub-region
- 14.1.1 Brazil
- 14.1.2 Argentina
- 14.1.3 Peru
- 14.1.4 Chile
- 14.1.5 Colombia
- 14.1.6 Ecuador
- 14.1.7 Venezuela
- 14.1.8 Rest of South America
- 15. North America APAC Fruits and Vegetables Juice Industry Analysis, Insights and Forecast, 2019-2031
- 15.1. Market Analysis, Insights and Forecast - By Country/Sub-region
- 15.1.1 United States
- 15.1.2 Canada
- 15.1.3 Mexico
- 16. MEA APAC Fruits and Vegetables Juice Industry Analysis, Insights and Forecast, 2019-2031
- 16.1. Market Analysis, Insights and Forecast - By Country/Sub-region
- 16.1.1 United Arab Emirates
- 16.1.2 Saudi Arabia
- 16.1.3 South Africa
- 16.1.4 Rest of Middle East and Africa
- 17. Competitive Analysis
- 17.1. Global Market Share Analysis 2024
- 17.2. Company Profiles
- 17.2.1 Dabur India Ltd
- 17.2.1.1. Overview
- 17.2.1.2. Products
- 17.2.1.3. SWOT Analysis
- 17.2.1.4. Recent Developments
- 17.2.1.5. Financials (Based on Availability)
- 17.2.2 Huiyuan Group Co Ltd
- 17.2.2.1. Overview
- 17.2.2.2. Products
- 17.2.2.3. SWOT Analysis
- 17.2.2.4. Recent Developments
- 17.2.2.5. Financials (Based on Availability)
- 17.2.3 PepsiCo Inc
- 17.2.3.1. Overview
- 17.2.3.2. Products
- 17.2.3.3. SWOT Analysis
- 17.2.3.4. Recent Developments
- 17.2.3.5. Financials (Based on Availability)
- 17.2.4 Raw Pressery Private Limited
- 17.2.4.1. Overview
- 17.2.4.2. Products
- 17.2.4.3. SWOT Analysis
- 17.2.4.4. Recent Developments
- 17.2.4.5. Financials (Based on Availability)
- 17.2.5 Fresh Del Monte Produce Incorporated*List Not Exhaustive
- 17.2.5.1. Overview
- 17.2.5.2. Products
- 17.2.5.3. SWOT Analysis
- 17.2.5.4. Recent Developments
- 17.2.5.5. Financials (Based on Availability)
- 17.2.6 Citropak Limited
- 17.2.6.1. Overview
- 17.2.6.2. Products
- 17.2.6.3. SWOT Analysis
- 17.2.6.4. Recent Developments
- 17.2.6.5. Financials (Based on Availability)
- 17.2.7 The Coca-Cola Company
- 17.2.7.1. Overview
- 17.2.7.2. Products
- 17.2.7.3. SWOT Analysis
- 17.2.7.4. Recent Developments
- 17.2.7.5. Financials (Based on Availability)
- 17.2.8 The Juice Brothers Co
- 17.2.8.1. Overview
- 17.2.8.2. Products
- 17.2.8.3. SWOT Analysis
- 17.2.8.4. Recent Developments
- 17.2.8.5. Financials (Based on Availability)
- 17.2.9 ITC Limited
- 17.2.9.1. Overview
- 17.2.9.2. Products
- 17.2.9.3. SWOT Analysis
- 17.2.9.4. Recent Developments
- 17.2.9.5. Financials (Based on Availability)
- 17.2.10 Patanjali Ayurved Limited
- 17.2.10.1. Overview
- 17.2.10.2. Products
- 17.2.10.3. SWOT Analysis
- 17.2.10.4. Recent Developments
- 17.2.10.5. Financials (Based on Availability)
- 17.2.1 Dabur India Ltd
List of Figures
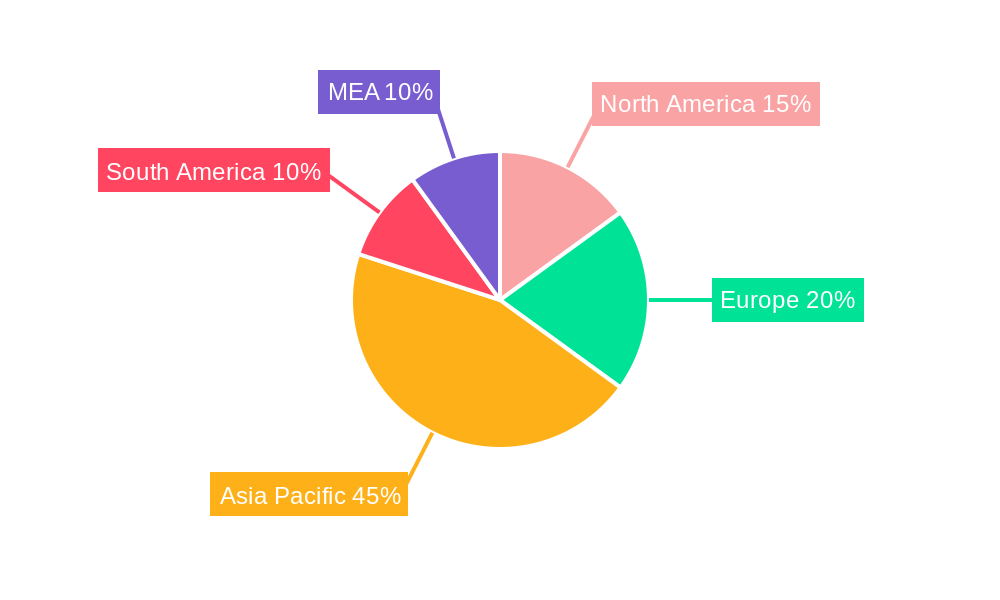
- Figure 1: Global APAC Fruits and Vegetables Juice Industry Revenue Breakdown (Million, %) by Region 2024 & 2032
- Figure 2: North America APAC Fruits and Vegetables Juice Industry Revenue (Million), by Country 2024 & 2032
- Figure 3: North America APAC Fruits and Vegetables Juice Industry Revenue Share (%), by Country 2024 & 2032
- Figure 4: Europe APAC Fruits and Vegetables Juice Industry Revenue (Million), by Country 2024 & 2032
- Figure 5: Europe APAC Fruits and Vegetables Juice Industry Revenue Share (%), by Country 2024 & 2032
- Figure 6: Asia Pacific APAC Fruits and Vegetables Juice Industry Revenue (Million), by Country 2024 & 2032
- Figure 7: Asia Pacific APAC Fruits and Vegetables Juice Industry Revenue Share (%), by Country 2024 & 2032
- Figure 8: South America APAC Fruits and Vegetables Juice Industry Revenue (Million), by Country 2024 & 2032
- Figure 9: South America APAC Fruits and Vegetables Juice Industry Revenue Share (%), by Country 2024 & 2032
- Figure 10: North America APAC Fruits and Vegetables Juice Industry Revenue (Million), by Country 2024 & 2032
- Figure 11: North America APAC Fruits and Vegetables Juice Industry Revenue Share (%), by Country 2024 & 2032
- Figure 12: MEA APAC Fruits and Vegetables Juice Industry Revenue (Million), by Country 2024 & 2032
- Figure 13: MEA APAC Fruits and Vegetables Juice Industry Revenue Share (%), by Country 2024 & 2032
- Figure 14: China APAC Fruits and Vegetables Juice Industry Revenue (Million), by Category 2024 & 2032
- Figure 15: China APAC Fruits and Vegetables Juice Industry Revenue Share (%), by Category 2024 & 2032
- Figure 16: China APAC Fruits and Vegetables Juice Industry Revenue (Million), by Type 2024 & 2032
- Figure 17: China APAC Fruits and Vegetables Juice Industry Revenue Share (%), by Type 2024 & 2032
- Figure 18: China APAC Fruits and Vegetables Juice Industry Revenue (Million), by Distribution Channel 2024 & 2032
- Figure 19: China APAC Fruits and Vegetables Juice Industry Revenue Share (%), by Distribution Channel 2024 & 2032
- Figure 20: China APAC Fruits and Vegetables Juice Industry Revenue (Million), by Geography 2024 & 2032
- Figure 21: China APAC Fruits and Vegetables Juice Industry Revenue Share (%), by Geography 2024 & 2032
- Figure 22: China APAC Fruits and Vegetables Juice Industry Revenue (Million), by Country 2024 & 2032
- Figure 23: China APAC Fruits and Vegetables Juice Industry Revenue Share (%), by Country 2024 & 2032
- Figure 24: Japan APAC Fruits and Vegetables Juice Industry Revenue (Million), by Category 2024 & 2032
- Figure 25: Japan APAC Fruits and Vegetables Juice Industry Revenue Share (%), by Category 2024 & 2032
- Figure 26: Japan APAC Fruits and Vegetables Juice Industry Revenue (Million), by Type 2024 & 2032
- Figure 27: Japan APAC Fruits and Vegetables Juice Industry Revenue Share (%), by Type 2024 & 2032
- Figure 28: Japan APAC Fruits and Vegetables Juice Industry Revenue (Million), by Distribution Channel 2024 & 2032
- Figure 29: Japan APAC Fruits and Vegetables Juice Industry Revenue Share (%), by Distribution Channel 2024 & 2032
- Figure 30: Japan APAC Fruits and Vegetables Juice Industry Revenue (Million), by Geography 2024 & 2032
- Figure 31: Japan APAC Fruits and Vegetables Juice Industry Revenue Share (%), by Geography 2024 & 2032
- Figure 32: Japan APAC Fruits and Vegetables Juice Industry Revenue (Million), by Country 2024 & 2032
- Figure 33: Japan APAC Fruits and Vegetables Juice Industry Revenue Share (%), by Country 2024 & 2032
- Figure 34: India APAC Fruits and Vegetables Juice Industry Revenue (Million), by Category 2024 & 2032
- Figure 35: India APAC Fruits and Vegetables Juice Industry Revenue Share (%), by Category 2024 & 2032
- Figure 36: India APAC Fruits and Vegetables Juice Industry Revenue (Million), by Type 2024 & 2032
- Figure 37: India APAC Fruits and Vegetables Juice Industry Revenue Share (%), by Type 2024 & 2032
- Figure 38: India APAC Fruits and Vegetables Juice Industry Revenue (Million), by Distribution Channel 2024 & 2032
- Figure 39: India APAC Fruits and Vegetables Juice Industry Revenue Share (%), by Distribution Channel 2024 & 2032
- Figure 40: India APAC Fruits and Vegetables Juice Industry Revenue (Million), by Geography 2024 & 2032
- Figure 41: India APAC Fruits and Vegetables Juice Industry Revenue Share (%), by Geography 2024 & 2032
- Figure 42: India APAC Fruits and Vegetables Juice Industry Revenue (Million), by Country 2024 & 2032
- Figure 43: India APAC Fruits and Vegetables Juice Industry Revenue Share (%), by Country 2024 & 2032
- Figure 44: Australia APAC Fruits and Vegetables Juice Industry Revenue (Million), by Category 2024 & 2032
- Figure 45: Australia APAC Fruits and Vegetables Juice Industry Revenue Share (%), by Category 2024 & 2032
- Figure 46: Australia APAC Fruits and Vegetables Juice Industry Revenue (Million), by Type 2024 & 2032
- Figure 47: Australia APAC Fruits and Vegetables Juice Industry Revenue Share (%), by Type 2024 & 2032
- Figure 48: Australia APAC Fruits and Vegetables Juice Industry Revenue (Million), by Distribution Channel 2024 & 2032
- Figure 49: Australia APAC Fruits and Vegetables Juice Industry Revenue Share (%), by Distribution Channel 2024 & 2032
- Figure 50: Australia APAC Fruits and Vegetables Juice Industry Revenue (Million), by Geography 2024 & 2032
- Figure 51: Australia APAC Fruits and Vegetables Juice Industry Revenue Share (%), by Geography 2024 & 2032
- Figure 52: Australia APAC Fruits and Vegetables Juice Industry Revenue (Million), by Country 2024 & 2032
- Figure 53: Australia APAC Fruits and Vegetables Juice Industry Revenue Share (%), by Country 2024 & 2032
- Figure 54: Rest of Asia Pacific APAC Fruits and Vegetables Juice Industry Revenue (Million), by Category 2024 & 2032
- Figure 55: Rest of Asia Pacific APAC Fruits and Vegetables Juice Industry Revenue Share (%), by Category 2024 & 2032
- Figure 56: Rest of Asia Pacific APAC Fruits and Vegetables Juice Industry Revenue (Million), by Type 2024 & 2032
- Figure 57: Rest of Asia Pacific APAC Fruits and Vegetables Juice Industry Revenue Share (%), by Type 2024 & 2032
- Figure 58: Rest of Asia Pacific APAC Fruits and Vegetables Juice Industry Revenue (Million), by Distribution Channel 2024 & 2032
- Figure 59: Rest of Asia Pacific APAC Fruits and Vegetables Juice Industry Revenue Share (%), by Distribution Channel 2024 & 2032
- Figure 60: Rest of Asia Pacific APAC Fruits and Vegetables Juice Industry Revenue (Million), by Geography 2024 & 2032
- Figure 61: Rest of Asia Pacific APAC Fruits and Vegetables Juice Industry Revenue Share (%), by Geography 2024 & 2032
- Figure 62: Rest of Asia Pacific APAC Fruits and Vegetables Juice Industry Revenue (Million), by Country 2024 & 2032
- Figure 63: Rest of Asia Pacific APAC Fruits and Vegetables Juice Industry Revenue Share (%), by Country 2024 & 2032
List of Tables
- Table 1: Global APAC Fruits and Vegetables Juice Industry Revenue Million Forecast, by Region 2019 & 2032
- Table 2: Global APAC Fruits and Vegetables Juice Industry Revenue Million Forecast, by Category 2019 & 2032
- Table 3: Global APAC Fruits and Vegetables Juice Industry Revenue Million Forecast, by Type 2019 & 2032
- Table 4: Global APAC Fruits and Vegetables Juice Industry Revenue Million Forecast, by Distribution Channel 2019 & 2032
- Table 5: Global APAC Fruits and Vegetables Juice Industry Revenue Million Forecast, by Geography 2019 & 2032
- Table 6: Global APAC Fruits and Vegetables Juice Industry Revenue Million Forecast, by Region 2019 & 2032
- Table 7: Global APAC Fruits and Vegetables Juice Industry Revenue Million Forecast, by Country 2019 & 2032
- Table 8: United States APAC Fruits and Vegetables Juice Industry Revenue (Million) Forecast, by Application 2019 & 2032
- Table 9: Canada APAC Fruits and Vegetables Juice Industry Revenue (Million) Forecast, by Application 2019 & 2032
- Table 10: Mexico APAC Fruits and Vegetables Juice Industry Revenue (Million) Forecast, by Application 2019 & 2032
- Table 11: Global APAC Fruits and Vegetables Juice Industry Revenue Million Forecast, by Country 2019 & 2032
- Table 12: Germany APAC Fruits and Vegetables Juice Industry Revenue (Million) Forecast, by Application 2019 & 2032
- Table 13: United Kingdom APAC Fruits and Vegetables Juice Industry Revenue (Million) Forecast, by Application 2019 & 2032
- Table 14: France APAC Fruits and Vegetables Juice Industry Revenue (Million) Forecast, by Application 2019 & 2032
- Table 15: Spain APAC Fruits and Vegetables Juice Industry Revenue (Million) Forecast, by Application 2019 & 2032
- Table 16: Italy APAC Fruits and Vegetables Juice Industry Revenue (Million) Forecast, by Application 2019 & 2032
- Table 17: Spain APAC Fruits and Vegetables Juice Industry Revenue (Million) Forecast, by Application 2019 & 2032
- Table 18: Belgium APAC Fruits and Vegetables Juice Industry Revenue (Million) Forecast, by Application 2019 & 2032
- Table 19: Netherland APAC Fruits and Vegetables Juice Industry Revenue (Million) Forecast, by Application 2019 & 2032
- Table 20: Nordics APAC Fruits and Vegetables Juice Industry Revenue (Million) Forecast, by Application 2019 & 2032
- Table 21: Rest of Europe APAC Fruits and Vegetables Juice Industry Revenue (Million) Forecast, by Application 2019 & 2032
- Table 22: Global APAC Fruits and Vegetables Juice Industry Revenue Million Forecast, by Country 2019 & 2032
- Table 23: China APAC Fruits and Vegetables Juice Industry Revenue (Million) Forecast, by Application 2019 & 2032
- Table 24: Japan APAC Fruits and Vegetables Juice Industry Revenue (Million) Forecast, by Application 2019 & 2032
- Table 25: India APAC Fruits and Vegetables Juice Industry Revenue (Million) Forecast, by Application 2019 & 2032
- Table 26: South Korea APAC Fruits and Vegetables Juice Industry Revenue (Million) Forecast, by Application 2019 & 2032
- Table 27: Southeast Asia APAC Fruits and Vegetables Juice Industry Revenue (Million) Forecast, by Application 2019 & 2032
- Table 28: Australia APAC Fruits and Vegetables Juice Industry Revenue (Million) Forecast, by Application 2019 & 2032
- Table 29: Indonesia APAC Fruits and Vegetables Juice Industry Revenue (Million) Forecast, by Application 2019 & 2032
- Table 30: Phillipes APAC Fruits and Vegetables Juice Industry Revenue (Million) Forecast, by Application 2019 & 2032
- Table 31: Singapore APAC Fruits and Vegetables Juice Industry Revenue (Million) Forecast, by Application 2019 & 2032
- Table 32: Thailandc APAC Fruits and Vegetables Juice Industry Revenue (Million) Forecast, by Application 2019 & 2032
- Table 33: Rest of Asia Pacific APAC Fruits and Vegetables Juice Industry Revenue (Million) Forecast, by Application 2019 & 2032
- Table 34: Global APAC Fruits and Vegetables Juice Industry Revenue Million Forecast, by Country 2019 & 2032
- Table 35: Brazil APAC Fruits and Vegetables Juice Industry Revenue (Million) Forecast, by Application 2019 & 2032
- Table 36: Argentina APAC Fruits and Vegetables Juice Industry Revenue (Million) Forecast, by Application 2019 & 2032
- Table 37: Peru APAC Fruits and Vegetables Juice Industry Revenue (Million) Forecast, by Application 2019 & 2032
- Table 38: Chile APAC Fruits and Vegetables Juice Industry Revenue (Million) Forecast, by Application 2019 & 2032
- Table 39: Colombia APAC Fruits and Vegetables Juice Industry Revenue (Million) Forecast, by Application 2019 & 2032
- Table 40: Ecuador APAC Fruits and Vegetables Juice Industry Revenue (Million) Forecast, by Application 2019 & 2032
- Table 41: Venezuela APAC Fruits and Vegetables Juice Industry Revenue (Million) Forecast, by Application 2019 & 2032
- Table 42: Rest of South America APAC Fruits and Vegetables Juice Industry Revenue (Million) Forecast, by Application 2019 & 2032
- Table 43: Global APAC Fruits and Vegetables Juice Industry Revenue Million Forecast, by Country 2019 & 2032
- Table 44: United States APAC Fruits and Vegetables Juice Industry Revenue (Million) Forecast, by Application 2019 & 2032
- Table 45: Canada APAC Fruits and Vegetables Juice Industry Revenue (Million) Forecast, by Application 2019 & 2032
- Table 46: Mexico APAC Fruits and Vegetables Juice Industry Revenue (Million) Forecast, by Application 2019 & 2032
- Table 47: Global APAC Fruits and Vegetables Juice Industry Revenue Million Forecast, by Country 2019 & 2032
- Table 48: United Arab Emirates APAC Fruits and Vegetables Juice Industry Revenue (Million) Forecast, by Application 2019 & 2032
- Table 49: Saudi Arabia APAC Fruits and Vegetables Juice Industry Revenue (Million) Forecast, by Application 2019 & 2032
- Table 50: South Africa APAC Fruits and Vegetables Juice Industry Revenue (Million) Forecast, by Application 2019 & 2032
- Table 51: Rest of Middle East and Africa APAC Fruits and Vegetables Juice Industry Revenue (Million) Forecast, by Application 2019 & 2032
- Table 52: Global APAC Fruits and Vegetables Juice Industry Revenue Million Forecast, by Category 2019 & 2032
- Table 53: Global APAC Fruits and Vegetables Juice Industry Revenue Million Forecast, by Type 2019 & 2032
- Table 54: Global APAC Fruits and Vegetables Juice Industry Revenue Million Forecast, by Distribution Channel 2019 & 2032
- Table 55: Global APAC Fruits and Vegetables Juice Industry Revenue Million Forecast, by Geography 2019 & 2032
- Table 56: Global APAC Fruits and Vegetables Juice Industry Revenue Million Forecast, by Country 2019 & 2032
- Table 57: Global APAC Fruits and Vegetables Juice Industry Revenue Million Forecast, by Category 2019 & 2032
- Table 58: Global APAC Fruits and Vegetables Juice Industry Revenue Million Forecast, by Type 2019 & 2032
- Table 59: Global APAC Fruits and Vegetables Juice Industry Revenue Million Forecast, by Distribution Channel 2019 & 2032
- Table 60: Global APAC Fruits and Vegetables Juice Industry Revenue Million Forecast, by Geography 2019 & 2032
- Table 61: Global APAC Fruits and Vegetables Juice Industry Revenue Million Forecast, by Country 2019 & 2032
- Table 62: Global APAC Fruits and Vegetables Juice Industry Revenue Million Forecast, by Category 2019 & 2032
- Table 63: Global APAC Fruits and Vegetables Juice Industry Revenue Million Forecast, by Type 2019 & 2032
- Table 64: Global APAC Fruits and Vegetables Juice Industry Revenue Million Forecast, by Distribution Channel 2019 & 2032
- Table 65: Global APAC Fruits and Vegetables Juice Industry Revenue Million Forecast, by Geography 2019 & 2032
- Table 66: Global APAC Fruits and Vegetables Juice Industry Revenue Million Forecast, by Country 2019 & 2032
- Table 67: Global APAC Fruits and Vegetables Juice Industry Revenue Million Forecast, by Category 2019 & 2032
- Table 68: Global APAC Fruits and Vegetables Juice Industry Revenue Million Forecast, by Type 2019 & 2032
- Table 69: Global APAC Fruits and Vegetables Juice Industry Revenue Million Forecast, by Distribution Channel 2019 & 2032
- Table 70: Global APAC Fruits and Vegetables Juice Industry Revenue Million Forecast, by Geography 2019 & 2032
- Table 71: Global APAC Fruits and Vegetables Juice Industry Revenue Million Forecast, by Country 2019 & 2032
- Table 72: Global APAC Fruits and Vegetables Juice Industry Revenue Million Forecast, by Category 2019 & 2032
- Table 73: Global APAC Fruits and Vegetables Juice Industry Revenue Million Forecast, by Type 2019 & 2032
- Table 74: Global APAC Fruits and Vegetables Juice Industry Revenue Million Forecast, by Distribution Channel 2019 & 2032
- Table 75: Global APAC Fruits and Vegetables Juice Industry Revenue Million Forecast, by Geography 2019 & 2032
- Table 76: Global APAC Fruits and Vegetables Juice Industry Revenue Million Forecast, by Country 2019 & 2032
Frequently Asked Questions
1. What is the projected Compound Annual Growth Rate (CAGR) of the APAC Fruits and Vegetables Juice Industry?
The projected CAGR is approximately 4.00%.
2. Which companies are prominent players in the APAC Fruits and Vegetables Juice Industry?
Key companies in the market include Dabur India Ltd, Huiyuan Group Co Ltd, PepsiCo Inc, Raw Pressery Private Limited, Fresh Del Monte Produce Incorporated*List Not Exhaustive, Citropak Limited, The Coca-Cola Company, The Juice Brothers Co, ITC Limited, Patanjali Ayurved Limited.
3. What are the main segments of the APAC Fruits and Vegetables Juice Industry?
The market segments include Category, Type, Distribution Channel, Geography.
4. Can you provide details about the market size?
The market size is estimated to be USD 28.06 Million as of 2022.
5. What are some drivers contributing to market growth?
Increasing Health Consciousness Among Consumers; Increasing Demand for Vegan Food Products.
6. What are the notable trends driving market growth?
Growing Demand for Organic Beverages.
7. Are there any restraints impacting market growth?
Poor Supply Chain.
8. Can you provide examples of recent developments in the market?
Nov 2022: Tetra Pak introduced the first ever Tetra Stelo Aseptic Package in India with The Minute Maid Juice Range of Coca-Cola in India.
9. What pricing options are available for accessing the report?
Pricing options include single-user, multi-user, and enterprise licenses priced at USD 4750, USD 5250, and USD 8750 respectively.
10. Is the market size provided in terms of value or volume?
The market size is provided in terms of value, measured in Million.
11. Are there any specific market keywords associated with the report?
Yes, the market keyword associated with the report is "APAC Fruits and Vegetables Juice Industry," which aids in identifying and referencing the specific market segment covered.
12. How do I determine which pricing option suits my needs best?
The pricing options vary based on user requirements and access needs. Individual users may opt for single-user licenses, while businesses requiring broader access may choose multi-user or enterprise licenses for cost-effective access to the report.
13. Are there any additional resources or data provided in the APAC Fruits and Vegetables Juice Industry report?
While the report offers comprehensive insights, it's advisable to review the specific contents or supplementary materials provided to ascertain if additional resources or data are available.
14. How can I stay updated on further developments or reports in the APAC Fruits and Vegetables Juice Industry?
To stay informed about further developments, trends, and reports in the APAC Fruits and Vegetables Juice Industry, consider subscribing to industry newsletters, following relevant companies and organizations, or regularly checking reputable industry news sources and publications.
Methodology
Step 1 - Identification of Relevant Samples Size from Population Database


Step 2 - Approaches for Defining Global Market Size (Value, Volume* & Price*)

Note*: In applicable scenarios
Step 3 - Data Sources
Primary Research
- Web Analytics
- Survey Reports
- Research Institute
- Latest Research Reports
- Opinion Leaders
Secondary Research
- Annual Reports
- White Paper
- Latest Press Release
- Industry Association
- Paid Database
- Investor Presentations

Step 4 - Data Triangulation
Involves using different sources of information in order to increase the validity of a study
These sources are likely to be stakeholders in a program - participants, other researchers, program staff, other community members, and so on.
Then we put all data in single framework & apply various statistical tools to find out the dynamic on the market.
During the analysis stage, feedback from the stakeholder groups would be compared to determine areas of agreement as well as areas of divergence
