

Key Insights
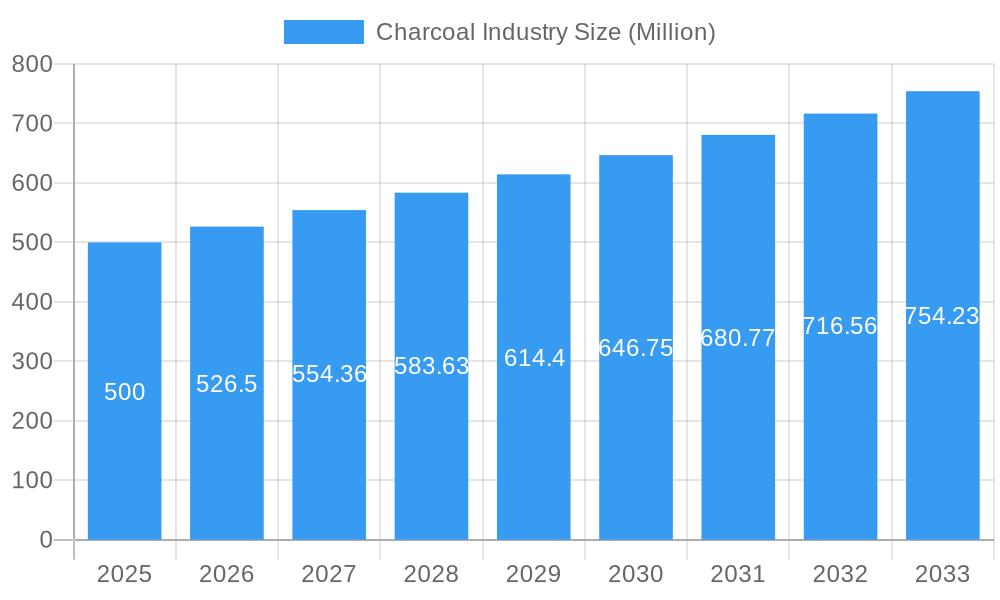
The global activated charcoal market, valued at approximately 73.15 million in the base year of 2025, is poised for substantial expansion. This growth is propelled by heightened consumer awareness of activated charcoal's health benefits and its multifaceted applications. The market is projected to grow at a Compound Annual Growth Rate (CAGR) of 4.12%, indicating a significant upward trajectory. Key growth drivers include the increasing adoption of natural health solutions and detox products, alongside the expanding use of activated charcoal across diverse sectors such as food and beverage, water purification, and cosmetics. Segmentation analysis highlights a preference for capsule and tablet formulations, with pharmacies and drug stores as primary distribution channels. The online retail segment, however, is emerging as a significant growth area, reflecting evolving consumer purchasing patterns. Geographically, while North America and Europe currently lead, the Asia Pacific region is anticipated to be a major contributor to future market expansion.
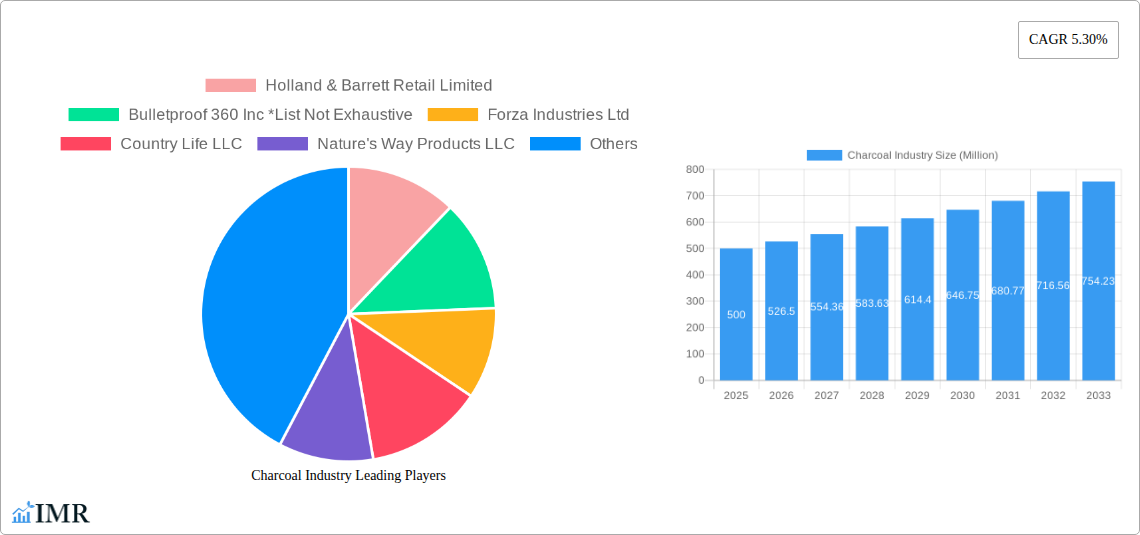
Charcoal Industry Market Size (In Million)
The competitive environment comprises both established market leaders and innovative emerging brands, suggesting a dynamic landscape with opportunities for various business models. Strategies focusing on product differentiation, including specialized formulations for specific health needs, and the exploration of novel applications in areas like environmental remediation, will be critical for sustained success. Strategic partnerships between industry stakeholders and research bodies are expected to foster market evolution and address potential challenges. Continuous consumer education regarding the advantages and appropriate use of activated charcoal remains essential for market development. The projected growth underscores a positive outlook for the activated charcoal market, presenting opportunities for innovation and market penetration across diverse geographies and applications.
Charcoal Industry Company Market Share
Charcoal Industry Market Report: 2019-2033
This comprehensive report provides a deep dive into the global charcoal industry, offering invaluable insights for industry professionals, investors, and strategic decision-makers. Spanning the period 2019-2033, with a base year of 2025 and a forecast period of 2025-2033, this analysis utilizes extensive primary and secondary research to deliver a precise and actionable understanding of this dynamic market. The report segments the market by form (capsules, tablets) and distribution channel (pharmacies & drug stores, supermarket/hypermarket, online retailers, other distribution channels), providing granular details on market size, growth trends, and key players. The total market value is predicted to reach xx Million by 2033.
Charcoal Industry Market Dynamics & Structure
This section analyzes the competitive landscape, technological advancements, regulatory influences, and market trends within the charcoal industry. The market is characterized by a moderately concentrated structure, with several key players holding significant market share. However, the entry of smaller, specialized companies is increasing competition. Technological innovation is primarily focused on enhancing product purity, bioavailability, and efficacy. Regulatory frameworks vary across geographies, impacting market access and product development. Substitutes, such as activated carbon products, present ongoing competitive pressure. The end-user demographics are diverse, encompassing health-conscious consumers, athletes, and individuals seeking natural health solutions. M&A activity in the sector remains moderate, with xx deals recorded in the historical period (2019-2024).
- Market Concentration: Moderately concentrated, with top 5 players holding approximately xx% market share in 2025.
- Technological Innovation: Focus on improved purification methods and enhanced bioavailability.
- Regulatory Framework: Varies by region, impacting product registration and marketing claims.
- Competitive Substitutes: Activated carbon products and other dietary supplements.
- End-User Demographics: Health-conscious consumers, athletes, and individuals seeking natural remedies.
- M&A Activity: xx deals recorded between 2019-2024, indicating moderate consolidation.
Charcoal Industry Growth Trends & Insights
The charcoal industry exhibits robust growth, driven by increasing consumer awareness of its health benefits and expanding applications. The market size experienced a CAGR of xx% during the historical period (2019-2024), reaching xx Million in 2024. This upward trajectory is expected to continue, with a projected CAGR of xx% during the forecast period (2025-2033), reaching xx Million by 2033. Market penetration is highest in developed regions, but significant growth potential exists in emerging economies. Technological advancements, particularly in production methods and formulation, are fueling adoption rates. Shifting consumer preferences towards natural and holistic health solutions further boost market growth. The increasing prevalence of chronic diseases and rising disposable incomes also contribute significantly to market expansion.
Dominant Regions, Countries, or Segments in Charcoal Industry
North America currently dominates the charcoal industry, accounting for approximately xx% of the global market in 2025. This dominance stems from high consumer awareness, robust regulatory frameworks, and strong retail infrastructure. Within the segments, the capsules segment holds the largest market share due to its convenient dosage form. Pharmacies and drug stores represent the largest distribution channel, reflecting consumers' preference for purchasing dietary supplements from trusted retailers. However, the online retail channel is experiencing the fastest growth due to increased e-commerce penetration.
- Key Drivers in North America: High consumer health consciousness, strong retail infrastructure, and established regulatory frameworks.
- Capsules Segment Dominance: Convenience and ease of consumption contribute to its market leadership.
- Pharmacies & Drug Stores Channel: Consumer trust and established distribution networks drive market share.
- Online Retail Growth: Rapid e-commerce adoption fuels significant growth potential.
Charcoal Industry Product Landscape
The charcoal industry offers a diverse range of products, primarily categorized by form (capsules, tablets, powders) and application (digestive health, detoxification, beauty). Product innovations focus on enhancing absorption rates, improving taste and texture, and incorporating additional functional ingredients. Key performance metrics include purity levels, particle size, and surface area, all impacting product efficacy. Unique selling propositions often highlight specific manufacturing processes, sourcing of raw materials, or scientific backing for claimed health benefits.
Key Drivers, Barriers & Challenges in Charcoal Industry
Key Drivers:
- Rising consumer awareness of health benefits
- Growing demand for natural and holistic health solutions
- Increasing prevalence of chronic diseases
- Technological advancements in production and formulation
Key Challenges:
- Fluctuations in raw material prices
- Stringent regulatory requirements in certain regions
- Intense competition from substitute products
- Ensuring product quality and purity consistency
Emerging Opportunities in Charcoal Industry
Emerging opportunities include expanding into untapped markets (e.g., developing economies), developing innovative applications (e.g., personal care, pet supplements), and catering to evolving consumer preferences (e.g., personalized formulations). The focus on sustainable sourcing and eco-friendly packaging presents another avenue for growth. Furthermore, collaborations with researchers and healthcare professionals can enhance product credibility and market penetration.
Growth Accelerators in the Charcoal Industry Industry
Technological advancements in purification and processing techniques, strategic partnerships with leading retailers and distributors, and targeted marketing campaigns focusing on specific health benefits are key growth catalysts. Expanding product lines to cater to diverse consumer needs and investing in research and development to validate product efficacy will also fuel industry expansion. The growing trend towards personalized medicine will create opportunities for tailor-made charcoal products.
Key Players Shaping the Charcoal Industry Market
- Holland & Barrett Retail Limited
- Bulletproof 360 Inc
- Forza Industries Ltd
- Country Life LLC
- Nature's Way Products LLC
- Swanson
- Schizandu Organics
- Sona
Notable Milestones in Charcoal Industry Sector
- 2020: Increased regulatory scrutiny on marketing claims for charcoal products.
- 2021: Launch of several new charcoal-based skincare products.
- 2022: Significant investment in research on the efficacy of charcoal in various health applications.
- 2023: Merger between two prominent charcoal supplement manufacturers.
In-Depth Charcoal Industry Market Outlook
The charcoal industry is poised for continued growth, driven by sustained consumer demand and technological innovation. Strategic opportunities lie in expanding into new geographic markets, developing innovative product formulations, and strengthening partnerships with key players in the healthcare industry. The focus on product quality, safety, and efficacy will be paramount in shaping the future of this market. The market's continued growth trajectory presents attractive prospects for investment and expansion.
Charcoal Industry Segmentation
-
1. Form
- 1.1. Capsules
- 1.2. Tablets
-
2. Distribution Channel
- 2.1. Pharmacies & Drug Stores
- 2.2. Supermarket/Hypermarket
- 2.3. Online Retailers
- 2.4. Other Distribution Channels
Charcoal Industry Segmentation By Geography
-
1. North America
- 1.1. United States
- 1.2. Canada
- 1.3. Mexico
- 1.4. Rest of North America
-
2. Europe
- 2.1. Spain
- 2.2. United Kingdom
- 2.3. Germany
- 2.4. France
- 2.5. Italy
- 2.6. Russia
- 2.7. Rest of Europe
-
3. Asia Pacific
- 3.1. China
- 3.2. Japan
- 3.3. India
- 3.4. Australia
- 3.5. Rest of Asia Pacific
-
4. South America
- 4.1. Brazil
- 4.2. Argentina
- 4.3. Rest of South America
-
5. Middle East and Africa
- 5.1. South Africa
- 5.2. Saudi Arabia
- 5.3. Rest of Middle East and Africa

Charcoal Industry Regional Market Share
Geographic Coverage of Charcoal Industry
Charcoal Industry REPORT HIGHLIGHTS
| Aspects | Details |
|---|---|
| Study Period | 2020-2034 |
| Base Year | 2025 |
| Estimated Year | 2026 |
| Forecast Period | 2026-2034 |
| Historical Period | 2020-2025 |
| Growth Rate | CAGR of 4.12% from 2020-2034 |
| Segmentation |
|
Table of Contents
- 1. Introduction
- 1.1. Research Scope
- 1.2. Market Segmentation
- 1.3. Research Objective
- 1.4. Definitions and Assumptions
- 2. Executive Summary
- 2.1. Market Snapshot
- 3. Market Dynamics
- 3.1. Market Drivers
- 3.2. Market Restrains
- 3.3. Market Trends
- 3.4. Market Opportunities
- 4. Market Factor Analysis
- 4.1. Porters Five Forces
- 4.1.1. Bargaining Power of Suppliers
- 4.1.2. Bargaining Power of Buyers
- 4.1.3. Threat of New Entrants
- 4.1.4. Threat of Substitutes
- 4.1.5. Competitive Rivalry
- 4.2. PESTEL analysis
- 4.3. BCG Analysis
- 4.3.1. Stars (High Growth, High Market Share)
- 4.3.2. Cash Cows (Low Growth, High Market Share)
- 4.3.3. Question Mark (High Growth, Low Market Share)
- 4.3.4. Dogs (Low Growth, Low Market Share)
- 4.4. Ansoff Matrix Analysis
- 4.5. Supply Chain Analysis
- 4.6. Regulatory Landscape
- 4.7. Current Market Potential and Opportunity Assessment (TAM–SAM–SOM Framework)
- 4.8. IMR Analyst Note
- 4.1. Porters Five Forces
- 5. Market Analysis, Insights and Forecast 2021-2033
- 5.1. Market Analysis, Insights and Forecast - by Form
- 5.1.1. Capsules
- 5.1.2. Tablets
- 5.2. Market Analysis, Insights and Forecast - by Distribution Channel
- 5.2.1. Pharmacies & Drug Stores
- 5.2.2. Supermarket/Hypermarket
- 5.2.3. Online Retailers
- 5.2.4. Other Distribution Channels
- 5.3. Market Analysis, Insights and Forecast - by Region
- 5.3.1. North America
- 5.3.2. Europe
- 5.3.3. Asia Pacific
- 5.3.4. South America
- 5.3.5. Middle East and Africa
- 5.1. Market Analysis, Insights and Forecast - by Form
- 6. Global Charcoal Industry Analysis, Insights and Forecast, 2021-2033
- 6.1. Market Analysis, Insights and Forecast - by Form
- 6.1.1. Capsules
- 6.1.2. Tablets
- 6.2. Market Analysis, Insights and Forecast - by Distribution Channel
- 6.2.1. Pharmacies & Drug Stores
- 6.2.2. Supermarket/Hypermarket
- 6.2.3. Online Retailers
- 6.2.4. Other Distribution Channels
- 6.1. Market Analysis, Insights and Forecast - by Form
- 7. North America Charcoal Industry Analysis, Insights and Forecast, 2020-2032
- 7.1. Market Analysis, Insights and Forecast - by Form
- 7.1.1. Capsules
- 7.1.2. Tablets
- 7.2. Market Analysis, Insights and Forecast - by Distribution Channel
- 7.2.1. Pharmacies & Drug Stores
- 7.2.2. Supermarket/Hypermarket
- 7.2.3. Online Retailers
- 7.2.4. Other Distribution Channels
- 7.1. Market Analysis, Insights and Forecast - by Form
- 8. Europe Charcoal Industry Analysis, Insights and Forecast, 2020-2032
- 8.1. Market Analysis, Insights and Forecast - by Form
- 8.1.1. Capsules
- 8.1.2. Tablets
- 8.2. Market Analysis, Insights and Forecast - by Distribution Channel
- 8.2.1. Pharmacies & Drug Stores
- 8.2.2. Supermarket/Hypermarket
- 8.2.3. Online Retailers
- 8.2.4. Other Distribution Channels
- 8.1. Market Analysis, Insights and Forecast - by Form
- 9. Asia Pacific Charcoal Industry Analysis, Insights and Forecast, 2020-2032
- 9.1. Market Analysis, Insights and Forecast - by Form
- 9.1.1. Capsules
- 9.1.2. Tablets
- 9.2. Market Analysis, Insights and Forecast - by Distribution Channel
- 9.2.1. Pharmacies & Drug Stores
- 9.2.2. Supermarket/Hypermarket
- 9.2.3. Online Retailers
- 9.2.4. Other Distribution Channels
- 9.1. Market Analysis, Insights and Forecast - by Form
- 10. South America Charcoal Industry Analysis, Insights and Forecast, 2020-2032
- 10.1. Market Analysis, Insights and Forecast - by Form
- 10.1.1. Capsules
- 10.1.2. Tablets
- 10.2. Market Analysis, Insights and Forecast - by Distribution Channel
- 10.2.1. Pharmacies & Drug Stores
- 10.2.2. Supermarket/Hypermarket
- 10.2.3. Online Retailers
- 10.2.4. Other Distribution Channels
- 10.1. Market Analysis, Insights and Forecast - by Form
- 11. Middle East and Africa Charcoal Industry Analysis, Insights and Forecast, 2020-2032
- 11.1. Market Analysis, Insights and Forecast - by Form
- 11.1.1. Capsules
- 11.1.2. Tablets
- 11.2. Market Analysis, Insights and Forecast - by Distribution Channel
- 11.2.1. Pharmacies & Drug Stores
- 11.2.2. Supermarket/Hypermarket
- 11.2.3. Online Retailers
- 11.2.4. Other Distribution Channels
- 11.1. Market Analysis, Insights and Forecast - by Form
- 12. Competitive Analysis
- 12.1. Company Profiles
- 12.1.1 Holland & Barrett Retail Limited
- 12.1.1.1. Company Overview
- 12.1.1.2. Products
- 12.1.1.3. Company Financials
- 12.1.1.4. SWOT Analysis
- 12.1.2 Bulletproof 360 Inc *List Not Exhaustive
- 12.1.2.1. Company Overview
- 12.1.2.2. Products
- 12.1.2.3. Company Financials
- 12.1.2.4. SWOT Analysis
- 12.1.3 Forza Industries Ltd
- 12.1.3.1. Company Overview
- 12.1.3.2. Products
- 12.1.3.3. Company Financials
- 12.1.3.4. SWOT Analysis
- 12.1.4 Country Life LLC
- 12.1.4.1. Company Overview
- 12.1.4.2. Products
- 12.1.4.3. Company Financials
- 12.1.4.4. SWOT Analysis
- 12.1.5 Nature's Way Products LLC
- 12.1.5.1. Company Overview
- 12.1.5.2. Products
- 12.1.5.3. Company Financials
- 12.1.5.4. SWOT Analysis
- 12.1.6 Swanson
- 12.1.6.1. Company Overview
- 12.1.6.2. Products
- 12.1.6.3. Company Financials
- 12.1.6.4. SWOT Analysis
- 12.1.7 Schizandu Organics
- 12.1.7.1. Company Overview
- 12.1.7.2. Products
- 12.1.7.3. Company Financials
- 12.1.7.4. SWOT Analysis
- 12.1.8 Sona
- 12.1.8.1. Company Overview
- 12.1.8.2. Products
- 12.1.8.3. Company Financials
- 12.1.8.4. SWOT Analysis
- 12.1.1 Holland & Barrett Retail Limited
- 12.2. Market Entropy
- 12.2.1 Company's Key Areas Served
- 12.2.2 Recent Developments
- 12.3. Company Market Share Analysis 2025
- 12.3.1 Top 5 Companies Market Share Analysis
- 12.3.2 Top 3 Companies Market Share Analysis
- 12.4. List of Potential Customers
- 13. Research Methodology
List of Figures
- Figure 1: Global Charcoal Industry Revenue Breakdown (million, %) by Region 2025 & 2033
- Figure 2: North America Charcoal Industry Revenue (million), by Form 2025 & 2033
- Figure 3: North America Charcoal Industry Revenue Share (%), by Form 2025 & 2033
- Figure 4: North America Charcoal Industry Revenue (million), by Distribution Channel 2025 & 2033
- Figure 5: North America Charcoal Industry Revenue Share (%), by Distribution Channel 2025 & 2033
- Figure 6: North America Charcoal Industry Revenue (million), by Country 2025 & 2033
- Figure 7: North America Charcoal Industry Revenue Share (%), by Country 2025 & 2033
- Figure 8: Europe Charcoal Industry Revenue (million), by Form 2025 & 2033
- Figure 9: Europe Charcoal Industry Revenue Share (%), by Form 2025 & 2033
- Figure 10: Europe Charcoal Industry Revenue (million), by Distribution Channel 2025 & 2033
- Figure 11: Europe Charcoal Industry Revenue Share (%), by Distribution Channel 2025 & 2033
- Figure 12: Europe Charcoal Industry Revenue (million), by Country 2025 & 2033
- Figure 13: Europe Charcoal Industry Revenue Share (%), by Country 2025 & 2033
- Figure 14: Asia Pacific Charcoal Industry Revenue (million), by Form 2025 & 2033
- Figure 15: Asia Pacific Charcoal Industry Revenue Share (%), by Form 2025 & 2033
- Figure 16: Asia Pacific Charcoal Industry Revenue (million), by Distribution Channel 2025 & 2033
- Figure 17: Asia Pacific Charcoal Industry Revenue Share (%), by Distribution Channel 2025 & 2033
- Figure 18: Asia Pacific Charcoal Industry Revenue (million), by Country 2025 & 2033
- Figure 19: Asia Pacific Charcoal Industry Revenue Share (%), by Country 2025 & 2033
- Figure 20: South America Charcoal Industry Revenue (million), by Form 2025 & 2033
- Figure 21: South America Charcoal Industry Revenue Share (%), by Form 2025 & 2033
- Figure 22: South America Charcoal Industry Revenue (million), by Distribution Channel 2025 & 2033
- Figure 23: South America Charcoal Industry Revenue Share (%), by Distribution Channel 2025 & 2033
- Figure 24: South America Charcoal Industry Revenue (million), by Country 2025 & 2033
- Figure 25: South America Charcoal Industry Revenue Share (%), by Country 2025 & 2033
- Figure 26: Middle East and Africa Charcoal Industry Revenue (million), by Form 2025 & 2033
- Figure 27: Middle East and Africa Charcoal Industry Revenue Share (%), by Form 2025 & 2033
- Figure 28: Middle East and Africa Charcoal Industry Revenue (million), by Distribution Channel 2025 & 2033
- Figure 29: Middle East and Africa Charcoal Industry Revenue Share (%), by Distribution Channel 2025 & 2033
- Figure 30: Middle East and Africa Charcoal Industry Revenue (million), by Country 2025 & 2033
- Figure 31: Middle East and Africa Charcoal Industry Revenue Share (%), by Country 2025 & 2033
List of Tables
- Table 1: Global Charcoal Industry Revenue million Forecast, by Form 2020 & 2033
- Table 2: Global Charcoal Industry Revenue million Forecast, by Distribution Channel 2020 & 2033
- Table 3: Global Charcoal Industry Revenue million Forecast, by Region 2020 & 2033
- Table 4: Global Charcoal Industry Revenue million Forecast, by Form 2020 & 2033
- Table 5: Global Charcoal Industry Revenue million Forecast, by Distribution Channel 2020 & 2033
- Table 6: Global Charcoal Industry Revenue million Forecast, by Country 2020 & 2033
- Table 7: United States Charcoal Industry Revenue (million) Forecast, by Application 2020 & 2033
- Table 8: Canada Charcoal Industry Revenue (million) Forecast, by Application 2020 & 2033
- Table 9: Mexico Charcoal Industry Revenue (million) Forecast, by Application 2020 & 2033
- Table 10: Rest of North America Charcoal Industry Revenue (million) Forecast, by Application 2020 & 2033
- Table 11: Global Charcoal Industry Revenue million Forecast, by Form 2020 & 2033
- Table 12: Global Charcoal Industry Revenue million Forecast, by Distribution Channel 2020 & 2033
- Table 13: Global Charcoal Industry Revenue million Forecast, by Country 2020 & 2033
- Table 14: Spain Charcoal Industry Revenue (million) Forecast, by Application 2020 & 2033
- Table 15: United Kingdom Charcoal Industry Revenue (million) Forecast, by Application 2020 & 2033
- Table 16: Germany Charcoal Industry Revenue (million) Forecast, by Application 2020 & 2033
- Table 17: France Charcoal Industry Revenue (million) Forecast, by Application 2020 & 2033
- Table 18: Italy Charcoal Industry Revenue (million) Forecast, by Application 2020 & 2033
- Table 19: Russia Charcoal Industry Revenue (million) Forecast, by Application 2020 & 2033
- Table 20: Rest of Europe Charcoal Industry Revenue (million) Forecast, by Application 2020 & 2033
- Table 21: Global Charcoal Industry Revenue million Forecast, by Form 2020 & 2033
- Table 22: Global Charcoal Industry Revenue million Forecast, by Distribution Channel 2020 & 2033
- Table 23: Global Charcoal Industry Revenue million Forecast, by Country 2020 & 2033
- Table 24: China Charcoal Industry Revenue (million) Forecast, by Application 2020 & 2033
- Table 25: Japan Charcoal Industry Revenue (million) Forecast, by Application 2020 & 2033
- Table 26: India Charcoal Industry Revenue (million) Forecast, by Application 2020 & 2033
- Table 27: Australia Charcoal Industry Revenue (million) Forecast, by Application 2020 & 2033
- Table 28: Rest of Asia Pacific Charcoal Industry Revenue (million) Forecast, by Application 2020 & 2033
- Table 29: Global Charcoal Industry Revenue million Forecast, by Form 2020 & 2033
- Table 30: Global Charcoal Industry Revenue million Forecast, by Distribution Channel 2020 & 2033
- Table 31: Global Charcoal Industry Revenue million Forecast, by Country 2020 & 2033
- Table 32: Brazil Charcoal Industry Revenue (million) Forecast, by Application 2020 & 2033
- Table 33: Argentina Charcoal Industry Revenue (million) Forecast, by Application 2020 & 2033
- Table 34: Rest of South America Charcoal Industry Revenue (million) Forecast, by Application 2020 & 2033
- Table 35: Global Charcoal Industry Revenue million Forecast, by Form 2020 & 2033
- Table 36: Global Charcoal Industry Revenue million Forecast, by Distribution Channel 2020 & 2033
- Table 37: Global Charcoal Industry Revenue million Forecast, by Country 2020 & 2033
- Table 38: South Africa Charcoal Industry Revenue (million) Forecast, by Application 2020 & 2033
- Table 39: Saudi Arabia Charcoal Industry Revenue (million) Forecast, by Application 2020 & 2033
- Table 40: Rest of Middle East and Africa Charcoal Industry Revenue (million) Forecast, by Application 2020 & 2033
Frequently Asked Questions
1. What is the projected Compound Annual Growth Rate (CAGR) of the Charcoal Industry?
The projected CAGR is approximately 4.12%.
2. Which companies are prominent players in the Charcoal Industry?
Key companies in the market include Holland & Barrett Retail Limited, Bulletproof 360 Inc *List Not Exhaustive, Forza Industries Ltd, Country Life LLC, Nature's Way Products LLC, Swanson, Schizandu Organics, Sona.
3. What are the main segments of the Charcoal Industry?
The market segments include Form, Distribution Channel.
4. Can you provide details about the market size?
The market size is estimated to be USD 73.15 million as of 2022.
5. What are some drivers contributing to market growth?
Health Benefits Promoting Apple Cider Vinegar Demand; Unfiltered Apple Cider Vinegar Being Popular.
6. What are the notable trends driving market growth?
Rising Demand For Detoxifying Substances.
7. Are there any restraints impacting market growth?
Rising Demand for Other Vinegar Types.
8. Can you provide examples of recent developments in the market?
N/A
9. What pricing options are available for accessing the report?
Pricing options include single-user, multi-user, and enterprise licenses priced at USD 4750, USD 5250, and USD 8750 respectively.
10. Is the market size provided in terms of value or volume?
The market size is provided in terms of value, measured in million.
11. Are there any specific market keywords associated with the report?
Yes, the market keyword associated with the report is "Charcoal Industry," which aids in identifying and referencing the specific market segment covered.
12. How do I determine which pricing option suits my needs best?
The pricing options vary based on user requirements and access needs. Individual users may opt for single-user licenses, while businesses requiring broader access may choose multi-user or enterprise licenses for cost-effective access to the report.
13. Are there any additional resources or data provided in the Charcoal Industry report?
While the report offers comprehensive insights, it's advisable to review the specific contents or supplementary materials provided to ascertain if additional resources or data are available.
14. How can I stay updated on further developments or reports in the Charcoal Industry?
To stay informed about further developments, trends, and reports in the Charcoal Industry, consider subscribing to industry newsletters, following relevant companies and organizations, or regularly checking reputable industry news sources and publications.
Methodology
Step 1 - Identification of Relevant Samples Size from Population Database


Step 2 - Approaches for Defining Global Market Size (Value, Volume* & Price*)

Note*: In applicable scenarios
Step 3 - Data Sources
Primary Research
- Web Analytics
- Survey Reports
- Research Institute
- Latest Research Reports
- Opinion Leaders
Secondary Research
- Annual Reports
- White Paper
- Latest Press Release
- Industry Association
- Paid Database
- Investor Presentations

Step 4 - Data Triangulation
Involves using different sources of information in order to increase the validity of a study
These sources are likely to be stakeholders in a program - participants, other researchers, program staff, other community members, and so on.
Then we put all data in single framework & apply various statistical tools to find out the dynamic on the market.
During the analysis stage, feedback from the stakeholder groups would be compared to determine areas of agreement as well as areas of divergence