

Key Insights
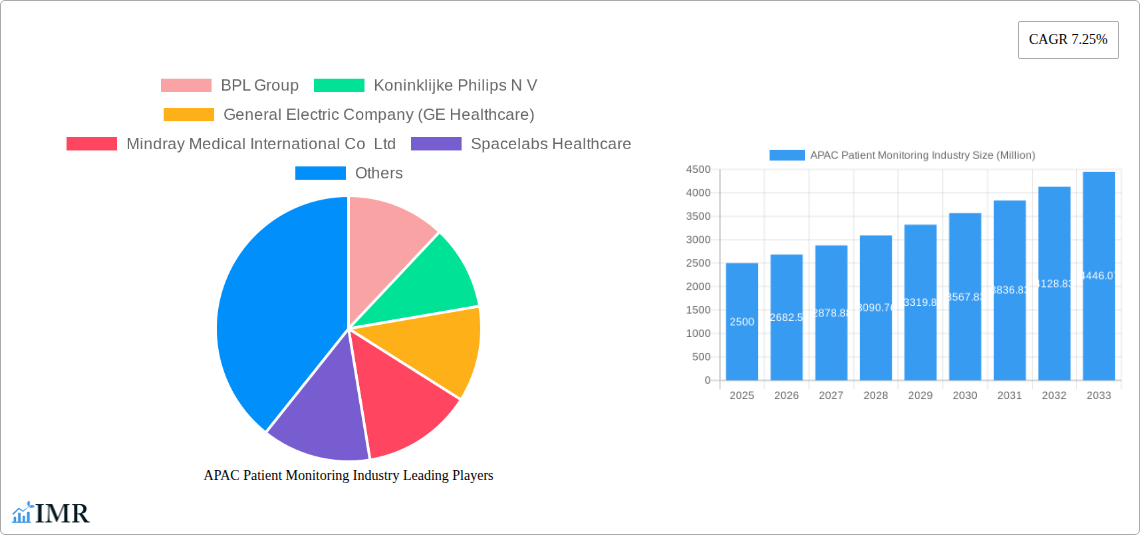
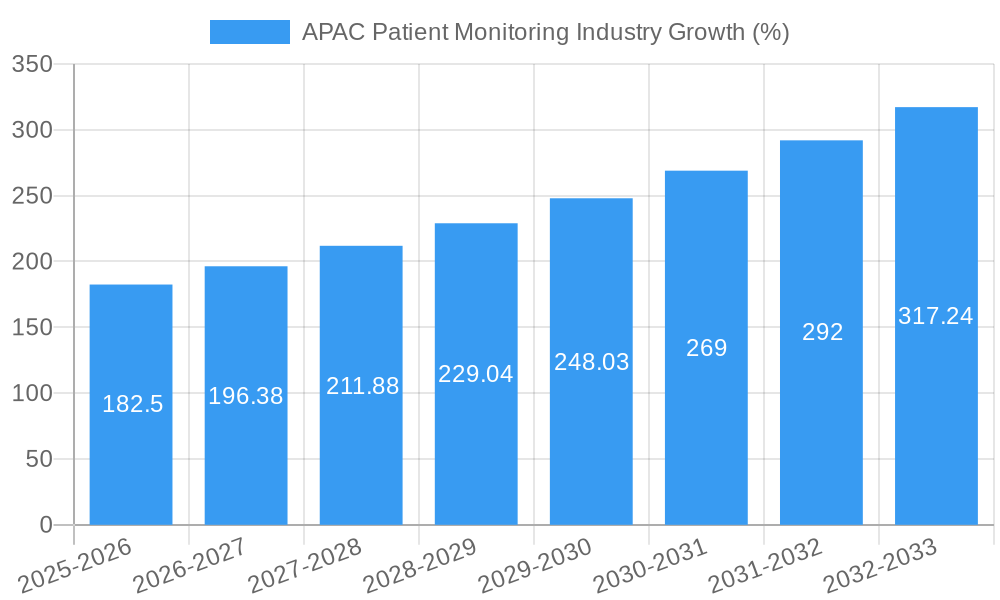
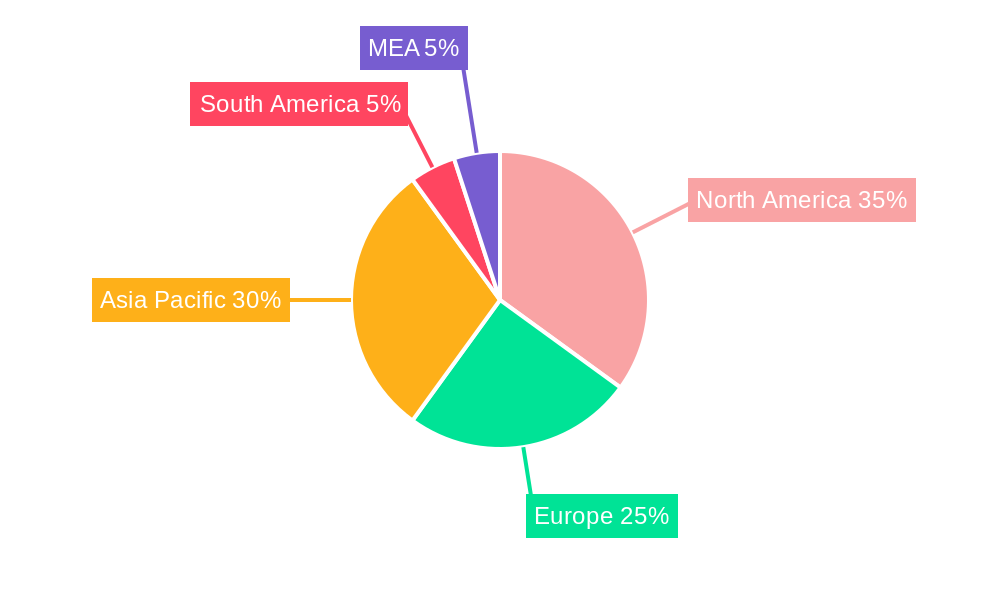
The Asia-Pacific (APAC) patient monitoring market, valued at approximately $2.5 billion in 2025, is poised for significant growth, driven by factors such as rising prevalence of chronic diseases, an aging population, increasing healthcare expenditure, and advancements in medical technology. The region's diverse healthcare infrastructure, however, presents both opportunities and challenges. While developed economies like Japan, South Korea, and Australia boast advanced healthcare systems and higher adoption rates of sophisticated monitoring devices, emerging markets like India and Southeast Asia exhibit substantial growth potential fueled by increasing affordability and expanding access to healthcare. This presents a compelling opportunity for manufacturers to tailor their product offerings to the specific needs and budgetary constraints of each sub-region. The growth is further propelled by the increasing adoption of remote patient monitoring (RPM) technologies, enabling cost-effective and convenient healthcare delivery, especially in geographically dispersed populations. Growth in the hospital and clinic segment will remain robust, due to the increasing number of hospitals and clinics along with improvements in healthcare infrastructure. The home healthcare segment is also expected to see substantial growth due to the rising preference for home-based care and technological advancements enabling remote monitoring.
Competition in the APAC patient monitoring market is intense, with both global and regional players vying for market share. Established players like Philips, GE Healthcare, and Nihon Kohden benefit from strong brand recognition and extensive distribution networks. However, the market is also witnessing the emergence of several local players who are leveraging cost advantages and localized expertise to gain market share. Future growth will depend on several factors, including regulatory approvals for new technologies, advancements in artificial intelligence (AI) and machine learning (ML) for improved diagnostics, and the successful integration of patient monitoring devices into broader healthcare IT ecosystems. Sustained investment in research and development, coupled with strategic partnerships and acquisitions, will be crucial for companies seeking to thrive in this dynamic and competitive landscape.
APAC Patient Monitoring Industry: A Comprehensive Market Report (2019-2033)
This comprehensive report provides an in-depth analysis of the Asia-Pacific (APAC) patient monitoring industry, covering market dynamics, growth trends, key players, and future opportunities. The report utilizes data from 2019-2024 (Historical Period), with the base year set at 2025 and a forecast period extending to 2033 (Forecast Period: 2025-2033). The APAC patient monitoring market is segmented by end-user (Home Healthcare, Hospitals and Clinics, Other End-Users), device type (Hemodynamic Monitoring Devices, Neuromonitoring Devices, Cardiac Monitoring Devices, Multi-parameter Monitors, Respiratory Monitoring Devices, Remote Patient Monitoring Devices, Other Types of Devices), and application (Cardiology, Neurology, Respiratory, Fetal and Neonatal, Weight Management and Fitness Monitoring, Other Applications). The market size is valued in million units.
APAC Patient Monitoring Industry Market Dynamics & Structure
The APAC patient monitoring market is experiencing significant growth, driven by factors such as rising prevalence of chronic diseases, increasing geriatric population, technological advancements, and expanding healthcare infrastructure. Market concentration is moderately high, with several multinational corporations and regional players competing for market share. Technological innovation, particularly in remote patient monitoring (RPM) and artificial intelligence (AI)-powered devices, is a key driver. Regulatory frameworks vary across APAC countries, impacting market entry and product approvals. Competitive product substitutes are limited, with most advancements focusing on improving existing technologies.
- Market Concentration: Moderately high, with top 10 players holding approximately xx% market share in 2024.
- Technological Innovation: Strong focus on AI, cloud computing, and miniaturization.
- Regulatory Frameworks: Vary significantly across countries, creating challenges for standardization.
- M&A Activity: xx deals recorded between 2019-2024, primarily focused on expanding product portfolios and geographical reach.
- End-User Demographics: Aging population and rising prevalence of chronic diseases are key drivers.
APAC Patient Monitoring Industry Growth Trends & Insights
The APAC patient monitoring market exhibited a CAGR of xx% during the historical period (2019-2024) and is projected to grow at a CAGR of xx% during the forecast period (2025-2033), reaching a market size of xx million units by 2033. This growth is primarily fueled by increasing adoption of advanced monitoring technologies in hospitals and clinics, coupled with the rising demand for home healthcare solutions. Technological disruptions, such as the integration of IoT and AI, are accelerating market penetration, particularly in RPM. Consumer behavior is shifting towards preference for remote monitoring and personalized healthcare solutions. The market is witnessing a higher adoption rate in developed economies like Japan, Australia and South Korea and gradually expanding in the emerging markets of Southeast Asia and India.
Dominant Regions, Countries, or Segments in APAC Patient Monitoring Industry
Japan, China, and India are the leading markets in APAC for patient monitoring. The Hospitals and Clinics segment dominates the end-user market due to higher adoption rates in established healthcare facilities. Within device types, Cardiac Monitoring Devices and Multi-parameter Monitors hold the largest market share. Cardiology applications lead in terms of market demand.
- Key Drivers:
- Increasing healthcare expenditure
- Government initiatives to improve healthcare infrastructure
- Rising prevalence of cardiovascular diseases
- Favorable reimbursement policies for advanced monitoring technologies
- Dominance Factors:
- Strong healthcare infrastructure in developed economies
- Increasing government investments in healthcare in developing economies
- High prevalence of chronic diseases in several APAC countries
APAC Patient Monitoring Industry Product Landscape
The APAC patient monitoring market offers a diverse range of products, including sophisticated multi-parameter monitors, wireless RPM devices, and advanced neuromonitoring systems. Innovations focus on improved accuracy, portability, and connectivity. Key features include real-time data transmission, advanced analytics, and integration with electronic health records (EHR) systems. Unique selling propositions center on enhanced patient comfort, ease of use, and data-driven decision-making capabilities. Miniaturization and wearable technologies are gaining traction.
Key Drivers, Barriers & Challenges in APAC Patient Monitoring Industry
Key Drivers: Rising prevalence of chronic diseases like diabetes and cardiovascular disease, increasing demand for remote patient monitoring, technological advancements enabling more accurate and efficient monitoring, government support for healthcare infrastructure development, and growing awareness among patients.
Key Challenges: High initial investment costs for advanced equipment, regulatory hurdles for product approvals, variations in reimbursement policies across countries, data security concerns related to remote monitoring, and lack of skilled professionals to operate and interpret complex monitoring systems. Supply chain disruptions also pose a significant challenge, potentially impacting production and delivery timelines. The xx% increase in raw material costs during 2022-2023 directly affected production and profitability.
Emerging Opportunities in APAC Patient Monitoring Industry
Significant opportunities exist in expanding remote patient monitoring services to underserved populations, developing affordable and accessible patient monitoring solutions for low-resource settings, integrating AI and machine learning for predictive diagnostics, focusing on preventative care and wellness monitoring, and developing niche applications tailored for specific conditions like sleep apnea and diabetes management. The growing demand for home-based care presents a significant untapped market.
Growth Accelerators in the APAC Patient Monitoring Industry
Technological breakthroughs such as AI-driven diagnostics and advanced wireless connectivity are crucial growth accelerators. Strategic partnerships between technology providers, healthcare providers, and insurance companies are essential to improve market access and patient adoption. Expanding market penetration in emerging economies through government initiatives and focused marketing strategies are pivotal for long-term growth.
Key Players Shaping the APAC Patient Monitoring Market
- BPL Group
- Koninklijke Philips N V
- General Electric Company (GE Healthcare)
- Mindray Medical International Co Ltd
- Spacelabs Healthcare
- Nihon Kohden Corporation
- Dragerwerk AG
- Schiller
- Siemens Healthcare GmBH
Notable Milestones in APAC Patient Monitoring Industry Sector
- October 2022: Apollo Hospitals launched its indigenously developed automated, rapid-response patient monitoring system, boosting local innovation and potentially impacting market competition.
- March 2022: Wipro GE Healthcare launched a new manufacturing facility in Bengaluru, India, under the PLI scheme, signifying a push towards domestic manufacturing and potentially reducing reliance on imports.
In-Depth APAC Patient Monitoring Industry Market Outlook
The APAC patient monitoring market is poised for robust growth, driven by technological advancements, increasing healthcare spending, and a growing awareness of the benefits of preventative and remote care. Strategic opportunities exist for companies focused on developing innovative, cost-effective, and user-friendly solutions tailored to diverse market needs. The market's future potential is significant, especially in rapidly developing economies.
APAC Patient Monitoring Industry Segmentation
-
1. Type of Device
- 1.1. Hemodynamic Monitoring Devices
- 1.2. Neuromonitoring Devices
- 1.3. Cardiac Monitoring Devices
- 1.4. Multi-parameter Monitors
- 1.5. Respiratory Monitoring Devices
- 1.6. Remote Patient Monitoring Devices
- 1.7. Other Types of Devices
-
2. Application
- 2.1. Cardiology
- 2.2. Neurology
- 2.3. Respiratory
- 2.4. Fetal and Neonatal
- 2.5. Weight Management and Fitness Monitoring
- 2.6. Other Applications
-
3. End-Users
- 3.1. Home Healthcare
- 3.2. Hospitals and Clinics
- 3.3. Other End-Users
-
4. Geography
- 4.1. China
- 4.2. Japan
- 4.3. India
- 4.4. Australia
- 4.5. South Korea
- 4.6. Rest of Asia-Pacific
APAC Patient Monitoring Industry Segmentation By Geography
- 1. China
- 2. Japan
- 3. India
- 4. Australia
- 5. South Korea
- 6. Rest of Asia Pacific
APAC Patient Monitoring Industry REPORT HIGHLIGHTS
| Aspects | Details |
|---|---|
| Study Period | 2019-2033 |
| Base Year | 2024 |
| Estimated Year | 2025 |
| Forecast Period | 2025-2033 |
| Historical Period | 2019-2024 |
| Growth Rate | CAGR of 7.25% from 2019-2033 |
| Segmentation |
|
Table of Contents
- 1. Introduction
- 1.1. Research Scope
- 1.2. Market Segmentation
- 1.3. Research Methodology
- 1.4. Definitions and Assumptions
- 2. Executive Summary
- 2.1. Introduction
- 3. Market Dynamics
- 3.1. Introduction
- 3.2. Market Drivers
- 3.2.1. Rising Incidences of Chronic Diseases; Increasing Preference for Home and Remote Monitoring
- 3.3. Market Restrains
- 3.3.1. High Cost of Devices
- 3.4. Market Trends
- 3.4.1. Remote Patient Monitoring Devices is Expected to Show a Significant Growth Rate Over the Forecast Period
- 4. Market Factor Analysis
- 4.1. Porters Five Forces
- 4.2. Supply/Value Chain
- 4.3. PESTEL analysis
- 4.4. Market Entropy
- 4.5. Patent/Trademark Analysis
- 5. Global APAC Patient Monitoring Industry Analysis, Insights and Forecast, 2019-2031
- 5.1. Market Analysis, Insights and Forecast - by Type of Device
- 5.1.1. Hemodynamic Monitoring Devices
- 5.1.2. Neuromonitoring Devices
- 5.1.3. Cardiac Monitoring Devices
- 5.1.4. Multi-parameter Monitors
- 5.1.5. Respiratory Monitoring Devices
- 5.1.6. Remote Patient Monitoring Devices
- 5.1.7. Other Types of Devices
- 5.2. Market Analysis, Insights and Forecast - by Application
- 5.2.1. Cardiology
- 5.2.2. Neurology
- 5.2.3. Respiratory
- 5.2.4. Fetal and Neonatal
- 5.2.5. Weight Management and Fitness Monitoring
- 5.2.6. Other Applications
- 5.3. Market Analysis, Insights and Forecast - by End-Users
- 5.3.1. Home Healthcare
- 5.3.2. Hospitals and Clinics
- 5.3.3. Other End-Users
- 5.4. Market Analysis, Insights and Forecast - by Geography
- 5.4.1. China
- 5.4.2. Japan
- 5.4.3. India
- 5.4.4. Australia
- 5.4.5. South Korea
- 5.4.6. Rest of Asia-Pacific
- 5.5. Market Analysis, Insights and Forecast - by Region
- 5.5.1. China
- 5.5.2. Japan
- 5.5.3. India
- 5.5.4. Australia
- 5.5.5. South Korea
- 5.5.6. Rest of Asia Pacific
- 5.1. Market Analysis, Insights and Forecast - by Type of Device
- 6. China APAC Patient Monitoring Industry Analysis, Insights and Forecast, 2019-2031
- 6.1. Market Analysis, Insights and Forecast - by Type of Device
- 6.1.1. Hemodynamic Monitoring Devices
- 6.1.2. Neuromonitoring Devices
- 6.1.3. Cardiac Monitoring Devices
- 6.1.4. Multi-parameter Monitors
- 6.1.5. Respiratory Monitoring Devices
- 6.1.6. Remote Patient Monitoring Devices
- 6.1.7. Other Types of Devices
- 6.2. Market Analysis, Insights and Forecast - by Application
- 6.2.1. Cardiology
- 6.2.2. Neurology
- 6.2.3. Respiratory
- 6.2.4. Fetal and Neonatal
- 6.2.5. Weight Management and Fitness Monitoring
- 6.2.6. Other Applications
- 6.3. Market Analysis, Insights and Forecast - by End-Users
- 6.3.1. Home Healthcare
- 6.3.2. Hospitals and Clinics
- 6.3.3. Other End-Users
- 6.4. Market Analysis, Insights and Forecast - by Geography
- 6.4.1. China
- 6.4.2. Japan
- 6.4.3. India
- 6.4.4. Australia
- 6.4.5. South Korea
- 6.4.6. Rest of Asia-Pacific
- 6.1. Market Analysis, Insights and Forecast - by Type of Device
- 7. Japan APAC Patient Monitoring Industry Analysis, Insights and Forecast, 2019-2031
- 7.1. Market Analysis, Insights and Forecast - by Type of Device
- 7.1.1. Hemodynamic Monitoring Devices
- 7.1.2. Neuromonitoring Devices
- 7.1.3. Cardiac Monitoring Devices
- 7.1.4. Multi-parameter Monitors
- 7.1.5. Respiratory Monitoring Devices
- 7.1.6. Remote Patient Monitoring Devices
- 7.1.7. Other Types of Devices
- 7.2. Market Analysis, Insights and Forecast - by Application
- 7.2.1. Cardiology
- 7.2.2. Neurology
- 7.2.3. Respiratory
- 7.2.4. Fetal and Neonatal
- 7.2.5. Weight Management and Fitness Monitoring
- 7.2.6. Other Applications
- 7.3. Market Analysis, Insights and Forecast - by End-Users
- 7.3.1. Home Healthcare
- 7.3.2. Hospitals and Clinics
- 7.3.3. Other End-Users
- 7.4. Market Analysis, Insights and Forecast - by Geography
- 7.4.1. China
- 7.4.2. Japan
- 7.4.3. India
- 7.4.4. Australia
- 7.4.5. South Korea
- 7.4.6. Rest of Asia-Pacific
- 7.1. Market Analysis, Insights and Forecast - by Type of Device
- 8. India APAC Patient Monitoring Industry Analysis, Insights and Forecast, 2019-2031
- 8.1. Market Analysis, Insights and Forecast - by Type of Device
- 8.1.1. Hemodynamic Monitoring Devices
- 8.1.2. Neuromonitoring Devices
- 8.1.3. Cardiac Monitoring Devices
- 8.1.4. Multi-parameter Monitors
- 8.1.5. Respiratory Monitoring Devices
- 8.1.6. Remote Patient Monitoring Devices
- 8.1.7. Other Types of Devices
- 8.2. Market Analysis, Insights and Forecast - by Application
- 8.2.1. Cardiology
- 8.2.2. Neurology
- 8.2.3. Respiratory
- 8.2.4. Fetal and Neonatal
- 8.2.5. Weight Management and Fitness Monitoring
- 8.2.6. Other Applications
- 8.3. Market Analysis, Insights and Forecast - by End-Users
- 8.3.1. Home Healthcare
- 8.3.2. Hospitals and Clinics
- 8.3.3. Other End-Users
- 8.4. Market Analysis, Insights and Forecast - by Geography
- 8.4.1. China
- 8.4.2. Japan
- 8.4.3. India
- 8.4.4. Australia
- 8.4.5. South Korea
- 8.4.6. Rest of Asia-Pacific
- 8.1. Market Analysis, Insights and Forecast - by Type of Device
- 9. Australia APAC Patient Monitoring Industry Analysis, Insights and Forecast, 2019-2031
- 9.1. Market Analysis, Insights and Forecast - by Type of Device
- 9.1.1. Hemodynamic Monitoring Devices
- 9.1.2. Neuromonitoring Devices
- 9.1.3. Cardiac Monitoring Devices
- 9.1.4. Multi-parameter Monitors
- 9.1.5. Respiratory Monitoring Devices
- 9.1.6. Remote Patient Monitoring Devices
- 9.1.7. Other Types of Devices
- 9.2. Market Analysis, Insights and Forecast - by Application
- 9.2.1. Cardiology
- 9.2.2. Neurology
- 9.2.3. Respiratory
- 9.2.4. Fetal and Neonatal
- 9.2.5. Weight Management and Fitness Monitoring
- 9.2.6. Other Applications
- 9.3. Market Analysis, Insights and Forecast - by End-Users
- 9.3.1. Home Healthcare
- 9.3.2. Hospitals and Clinics
- 9.3.3. Other End-Users
- 9.4. Market Analysis, Insights and Forecast - by Geography
- 9.4.1. China
- 9.4.2. Japan
- 9.4.3. India
- 9.4.4. Australia
- 9.4.5. South Korea
- 9.4.6. Rest of Asia-Pacific
- 9.1. Market Analysis, Insights and Forecast - by Type of Device
- 10. South Korea APAC Patient Monitoring Industry Analysis, Insights and Forecast, 2019-2031
- 10.1. Market Analysis, Insights and Forecast - by Type of Device
- 10.1.1. Hemodynamic Monitoring Devices
- 10.1.2. Neuromonitoring Devices
- 10.1.3. Cardiac Monitoring Devices
- 10.1.4. Multi-parameter Monitors
- 10.1.5. Respiratory Monitoring Devices
- 10.1.6. Remote Patient Monitoring Devices
- 10.1.7. Other Types of Devices
- 10.2. Market Analysis, Insights and Forecast - by Application
- 10.2.1. Cardiology
- 10.2.2. Neurology
- 10.2.3. Respiratory
- 10.2.4. Fetal and Neonatal
- 10.2.5. Weight Management and Fitness Monitoring
- 10.2.6. Other Applications
- 10.3. Market Analysis, Insights and Forecast - by End-Users
- 10.3.1. Home Healthcare
- 10.3.2. Hospitals and Clinics
- 10.3.3. Other End-Users
- 10.4. Market Analysis, Insights and Forecast - by Geography
- 10.4.1. China
- 10.4.2. Japan
- 10.4.3. India
- 10.4.4. Australia
- 10.4.5. South Korea
- 10.4.6. Rest of Asia-Pacific
- 10.1. Market Analysis, Insights and Forecast - by Type of Device
- 11. Rest of Asia Pacific APAC Patient Monitoring Industry Analysis, Insights and Forecast, 2019-2031
- 11.1. Market Analysis, Insights and Forecast - by Type of Device
- 11.1.1. Hemodynamic Monitoring Devices
- 11.1.2. Neuromonitoring Devices
- 11.1.3. Cardiac Monitoring Devices
- 11.1.4. Multi-parameter Monitors
- 11.1.5. Respiratory Monitoring Devices
- 11.1.6. Remote Patient Monitoring Devices
- 11.1.7. Other Types of Devices
- 11.2. Market Analysis, Insights and Forecast - by Application
- 11.2.1. Cardiology
- 11.2.2. Neurology
- 11.2.3. Respiratory
- 11.2.4. Fetal and Neonatal
- 11.2.5. Weight Management and Fitness Monitoring
- 11.2.6. Other Applications
- 11.3. Market Analysis, Insights and Forecast - by End-Users
- 11.3.1. Home Healthcare
- 11.3.2. Hospitals and Clinics
- 11.3.3. Other End-Users
- 11.4. Market Analysis, Insights and Forecast - by Geography
- 11.4.1. China
- 11.4.2. Japan
- 11.4.3. India
- 11.4.4. Australia
- 11.4.5. South Korea
- 11.4.6. Rest of Asia-Pacific
- 11.1. Market Analysis, Insights and Forecast - by Type of Device
- 12. North America APAC Patient Monitoring Industry Analysis, Insights and Forecast, 2019-2031
- 12.1. Market Analysis, Insights and Forecast - By Country/Sub-region
- 12.1.1 United States
- 12.1.2 Canada
- 12.1.3 Mexico
- 13. Europe APAC Patient Monitoring Industry Analysis, Insights and Forecast, 2019-2031
- 13.1. Market Analysis, Insights and Forecast - By Country/Sub-region
- 13.1.1 Germany
- 13.1.2 United Kingdom
- 13.1.3 France
- 13.1.4 Spain
- 13.1.5 Italy
- 13.1.6 Spain
- 13.1.7 Belgium
- 13.1.8 Netherland
- 13.1.9 Nordics
- 13.1.10 Rest of Europe
- 14. Asia Pacific APAC Patient Monitoring Industry Analysis, Insights and Forecast, 2019-2031
- 14.1. Market Analysis, Insights and Forecast - By Country/Sub-region
- 14.1.1 China
- 14.1.2 Japan
- 14.1.3 India
- 14.1.4 South Korea
- 14.1.5 Southeast Asia
- 14.1.6 Australia
- 14.1.7 Indonesia
- 14.1.8 Phillipes
- 14.1.9 Singapore
- 14.1.10 Thailandc
- 14.1.11 Rest of Asia Pacific
- 15. South America APAC Patient Monitoring Industry Analysis, Insights and Forecast, 2019-2031
- 15.1. Market Analysis, Insights and Forecast - By Country/Sub-region
- 15.1.1 Brazil
- 15.1.2 Argentina
- 15.1.3 Peru
- 15.1.4 Chile
- 15.1.5 Colombia
- 15.1.6 Ecuador
- 15.1.7 Venezuela
- 15.1.8 Rest of South America
- 16. MEA APAC Patient Monitoring Industry Analysis, Insights and Forecast, 2019-2031
- 16.1. Market Analysis, Insights and Forecast - By Country/Sub-region
- 16.1.1 United Arab Emirates
- 16.1.2 Saudi Arabia
- 16.1.3 South Africa
- 16.1.4 Rest of Middle East and Africa
- 17. Competitive Analysis
- 17.1. Global Market Share Analysis 2024
- 17.2. Company Profiles
- 17.2.1 BPL Group
- 17.2.1.1. Overview
- 17.2.1.2. Products
- 17.2.1.3. SWOT Analysis
- 17.2.1.4. Recent Developments
- 17.2.1.5. Financials (Based on Availability)
- 17.2.2 Koninklijke Philips N V
- 17.2.2.1. Overview
- 17.2.2.2. Products
- 17.2.2.3. SWOT Analysis
- 17.2.2.4. Recent Developments
- 17.2.2.5. Financials (Based on Availability)
- 17.2.3 General Electric Company (GE Healthcare)
- 17.2.3.1. Overview
- 17.2.3.2. Products
- 17.2.3.3. SWOT Analysis
- 17.2.3.4. Recent Developments
- 17.2.3.5. Financials (Based on Availability)
- 17.2.4 Mindray Medical International Co Ltd
- 17.2.4.1. Overview
- 17.2.4.2. Products
- 17.2.4.3. SWOT Analysis
- 17.2.4.4. Recent Developments
- 17.2.4.5. Financials (Based on Availability)
- 17.2.5 Spacelabs Healthcare
- 17.2.5.1. Overview
- 17.2.5.2. Products
- 17.2.5.3. SWOT Analysis
- 17.2.5.4. Recent Developments
- 17.2.5.5. Financials (Based on Availability)
- 17.2.6 Nihon Kohden Corporation
- 17.2.6.1. Overview
- 17.2.6.2. Products
- 17.2.6.3. SWOT Analysis
- 17.2.6.4. Recent Developments
- 17.2.6.5. Financials (Based on Availability)
- 17.2.7 Dragerwerk AG
- 17.2.7.1. Overview
- 17.2.7.2. Products
- 17.2.7.3. SWOT Analysis
- 17.2.7.4. Recent Developments
- 17.2.7.5. Financials (Based on Availability)
- 17.2.8 Schiller
- 17.2.8.1. Overview
- 17.2.8.2. Products
- 17.2.8.3. SWOT Analysis
- 17.2.8.4. Recent Developments
- 17.2.8.5. Financials (Based on Availability)
- 17.2.9 Siemens Healthcare GmBH
- 17.2.9.1. Overview
- 17.2.9.2. Products
- 17.2.9.3. SWOT Analysis
- 17.2.9.4. Recent Developments
- 17.2.9.5. Financials (Based on Availability)
- 17.2.1 BPL Group
List of Figures
- Figure 1: Global APAC Patient Monitoring Industry Revenue Breakdown (Million, %) by Region 2024 & 2032
- Figure 2: Global APAC Patient Monitoring Industry Volume Breakdown (K Units, %) by Region 2024 & 2032
- Figure 3: North America APAC Patient Monitoring Industry Revenue (Million), by Country 2024 & 2032
- Figure 4: North America APAC Patient Monitoring Industry Volume (K Units), by Country 2024 & 2032
- Figure 5: North America APAC Patient Monitoring Industry Revenue Share (%), by Country 2024 & 2032
- Figure 6: North America APAC Patient Monitoring Industry Volume Share (%), by Country 2024 & 2032
- Figure 7: Europe APAC Patient Monitoring Industry Revenue (Million), by Country 2024 & 2032
- Figure 8: Europe APAC Patient Monitoring Industry Volume (K Units), by Country 2024 & 2032
- Figure 9: Europe APAC Patient Monitoring Industry Revenue Share (%), by Country 2024 & 2032
- Figure 10: Europe APAC Patient Monitoring Industry Volume Share (%), by Country 2024 & 2032
- Figure 11: Asia Pacific APAC Patient Monitoring Industry Revenue (Million), by Country 2024 & 2032
- Figure 12: Asia Pacific APAC Patient Monitoring Industry Volume (K Units), by Country 2024 & 2032
- Figure 13: Asia Pacific APAC Patient Monitoring Industry Revenue Share (%), by Country 2024 & 2032
- Figure 14: Asia Pacific APAC Patient Monitoring Industry Volume Share (%), by Country 2024 & 2032
- Figure 15: South America APAC Patient Monitoring Industry Revenue (Million), by Country 2024 & 2032
- Figure 16: South America APAC Patient Monitoring Industry Volume (K Units), by Country 2024 & 2032
- Figure 17: South America APAC Patient Monitoring Industry Revenue Share (%), by Country 2024 & 2032
- Figure 18: South America APAC Patient Monitoring Industry Volume Share (%), by Country 2024 & 2032
- Figure 19: MEA APAC Patient Monitoring Industry Revenue (Million), by Country 2024 & 2032
- Figure 20: MEA APAC Patient Monitoring Industry Volume (K Units), by Country 2024 & 2032
- Figure 21: MEA APAC Patient Monitoring Industry Revenue Share (%), by Country 2024 & 2032
- Figure 22: MEA APAC Patient Monitoring Industry Volume Share (%), by Country 2024 & 2032
- Figure 23: China APAC Patient Monitoring Industry Revenue (Million), by Type of Device 2024 & 2032
- Figure 24: China APAC Patient Monitoring Industry Volume (K Units), by Type of Device 2024 & 2032
- Figure 25: China APAC Patient Monitoring Industry Revenue Share (%), by Type of Device 2024 & 2032
- Figure 26: China APAC Patient Monitoring Industry Volume Share (%), by Type of Device 2024 & 2032
- Figure 27: China APAC Patient Monitoring Industry Revenue (Million), by Application 2024 & 2032
- Figure 28: China APAC Patient Monitoring Industry Volume (K Units), by Application 2024 & 2032
- Figure 29: China APAC Patient Monitoring Industry Revenue Share (%), by Application 2024 & 2032
- Figure 30: China APAC Patient Monitoring Industry Volume Share (%), by Application 2024 & 2032
- Figure 31: China APAC Patient Monitoring Industry Revenue (Million), by End-Users 2024 & 2032
- Figure 32: China APAC Patient Monitoring Industry Volume (K Units), by End-Users 2024 & 2032
- Figure 33: China APAC Patient Monitoring Industry Revenue Share (%), by End-Users 2024 & 2032
- Figure 34: China APAC Patient Monitoring Industry Volume Share (%), by End-Users 2024 & 2032
- Figure 35: China APAC Patient Monitoring Industry Revenue (Million), by Geography 2024 & 2032
- Figure 36: China APAC Patient Monitoring Industry Volume (K Units), by Geography 2024 & 2032
- Figure 37: China APAC Patient Monitoring Industry Revenue Share (%), by Geography 2024 & 2032
- Figure 38: China APAC Patient Monitoring Industry Volume Share (%), by Geography 2024 & 2032
- Figure 39: China APAC Patient Monitoring Industry Revenue (Million), by Country 2024 & 2032
- Figure 40: China APAC Patient Monitoring Industry Volume (K Units), by Country 2024 & 2032
- Figure 41: China APAC Patient Monitoring Industry Revenue Share (%), by Country 2024 & 2032
- Figure 42: China APAC Patient Monitoring Industry Volume Share (%), by Country 2024 & 2032
- Figure 43: Japan APAC Patient Monitoring Industry Revenue (Million), by Type of Device 2024 & 2032
- Figure 44: Japan APAC Patient Monitoring Industry Volume (K Units), by Type of Device 2024 & 2032
- Figure 45: Japan APAC Patient Monitoring Industry Revenue Share (%), by Type of Device 2024 & 2032
- Figure 46: Japan APAC Patient Monitoring Industry Volume Share (%), by Type of Device 2024 & 2032
- Figure 47: Japan APAC Patient Monitoring Industry Revenue (Million), by Application 2024 & 2032
- Figure 48: Japan APAC Patient Monitoring Industry Volume (K Units), by Application 2024 & 2032
- Figure 49: Japan APAC Patient Monitoring Industry Revenue Share (%), by Application 2024 & 2032
- Figure 50: Japan APAC Patient Monitoring Industry Volume Share (%), by Application 2024 & 2032
- Figure 51: Japan APAC Patient Monitoring Industry Revenue (Million), by End-Users 2024 & 2032
- Figure 52: Japan APAC Patient Monitoring Industry Volume (K Units), by End-Users 2024 & 2032
- Figure 53: Japan APAC Patient Monitoring Industry Revenue Share (%), by End-Users 2024 & 2032
- Figure 54: Japan APAC Patient Monitoring Industry Volume Share (%), by End-Users 2024 & 2032
- Figure 55: Japan APAC Patient Monitoring Industry Revenue (Million), by Geography 2024 & 2032
- Figure 56: Japan APAC Patient Monitoring Industry Volume (K Units), by Geography 2024 & 2032
- Figure 57: Japan APAC Patient Monitoring Industry Revenue Share (%), by Geography 2024 & 2032
- Figure 58: Japan APAC Patient Monitoring Industry Volume Share (%), by Geography 2024 & 2032
- Figure 59: Japan APAC Patient Monitoring Industry Revenue (Million), by Country 2024 & 2032
- Figure 60: Japan APAC Patient Monitoring Industry Volume (K Units), by Country 2024 & 2032
- Figure 61: Japan APAC Patient Monitoring Industry Revenue Share (%), by Country 2024 & 2032
- Figure 62: Japan APAC Patient Monitoring Industry Volume Share (%), by Country 2024 & 2032
- Figure 63: India APAC Patient Monitoring Industry Revenue (Million), by Type of Device 2024 & 2032
- Figure 64: India APAC Patient Monitoring Industry Volume (K Units), by Type of Device 2024 & 2032
- Figure 65: India APAC Patient Monitoring Industry Revenue Share (%), by Type of Device 2024 & 2032
- Figure 66: India APAC Patient Monitoring Industry Volume Share (%), by Type of Device 2024 & 2032
- Figure 67: India APAC Patient Monitoring Industry Revenue (Million), by Application 2024 & 2032
- Figure 68: India APAC Patient Monitoring Industry Volume (K Units), by Application 2024 & 2032
- Figure 69: India APAC Patient Monitoring Industry Revenue Share (%), by Application 2024 & 2032
- Figure 70: India APAC Patient Monitoring Industry Volume Share (%), by Application 2024 & 2032
- Figure 71: India APAC Patient Monitoring Industry Revenue (Million), by End-Users 2024 & 2032
- Figure 72: India APAC Patient Monitoring Industry Volume (K Units), by End-Users 2024 & 2032
- Figure 73: India APAC Patient Monitoring Industry Revenue Share (%), by End-Users 2024 & 2032
- Figure 74: India APAC Patient Monitoring Industry Volume Share (%), by End-Users 2024 & 2032
- Figure 75: India APAC Patient Monitoring Industry Revenue (Million), by Geography 2024 & 2032
- Figure 76: India APAC Patient Monitoring Industry Volume (K Units), by Geography 2024 & 2032
- Figure 77: India APAC Patient Monitoring Industry Revenue Share (%), by Geography 2024 & 2032
- Figure 78: India APAC Patient Monitoring Industry Volume Share (%), by Geography 2024 & 2032
- Figure 79: India APAC Patient Monitoring Industry Revenue (Million), by Country 2024 & 2032
- Figure 80: India APAC Patient Monitoring Industry Volume (K Units), by Country 2024 & 2032
- Figure 81: India APAC Patient Monitoring Industry Revenue Share (%), by Country 2024 & 2032
- Figure 82: India APAC Patient Monitoring Industry Volume Share (%), by Country 2024 & 2032
- Figure 83: Australia APAC Patient Monitoring Industry Revenue (Million), by Type of Device 2024 & 2032
- Figure 84: Australia APAC Patient Monitoring Industry Volume (K Units), by Type of Device 2024 & 2032
- Figure 85: Australia APAC Patient Monitoring Industry Revenue Share (%), by Type of Device 2024 & 2032
- Figure 86: Australia APAC Patient Monitoring Industry Volume Share (%), by Type of Device 2024 & 2032
- Figure 87: Australia APAC Patient Monitoring Industry Revenue (Million), by Application 2024 & 2032
- Figure 88: Australia APAC Patient Monitoring Industry Volume (K Units), by Application 2024 & 2032
- Figure 89: Australia APAC Patient Monitoring Industry Revenue Share (%), by Application 2024 & 2032
- Figure 90: Australia APAC Patient Monitoring Industry Volume Share (%), by Application 2024 & 2032
- Figure 91: Australia APAC Patient Monitoring Industry Revenue (Million), by End-Users 2024 & 2032
- Figure 92: Australia APAC Patient Monitoring Industry Volume (K Units), by End-Users 2024 & 2032
- Figure 93: Australia APAC Patient Monitoring Industry Revenue Share (%), by End-Users 2024 & 2032
- Figure 94: Australia APAC Patient Monitoring Industry Volume Share (%), by End-Users 2024 & 2032
- Figure 95: Australia APAC Patient Monitoring Industry Revenue (Million), by Geography 2024 & 2032
- Figure 96: Australia APAC Patient Monitoring Industry Volume (K Units), by Geography 2024 & 2032
- Figure 97: Australia APAC Patient Monitoring Industry Revenue Share (%), by Geography 2024 & 2032
- Figure 98: Australia APAC Patient Monitoring Industry Volume Share (%), by Geography 2024 & 2032
- Figure 99: Australia APAC Patient Monitoring Industry Revenue (Million), by Country 2024 & 2032
- Figure 100: Australia APAC Patient Monitoring Industry Volume (K Units), by Country 2024 & 2032
- Figure 101: Australia APAC Patient Monitoring Industry Revenue Share (%), by Country 2024 & 2032
- Figure 102: Australia APAC Patient Monitoring Industry Volume Share (%), by Country 2024 & 2032
- Figure 103: South Korea APAC Patient Monitoring Industry Revenue (Million), by Type of Device 2024 & 2032
- Figure 104: South Korea APAC Patient Monitoring Industry Volume (K Units), by Type of Device 2024 & 2032
- Figure 105: South Korea APAC Patient Monitoring Industry Revenue Share (%), by Type of Device 2024 & 2032
- Figure 106: South Korea APAC Patient Monitoring Industry Volume Share (%), by Type of Device 2024 & 2032
- Figure 107: South Korea APAC Patient Monitoring Industry Revenue (Million), by Application 2024 & 2032
- Figure 108: South Korea APAC Patient Monitoring Industry Volume (K Units), by Application 2024 & 2032
- Figure 109: South Korea APAC Patient Monitoring Industry Revenue Share (%), by Application 2024 & 2032
- Figure 110: South Korea APAC Patient Monitoring Industry Volume Share (%), by Application 2024 & 2032
- Figure 111: South Korea APAC Patient Monitoring Industry Revenue (Million), by End-Users 2024 & 2032
- Figure 112: South Korea APAC Patient Monitoring Industry Volume (K Units), by End-Users 2024 & 2032
- Figure 113: South Korea APAC Patient Monitoring Industry Revenue Share (%), by End-Users 2024 & 2032
- Figure 114: South Korea APAC Patient Monitoring Industry Volume Share (%), by End-Users 2024 & 2032
- Figure 115: South Korea APAC Patient Monitoring Industry Revenue (Million), by Geography 2024 & 2032
- Figure 116: South Korea APAC Patient Monitoring Industry Volume (K Units), by Geography 2024 & 2032
- Figure 117: South Korea APAC Patient Monitoring Industry Revenue Share (%), by Geography 2024 & 2032
- Figure 118: South Korea APAC Patient Monitoring Industry Volume Share (%), by Geography 2024 & 2032
- Figure 119: South Korea APAC Patient Monitoring Industry Revenue (Million), by Country 2024 & 2032
- Figure 120: South Korea APAC Patient Monitoring Industry Volume (K Units), by Country 2024 & 2032
- Figure 121: South Korea APAC Patient Monitoring Industry Revenue Share (%), by Country 2024 & 2032
- Figure 122: South Korea APAC Patient Monitoring Industry Volume Share (%), by Country 2024 & 2032
- Figure 123: Rest of Asia Pacific APAC Patient Monitoring Industry Revenue (Million), by Type of Device 2024 & 2032
- Figure 124: Rest of Asia Pacific APAC Patient Monitoring Industry Volume (K Units), by Type of Device 2024 & 2032
- Figure 125: Rest of Asia Pacific APAC Patient Monitoring Industry Revenue Share (%), by Type of Device 2024 & 2032
- Figure 126: Rest of Asia Pacific APAC Patient Monitoring Industry Volume Share (%), by Type of Device 2024 & 2032
- Figure 127: Rest of Asia Pacific APAC Patient Monitoring Industry Revenue (Million), by Application 2024 & 2032
- Figure 128: Rest of Asia Pacific APAC Patient Monitoring Industry Volume (K Units), by Application 2024 & 2032
- Figure 129: Rest of Asia Pacific APAC Patient Monitoring Industry Revenue Share (%), by Application 2024 & 2032
- Figure 130: Rest of Asia Pacific APAC Patient Monitoring Industry Volume Share (%), by Application 2024 & 2032
- Figure 131: Rest of Asia Pacific APAC Patient Monitoring Industry Revenue (Million), by End-Users 2024 & 2032
- Figure 132: Rest of Asia Pacific APAC Patient Monitoring Industry Volume (K Units), by End-Users 2024 & 2032
- Figure 133: Rest of Asia Pacific APAC Patient Monitoring Industry Revenue Share (%), by End-Users 2024 & 2032
- Figure 134: Rest of Asia Pacific APAC Patient Monitoring Industry Volume Share (%), by End-Users 2024 & 2032
- Figure 135: Rest of Asia Pacific APAC Patient Monitoring Industry Revenue (Million), by Geography 2024 & 2032
- Figure 136: Rest of Asia Pacific APAC Patient Monitoring Industry Volume (K Units), by Geography 2024 & 2032
- Figure 137: Rest of Asia Pacific APAC Patient Monitoring Industry Revenue Share (%), by Geography 2024 & 2032
- Figure 138: Rest of Asia Pacific APAC Patient Monitoring Industry Volume Share (%), by Geography 2024 & 2032
- Figure 139: Rest of Asia Pacific APAC Patient Monitoring Industry Revenue (Million), by Country 2024 & 2032
- Figure 140: Rest of Asia Pacific APAC Patient Monitoring Industry Volume (K Units), by Country 2024 & 2032
- Figure 141: Rest of Asia Pacific APAC Patient Monitoring Industry Revenue Share (%), by Country 2024 & 2032
- Figure 142: Rest of Asia Pacific APAC Patient Monitoring Industry Volume Share (%), by Country 2024 & 2032
List of Tables
- Table 1: Global APAC Patient Monitoring Industry Revenue Million Forecast, by Region 2019 & 2032
- Table 2: Global APAC Patient Monitoring Industry Volume K Units Forecast, by Region 2019 & 2032
- Table 3: Global APAC Patient Monitoring Industry Revenue Million Forecast, by Type of Device 2019 & 2032
- Table 4: Global APAC Patient Monitoring Industry Volume K Units Forecast, by Type of Device 2019 & 2032
- Table 5: Global APAC Patient Monitoring Industry Revenue Million Forecast, by Application 2019 & 2032
- Table 6: Global APAC Patient Monitoring Industry Volume K Units Forecast, by Application 2019 & 2032
- Table 7: Global APAC Patient Monitoring Industry Revenue Million Forecast, by End-Users 2019 & 2032
- Table 8: Global APAC Patient Monitoring Industry Volume K Units Forecast, by End-Users 2019 & 2032
- Table 9: Global APAC Patient Monitoring Industry Revenue Million Forecast, by Geography 2019 & 2032
- Table 10: Global APAC Patient Monitoring Industry Volume K Units Forecast, by Geography 2019 & 2032
- Table 11: Global APAC Patient Monitoring Industry Revenue Million Forecast, by Region 2019 & 2032
- Table 12: Global APAC Patient Monitoring Industry Volume K Units Forecast, by Region 2019 & 2032
- Table 13: Global APAC Patient Monitoring Industry Revenue Million Forecast, by Country 2019 & 2032
- Table 14: Global APAC Patient Monitoring Industry Volume K Units Forecast, by Country 2019 & 2032
- Table 15: United States APAC Patient Monitoring Industry Revenue (Million) Forecast, by Application 2019 & 2032
- Table 16: United States APAC Patient Monitoring Industry Volume (K Units) Forecast, by Application 2019 & 2032
- Table 17: Canada APAC Patient Monitoring Industry Revenue (Million) Forecast, by Application 2019 & 2032
- Table 18: Canada APAC Patient Monitoring Industry Volume (K Units) Forecast, by Application 2019 & 2032
- Table 19: Mexico APAC Patient Monitoring Industry Revenue (Million) Forecast, by Application 2019 & 2032
- Table 20: Mexico APAC Patient Monitoring Industry Volume (K Units) Forecast, by Application 2019 & 2032
- Table 21: Global APAC Patient Monitoring Industry Revenue Million Forecast, by Country 2019 & 2032
- Table 22: Global APAC Patient Monitoring Industry Volume K Units Forecast, by Country 2019 & 2032
- Table 23: Germany APAC Patient Monitoring Industry Revenue (Million) Forecast, by Application 2019 & 2032
- Table 24: Germany APAC Patient Monitoring Industry Volume (K Units) Forecast, by Application 2019 & 2032
- Table 25: United Kingdom APAC Patient Monitoring Industry Revenue (Million) Forecast, by Application 2019 & 2032
- Table 26: United Kingdom APAC Patient Monitoring Industry Volume (K Units) Forecast, by Application 2019 & 2032
- Table 27: France APAC Patient Monitoring Industry Revenue (Million) Forecast, by Application 2019 & 2032
- Table 28: France APAC Patient Monitoring Industry Volume (K Units) Forecast, by Application 2019 & 2032
- Table 29: Spain APAC Patient Monitoring Industry Revenue (Million) Forecast, by Application 2019 & 2032
- Table 30: Spain APAC Patient Monitoring Industry Volume (K Units) Forecast, by Application 2019 & 2032
- Table 31: Italy APAC Patient Monitoring Industry Revenue (Million) Forecast, by Application 2019 & 2032
- Table 32: Italy APAC Patient Monitoring Industry Volume (K Units) Forecast, by Application 2019 & 2032
- Table 33: Spain APAC Patient Monitoring Industry Revenue (Million) Forecast, by Application 2019 & 2032
- Table 34: Spain APAC Patient Monitoring Industry Volume (K Units) Forecast, by Application 2019 & 2032
- Table 35: Belgium APAC Patient Monitoring Industry Revenue (Million) Forecast, by Application 2019 & 2032
- Table 36: Belgium APAC Patient Monitoring Industry Volume (K Units) Forecast, by Application 2019 & 2032
- Table 37: Netherland APAC Patient Monitoring Industry Revenue (Million) Forecast, by Application 2019 & 2032
- Table 38: Netherland APAC Patient Monitoring Industry Volume (K Units) Forecast, by Application 2019 & 2032
- Table 39: Nordics APAC Patient Monitoring Industry Revenue (Million) Forecast, by Application 2019 & 2032
- Table 40: Nordics APAC Patient Monitoring Industry Volume (K Units) Forecast, by Application 2019 & 2032
- Table 41: Rest of Europe APAC Patient Monitoring Industry Revenue (Million) Forecast, by Application 2019 & 2032
- Table 42: Rest of Europe APAC Patient Monitoring Industry Volume (K Units) Forecast, by Application 2019 & 2032
- Table 43: Global APAC Patient Monitoring Industry Revenue Million Forecast, by Country 2019 & 2032
- Table 44: Global APAC Patient Monitoring Industry Volume K Units Forecast, by Country 2019 & 2032
- Table 45: China APAC Patient Monitoring Industry Revenue (Million) Forecast, by Application 2019 & 2032
- Table 46: China APAC Patient Monitoring Industry Volume (K Units) Forecast, by Application 2019 & 2032
- Table 47: Japan APAC Patient Monitoring Industry Revenue (Million) Forecast, by Application 2019 & 2032
- Table 48: Japan APAC Patient Monitoring Industry Volume (K Units) Forecast, by Application 2019 & 2032
- Table 49: India APAC Patient Monitoring Industry Revenue (Million) Forecast, by Application 2019 & 2032
- Table 50: India APAC Patient Monitoring Industry Volume (K Units) Forecast, by Application 2019 & 2032
- Table 51: South Korea APAC Patient Monitoring Industry Revenue (Million) Forecast, by Application 2019 & 2032
- Table 52: South Korea APAC Patient Monitoring Industry Volume (K Units) Forecast, by Application 2019 & 2032
- Table 53: Southeast Asia APAC Patient Monitoring Industry Revenue (Million) Forecast, by Application 2019 & 2032
- Table 54: Southeast Asia APAC Patient Monitoring Industry Volume (K Units) Forecast, by Application 2019 & 2032
- Table 55: Australia APAC Patient Monitoring Industry Revenue (Million) Forecast, by Application 2019 & 2032
- Table 56: Australia APAC Patient Monitoring Industry Volume (K Units) Forecast, by Application 2019 & 2032
- Table 57: Indonesia APAC Patient Monitoring Industry Revenue (Million) Forecast, by Application 2019 & 2032
- Table 58: Indonesia APAC Patient Monitoring Industry Volume (K Units) Forecast, by Application 2019 & 2032
- Table 59: Phillipes APAC Patient Monitoring Industry Revenue (Million) Forecast, by Application 2019 & 2032
- Table 60: Phillipes APAC Patient Monitoring Industry Volume (K Units) Forecast, by Application 2019 & 2032
- Table 61: Singapore APAC Patient Monitoring Industry Revenue (Million) Forecast, by Application 2019 & 2032
- Table 62: Singapore APAC Patient Monitoring Industry Volume (K Units) Forecast, by Application 2019 & 2032
- Table 63: Thailandc APAC Patient Monitoring Industry Revenue (Million) Forecast, by Application 2019 & 2032
- Table 64: Thailandc APAC Patient Monitoring Industry Volume (K Units) Forecast, by Application 2019 & 2032
- Table 65: Rest of Asia Pacific APAC Patient Monitoring Industry Revenue (Million) Forecast, by Application 2019 & 2032
- Table 66: Rest of Asia Pacific APAC Patient Monitoring Industry Volume (K Units) Forecast, by Application 2019 & 2032
- Table 67: Global APAC Patient Monitoring Industry Revenue Million Forecast, by Country 2019 & 2032
- Table 68: Global APAC Patient Monitoring Industry Volume K Units Forecast, by Country 2019 & 2032
- Table 69: Brazil APAC Patient Monitoring Industry Revenue (Million) Forecast, by Application 2019 & 2032
- Table 70: Brazil APAC Patient Monitoring Industry Volume (K Units) Forecast, by Application 2019 & 2032
- Table 71: Argentina APAC Patient Monitoring Industry Revenue (Million) Forecast, by Application 2019 & 2032
- Table 72: Argentina APAC Patient Monitoring Industry Volume (K Units) Forecast, by Application 2019 & 2032
- Table 73: Peru APAC Patient Monitoring Industry Revenue (Million) Forecast, by Application 2019 & 2032
- Table 74: Peru APAC Patient Monitoring Industry Volume (K Units) Forecast, by Application 2019 & 2032
- Table 75: Chile APAC Patient Monitoring Industry Revenue (Million) Forecast, by Application 2019 & 2032
- Table 76: Chile APAC Patient Monitoring Industry Volume (K Units) Forecast, by Application 2019 & 2032
- Table 77: Colombia APAC Patient Monitoring Industry Revenue (Million) Forecast, by Application 2019 & 2032
- Table 78: Colombia APAC Patient Monitoring Industry Volume (K Units) Forecast, by Application 2019 & 2032
- Table 79: Ecuador APAC Patient Monitoring Industry Revenue (Million) Forecast, by Application 2019 & 2032
- Table 80: Ecuador APAC Patient Monitoring Industry Volume (K Units) Forecast, by Application 2019 & 2032
- Table 81: Venezuela APAC Patient Monitoring Industry Revenue (Million) Forecast, by Application 2019 & 2032
- Table 82: Venezuela APAC Patient Monitoring Industry Volume (K Units) Forecast, by Application 2019 & 2032
- Table 83: Rest of South America APAC Patient Monitoring Industry Revenue (Million) Forecast, by Application 2019 & 2032
- Table 84: Rest of South America APAC Patient Monitoring Industry Volume (K Units) Forecast, by Application 2019 & 2032
- Table 85: Global APAC Patient Monitoring Industry Revenue Million Forecast, by Country 2019 & 2032
- Table 86: Global APAC Patient Monitoring Industry Volume K Units Forecast, by Country 2019 & 2032
- Table 87: United Arab Emirates APAC Patient Monitoring Industry Revenue (Million) Forecast, by Application 2019 & 2032
- Table 88: United Arab Emirates APAC Patient Monitoring Industry Volume (K Units) Forecast, by Application 2019 & 2032
- Table 89: Saudi Arabia APAC Patient Monitoring Industry Revenue (Million) Forecast, by Application 2019 & 2032
- Table 90: Saudi Arabia APAC Patient Monitoring Industry Volume (K Units) Forecast, by Application 2019 & 2032
- Table 91: South Africa APAC Patient Monitoring Industry Revenue (Million) Forecast, by Application 2019 & 2032
- Table 92: South Africa APAC Patient Monitoring Industry Volume (K Units) Forecast, by Application 2019 & 2032
- Table 93: Rest of Middle East and Africa APAC Patient Monitoring Industry Revenue (Million) Forecast, by Application 2019 & 2032
- Table 94: Rest of Middle East and Africa APAC Patient Monitoring Industry Volume (K Units) Forecast, by Application 2019 & 2032
- Table 95: Global APAC Patient Monitoring Industry Revenue Million Forecast, by Type of Device 2019 & 2032
- Table 96: Global APAC Patient Monitoring Industry Volume K Units Forecast, by Type of Device 2019 & 2032
- Table 97: Global APAC Patient Monitoring Industry Revenue Million Forecast, by Application 2019 & 2032
- Table 98: Global APAC Patient Monitoring Industry Volume K Units Forecast, by Application 2019 & 2032
- Table 99: Global APAC Patient Monitoring Industry Revenue Million Forecast, by End-Users 2019 & 2032
- Table 100: Global APAC Patient Monitoring Industry Volume K Units Forecast, by End-Users 2019 & 2032
- Table 101: Global APAC Patient Monitoring Industry Revenue Million Forecast, by Geography 2019 & 2032
- Table 102: Global APAC Patient Monitoring Industry Volume K Units Forecast, by Geography 2019 & 2032
- Table 103: Global APAC Patient Monitoring Industry Revenue Million Forecast, by Country 2019 & 2032
- Table 104: Global APAC Patient Monitoring Industry Volume K Units Forecast, by Country 2019 & 2032
- Table 105: Global APAC Patient Monitoring Industry Revenue Million Forecast, by Type of Device 2019 & 2032
- Table 106: Global APAC Patient Monitoring Industry Volume K Units Forecast, by Type of Device 2019 & 2032
- Table 107: Global APAC Patient Monitoring Industry Revenue Million Forecast, by Application 2019 & 2032
- Table 108: Global APAC Patient Monitoring Industry Volume K Units Forecast, by Application 2019 & 2032
- Table 109: Global APAC Patient Monitoring Industry Revenue Million Forecast, by End-Users 2019 & 2032
- Table 110: Global APAC Patient Monitoring Industry Volume K Units Forecast, by End-Users 2019 & 2032
- Table 111: Global APAC Patient Monitoring Industry Revenue Million Forecast, by Geography 2019 & 2032
- Table 112: Global APAC Patient Monitoring Industry Volume K Units Forecast, by Geography 2019 & 2032
- Table 113: Global APAC Patient Monitoring Industry Revenue Million Forecast, by Country 2019 & 2032
- Table 114: Global APAC Patient Monitoring Industry Volume K Units Forecast, by Country 2019 & 2032
- Table 115: Global APAC Patient Monitoring Industry Revenue Million Forecast, by Type of Device 2019 & 2032
- Table 116: Global APAC Patient Monitoring Industry Volume K Units Forecast, by Type of Device 2019 & 2032
- Table 117: Global APAC Patient Monitoring Industry Revenue Million Forecast, by Application 2019 & 2032
- Table 118: Global APAC Patient Monitoring Industry Volume K Units Forecast, by Application 2019 & 2032
- Table 119: Global APAC Patient Monitoring Industry Revenue Million Forecast, by End-Users 2019 & 2032
- Table 120: Global APAC Patient Monitoring Industry Volume K Units Forecast, by End-Users 2019 & 2032
- Table 121: Global APAC Patient Monitoring Industry Revenue Million Forecast, by Geography 2019 & 2032
- Table 122: Global APAC Patient Monitoring Industry Volume K Units Forecast, by Geography 2019 & 2032
- Table 123: Global APAC Patient Monitoring Industry Revenue Million Forecast, by Country 2019 & 2032
- Table 124: Global APAC Patient Monitoring Industry Volume K Units Forecast, by Country 2019 & 2032
- Table 125: Global APAC Patient Monitoring Industry Revenue Million Forecast, by Type of Device 2019 & 2032
- Table 126: Global APAC Patient Monitoring Industry Volume K Units Forecast, by Type of Device 2019 & 2032
- Table 127: Global APAC Patient Monitoring Industry Revenue Million Forecast, by Application 2019 & 2032
- Table 128: Global APAC Patient Monitoring Industry Volume K Units Forecast, by Application 2019 & 2032
- Table 129: Global APAC Patient Monitoring Industry Revenue Million Forecast, by End-Users 2019 & 2032
- Table 130: Global APAC Patient Monitoring Industry Volume K Units Forecast, by End-Users 2019 & 2032
- Table 131: Global APAC Patient Monitoring Industry Revenue Million Forecast, by Geography 2019 & 2032
- Table 132: Global APAC Patient Monitoring Industry Volume K Units Forecast, by Geography 2019 & 2032
- Table 133: Global APAC Patient Monitoring Industry Revenue Million Forecast, by Country 2019 & 2032
- Table 134: Global APAC Patient Monitoring Industry Volume K Units Forecast, by Country 2019 & 2032
- Table 135: Global APAC Patient Monitoring Industry Revenue Million Forecast, by Type of Device 2019 & 2032
- Table 136: Global APAC Patient Monitoring Industry Volume K Units Forecast, by Type of Device 2019 & 2032
- Table 137: Global APAC Patient Monitoring Industry Revenue Million Forecast, by Application 2019 & 2032
- Table 138: Global APAC Patient Monitoring Industry Volume K Units Forecast, by Application 2019 & 2032
- Table 139: Global APAC Patient Monitoring Industry Revenue Million Forecast, by End-Users 2019 & 2032
- Table 140: Global APAC Patient Monitoring Industry Volume K Units Forecast, by End-Users 2019 & 2032
- Table 141: Global APAC Patient Monitoring Industry Revenue Million Forecast, by Geography 2019 & 2032
- Table 142: Global APAC Patient Monitoring Industry Volume K Units Forecast, by Geography 2019 & 2032
- Table 143: Global APAC Patient Monitoring Industry Revenue Million Forecast, by Country 2019 & 2032
- Table 144: Global APAC Patient Monitoring Industry Volume K Units Forecast, by Country 2019 & 2032
- Table 145: Global APAC Patient Monitoring Industry Revenue Million Forecast, by Type of Device 2019 & 2032
- Table 146: Global APAC Patient Monitoring Industry Volume K Units Forecast, by Type of Device 2019 & 2032
- Table 147: Global APAC Patient Monitoring Industry Revenue Million Forecast, by Application 2019 & 2032
- Table 148: Global APAC Patient Monitoring Industry Volume K Units Forecast, by Application 2019 & 2032
- Table 149: Global APAC Patient Monitoring Industry Revenue Million Forecast, by End-Users 2019 & 2032
- Table 150: Global APAC Patient Monitoring Industry Volume K Units Forecast, by End-Users 2019 & 2032
- Table 151: Global APAC Patient Monitoring Industry Revenue Million Forecast, by Geography 2019 & 2032
- Table 152: Global APAC Patient Monitoring Industry Volume K Units Forecast, by Geography 2019 & 2032
- Table 153: Global APAC Patient Monitoring Industry Revenue Million Forecast, by Country 2019 & 2032
- Table 154: Global APAC Patient Monitoring Industry Volume K Units Forecast, by Country 2019 & 2032
Frequently Asked Questions
1. What is the projected Compound Annual Growth Rate (CAGR) of the APAC Patient Monitoring Industry?
The projected CAGR is approximately 7.25%.
2. Which companies are prominent players in the APAC Patient Monitoring Industry?
Key companies in the market include BPL Group, Koninklijke Philips N V, General Electric Company (GE Healthcare), Mindray Medical International Co Ltd, Spacelabs Healthcare, Nihon Kohden Corporation, Dragerwerk AG, Schiller, Siemens Healthcare GmBH.
3. What are the main segments of the APAC Patient Monitoring Industry?
The market segments include Type of Device, Application, End-Users, Geography.
4. Can you provide details about the market size?
The market size is estimated to be USD 9.97 Million as of 2022.
5. What are some drivers contributing to market growth?
Rising Incidences of Chronic Diseases; Increasing Preference for Home and Remote Monitoring.
6. What are the notable trends driving market growth?
Remote Patient Monitoring Devices is Expected to Show a Significant Growth Rate Over the Forecast Period.
7. Are there any restraints impacting market growth?
High Cost of Devices.
8. Can you provide examples of recent developments in the market?
October 2022: Apollo Hospitals launched its indigenously developed automated, rapid-response patient monitoring system. The system is intended to track patient health and proactively warn a team of experts if it foresees an unanticipated decline in that patient's condition.
9. What pricing options are available for accessing the report?
Pricing options include single-user, multi-user, and enterprise licenses priced at USD 4750, USD 5250, and USD 8750 respectively.
10. Is the market size provided in terms of value or volume?
The market size is provided in terms of value, measured in Million and volume, measured in K Units.
11. Are there any specific market keywords associated with the report?
Yes, the market keyword associated with the report is "APAC Patient Monitoring Industry," which aids in identifying and referencing the specific market segment covered.
12. How do I determine which pricing option suits my needs best?
The pricing options vary based on user requirements and access needs. Individual users may opt for single-user licenses, while businesses requiring broader access may choose multi-user or enterprise licenses for cost-effective access to the report.
13. Are there any additional resources or data provided in the APAC Patient Monitoring Industry report?
While the report offers comprehensive insights, it's advisable to review the specific contents or supplementary materials provided to ascertain if additional resources or data are available.
14. How can I stay updated on further developments or reports in the APAC Patient Monitoring Industry?
To stay informed about further developments, trends, and reports in the APAC Patient Monitoring Industry, consider subscribing to industry newsletters, following relevant companies and organizations, or regularly checking reputable industry news sources and publications.
Methodology
Step 1 - Identification of Relevant Samples Size from Population Database


Step 2 - Approaches for Defining Global Market Size (Value, Volume* & Price*)

Note*: In applicable scenarios
Step 3 - Data Sources
Primary Research
- Web Analytics
- Survey Reports
- Research Institute
- Latest Research Reports
- Opinion Leaders
Secondary Research
- Annual Reports
- White Paper
- Latest Press Release
- Industry Association
- Paid Database
- Investor Presentations

Step 4 - Data Triangulation
Involves using different sources of information in order to increase the validity of a study
These sources are likely to be stakeholders in a program - participants, other researchers, program staff, other community members, and so on.
Then we put all data in single framework & apply various statistical tools to find out the dynamic on the market.
During the analysis stage, feedback from the stakeholder groups would be compared to determine areas of agreement as well as areas of divergence
