

Key Insights
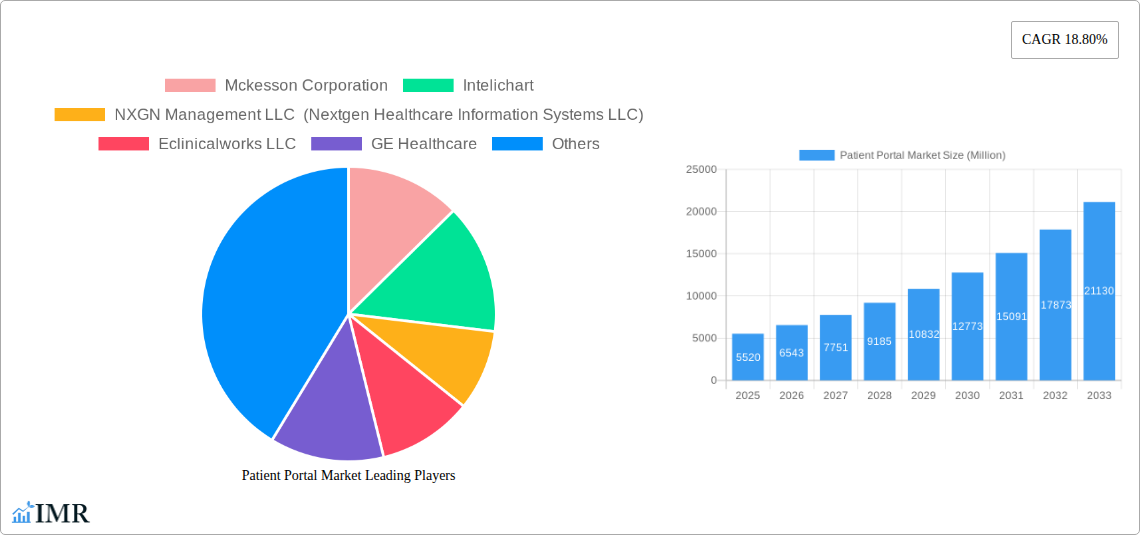
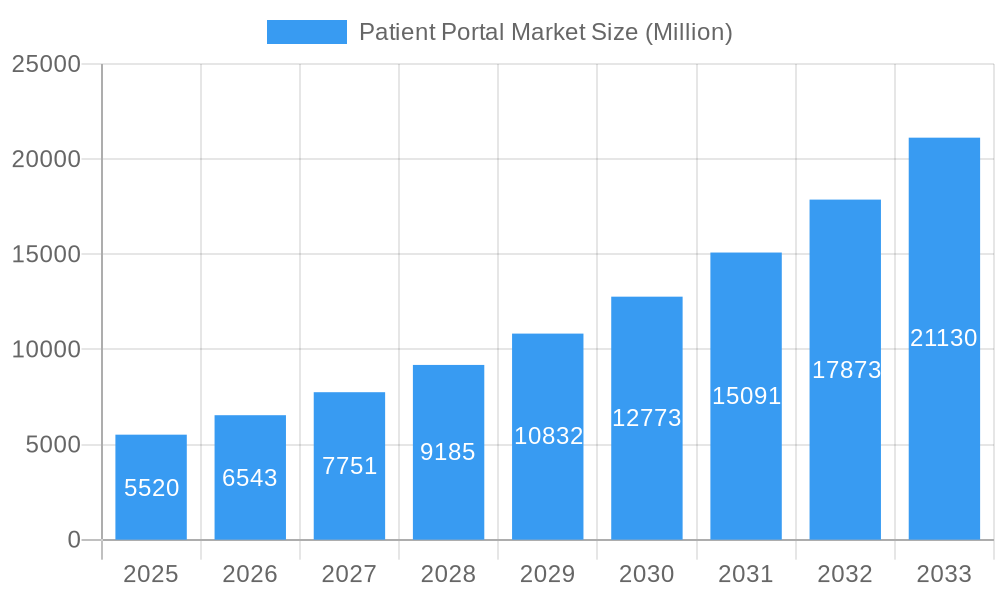
The global Patient Portal market, valued at $5.52 billion in 2025, is projected to experience robust growth, driven by a Compound Annual Growth Rate (CAGR) of 18.80% from 2025 to 2033. This expansion is fueled by several key factors. Increasing adoption of electronic health records (EHRs) and the rising demand for improved patient engagement and remote healthcare access are significant contributors. The shift towards value-based care models further incentivizes providers to utilize patient portals for enhanced communication and care coordination, leading to better patient outcomes and reduced healthcare costs. Furthermore, the integration of telehealth platforms with patient portals is accelerating market growth, facilitating virtual consultations and remote monitoring capabilities. Technological advancements such as improved user interfaces, enhanced security features, and the integration of mobile applications are also playing a crucial role in driving market adoption. The market is segmented by portal type (integrated and standalone), deployment mode (cloud-based, on-premise, and web-based), and end-user (hospitals and clinics, pharmacies, and others). North America currently holds a substantial market share, followed by Europe and the Asia-Pacific region, with growth potential across all geographical segments.
Patient Portal Market Market Size (In Billion)
Competition in the Patient Portal market is intense, with key players including McKesson Corporation, Intelichart, NextGen Healthcare, eClinicalWorks, GE Healthcare, CureMD Healthcare, Epic Corporation, Greenway Health, Oracle (Cerner), Allscripts Healthcare Solutions, and Athenahealth. These companies are constantly innovating to enhance their offerings and gain a competitive edge, focusing on features like advanced analytics, interoperability with other healthcare systems, and personalized patient experiences. The market's future growth will depend on ongoing technological advancements, regulatory changes, and the increasing adoption of digital health solutions globally. Challenges include data security concerns, the need for robust interoperability standards, and the digital literacy gap among certain patient populations. Despite these challenges, the long-term outlook for the Patient Portal market remains positive, indicating significant potential for growth and innovation in the years to come.
Patient Portal Market Company Market Share
Patient Portal Market: A Comprehensive Report (2019-2033)
This comprehensive report provides an in-depth analysis of the Patient Portal Market, encompassing market dynamics, growth trends, regional segmentation, product landscape, key players, and future outlook. The study period covers 2019-2033, with 2025 as the base and estimated year. The forecast period is 2025-2033, and the historical period is 2019-2024. This report is crucial for healthcare IT professionals, investors, and strategists seeking to navigate this rapidly evolving market. The total market size is estimated at xx Million in 2025 and is projected to reach xx Million by 2033.
Patient Portal Market Market Dynamics & Structure
The Patient Portal market is characterized by a moderately consolidated structure, with key players like McKesson Corporation, Epic Corporation Inc, and Cerner Corporation (Oracle) holding significant market share. Technological innovation, driven by the increasing demand for telehealth and remote patient monitoring, is a major driver. Regulatory frameworks, such as HIPAA compliance in the US and GDPR in Europe, heavily influence market dynamics. Competitive substitutes include traditional methods of patient communication, but the convenience and efficiency offered by portals are driving market growth. The end-user demographic is expanding to include a wider range of healthcare providers and patients, fueling market expansion. Mergers and acquisitions (M&A) activity has been moderate, with larger players strategically acquiring smaller companies to enhance their product portfolios and market reach.
- Market Concentration: Moderately consolidated, with top players holding xx% market share in 2025.
- Technological Drivers: Telehealth integration, AI-powered analytics, interoperability advancements.
- Regulatory Landscape: HIPAA, GDPR, and other regional regulations impacting data security and privacy.
- Competitive Substitutes: Traditional communication methods (phone, mail), facing increasing competition from portals.
- End-User Demographics: Expanding beyond hospitals and clinics to include pharmacies and other healthcare settings.
- M&A Activity: Moderate level of activity, driven by strategic expansion and portfolio diversification.
Patient Portal Market Growth Trends & Insights
The Patient Portal market has experienced substantial growth over the past few years, driven by the increasing adoption of electronic health records (EHRs) and the rising demand for convenient and efficient patient engagement solutions. The market size is expected to grow at a Compound Annual Growth Rate (CAGR) of xx% during the forecast period (2025-2033). This growth is fueled by several factors, including the increasing penetration of cloud-based solutions, the growing adoption of mobile health (mHealth) applications, and the rising awareness among patients about the benefits of online access to their healthcare information. The shift towards value-based care models and the increasing focus on patient empowerment are also contributing to market growth. Technological disruptions, such as the integration of artificial intelligence (AI) and machine learning (ML) capabilities into patient portals, are further enhancing their functionality and usability, boosting market adoption.
Dominant Regions, Countries, or Segments in Patient Portal Market
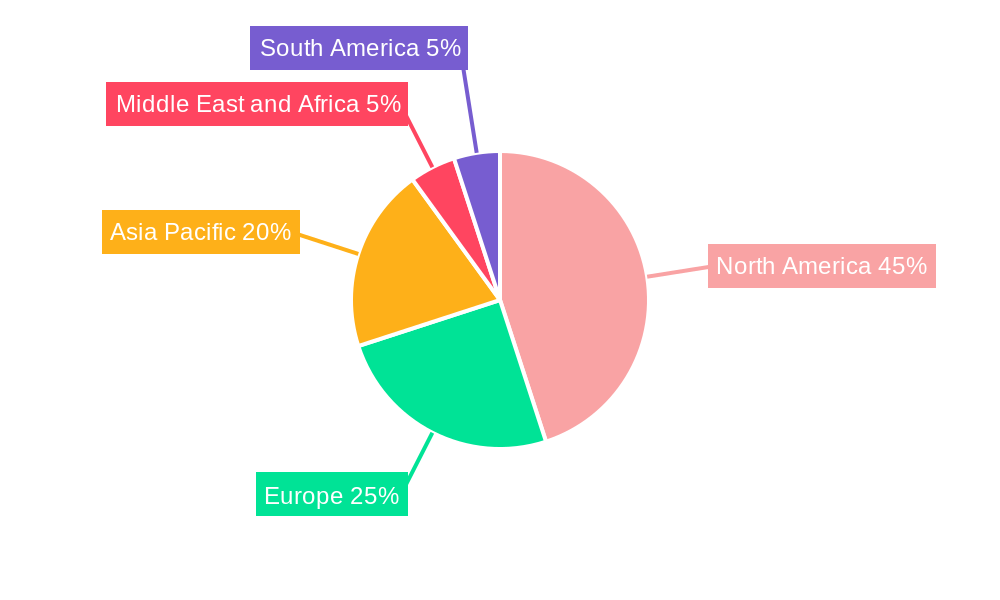
North America currently dominates the Patient Portal market, driven by high healthcare expenditure, advanced technological infrastructure, and the early adoption of EHRs. Within this region, the United States holds the largest market share, followed by Canada. The European market is also witnessing significant growth, with countries like Germany, the UK, and France leading the way. The Asia-Pacific region presents substantial growth opportunities due to increasing healthcare investment and rising smartphone penetration.
- Leading Segment: Integrated Patient Portals are experiencing higher growth rates compared to standalone portals, driven by their enhanced functionality and seamless integration with EHR systems.
- Dominant Deployment Mode: Cloud-based deployment is gaining significant traction due to its scalability, cost-effectiveness, and accessibility.
- Key End-User: Hospitals and clinics constitute the largest segment of end-users, followed by pharmacies and other healthcare settings.
- Regional Drivers: North America (high tech adoption, healthcare expenditure), Europe (strong regulatory framework, digitalization initiatives), Asia-Pacific (rising smartphone penetration, healthcare investments).
Patient Portal Market Product Landscape
Patient portals are continuously evolving, incorporating advanced features such as appointment scheduling, prescription refills, secure messaging, telehealth integration, and remote patient monitoring capabilities. Many portals now incorporate AI-driven functionalities to personalize patient experience, automate tasks, and enhance clinical decision-making. The key selling propositions include improved patient engagement, enhanced communication between patients and providers, streamlined workflows, and better healthcare outcomes.
Key Drivers, Barriers & Challenges in Patient Portal Market
Key Drivers: The increasing adoption of EHRs, rising demand for telehealth solutions, improved patient engagement, and government initiatives promoting the use of technology in healthcare are major drivers. The shift towards value-based care models also incentivizes the use of patient portals to improve patient outcomes and reduce costs.
Challenges: Integration challenges with existing EHR systems, concerns about data security and privacy, and the need for ongoing maintenance and updates pose significant challenges. The high cost of implementation and the lack of technical expertise in some healthcare settings can also hinder adoption.
Emerging Opportunities in Patient Portal Market
Untapped markets in developing countries, integration with wearable devices for continuous patient monitoring, and the development of specialized portals for specific patient populations (e.g., chronic disease management) represent key opportunities. The growing demand for personalized medicine and the increasing focus on preventive care are also creating new avenues for growth.
Growth Accelerators in the Patient Portal Market Industry
Technological advancements such as AI and ML integration, strategic partnerships between healthcare providers and technology companies, and expansion into new geographic markets are expected to accelerate market growth. The increasing adoption of cloud-based solutions and the rising popularity of mobile health applications will further fuel market expansion.
Key Players Shaping the Patient Portal Market Market
Notable Milestones in Patient Portal Market Sector
- March 2022: Tata Elxsi launched TEngage, a cloud-based digital health platform for unified patient experience.
- November 2022: Valant launched MYIO, a behavioral health-specific patient engagement mobile app.
In-Depth Patient Portal Market Market Outlook
The Patient Portal market is poised for significant growth in the coming years, driven by the convergence of several factors including increasing digital health adoption, rising demand for convenient healthcare access, and ongoing technological advancements. Strategic partnerships, expansion into new markets, and product innovation will be key factors in shaping future market dynamics. The market presents attractive opportunities for companies that can offer innovative, secure, and user-friendly patient portal solutions that cater to the evolving needs of healthcare providers and patients.
Patient Portal Market Segmentation
-
1. Portal
- 1.1. Integrated Patient Portal
- 1.2. Standalone Patient Portal
-
2. Deployment Mode
- 2.1. Cloud-based
- 2.2. On-Premise and Web-based
-
3. End-User
- 3.1. Hospitals and Clinics
- 3.2. Pharmacies
- 3.3. Other End-Users
Patient Portal Market Segmentation By Geography
-
1. North America
- 1.1. United States
- 1.2. Canada
- 1.3. Mexico
-
2. Europe
- 2.1. United Kingdom
- 2.2. Germany
- 2.3. France
- 2.4. Italy
- 2.5. Spain
- 2.6. Rest of Europe
-
3. Asia Pacific
- 3.1. China
- 3.2. Japan
- 3.3. India
- 3.4. Australia
- 3.5. South Korea
- 3.6. Rest of Asia Pacific
-
4. Middle East and Africa
- 4.1. GCC
- 4.2. South Africa
- 4.3. Rest of Middle East and Africa
-
5. South America
- 5.1. Brazil
- 5.2. Argentina
- 5.3. Rest of South America
Patient Portal Market Regional Market Share
Geographic Coverage of Patient Portal Market
Patient Portal Market REPORT HIGHLIGHTS
| Aspects | Details |
|---|---|
| Study Period | 2020-2034 |
| Base Year | 2025 |
| Estimated Year | 2026 |
| Forecast Period | 2026-2034 |
| Historical Period | 2020-2025 |
| Growth Rate | CAGR of 18.80% from 2020-2034 |
| Segmentation |
|
Table of Contents
- 1. Introduction
- 1.1. Research Scope
- 1.2. Market Segmentation
- 1.3. Research Objective
- 1.4. Definitions and Assumptions
- 2. Executive Summary
- 2.1. Market Snapshot
- 3. Market Dynamics
- 3.1. Market Drivers
- 3.2. Market Restrains
- 3.3. Market Trends
- 3.4. Market Opportunities
- 4. Market Factor Analysis
- 4.1. Porters Five Forces
- 4.1.1. Bargaining Power of Suppliers
- 4.1.2. Bargaining Power of Buyers
- 4.1.3. Threat of New Entrants
- 4.1.4. Threat of Substitutes
- 4.1.5. Competitive Rivalry
- 4.2. PESTEL analysis
- 4.3. BCG Analysis
- 4.3.1. Stars (High Growth, High Market Share)
- 4.3.2. Cash Cows (Low Growth, High Market Share)
- 4.3.3. Question Mark (High Growth, Low Market Share)
- 4.3.4. Dogs (Low Growth, Low Market Share)
- 4.4. Ansoff Matrix Analysis
- 4.5. Supply Chain Analysis
- 4.6. Regulatory Landscape
- 4.7. Current Market Potential and Opportunity Assessment (TAM–SAM–SOM Framework)
- 4.8. IMR Analyst Note
- 4.1. Porters Five Forces
- 5. Market Analysis, Insights and Forecast 2021-2033
- 5.1. Market Analysis, Insights and Forecast - by Portal
- 5.1.1. Integrated Patient Portal
- 5.1.2. Standalone Patient Portal
- 5.2. Market Analysis, Insights and Forecast - by Deployment Mode
- 5.2.1. Cloud-based
- 5.2.2. On-Premise and Web-based
- 5.3. Market Analysis, Insights and Forecast - by End-User
- 5.3.1. Hospitals and Clinics
- 5.3.2. Pharmacies
- 5.3.3. Other End-Users
- 5.4. Market Analysis, Insights and Forecast - by Region
- 5.4.1. North America
- 5.4.2. Europe
- 5.4.3. Asia Pacific
- 5.4.4. Middle East and Africa
- 5.4.5. South America
- 5.1. Market Analysis, Insights and Forecast - by Portal
- 6. Global Patient Portal Market Analysis, Insights and Forecast, 2021-2033
- 6.1. Market Analysis, Insights and Forecast - by Portal
- 6.1.1. Integrated Patient Portal
- 6.1.2. Standalone Patient Portal
- 6.2. Market Analysis, Insights and Forecast - by Deployment Mode
- 6.2.1. Cloud-based
- 6.2.2. On-Premise and Web-based
- 6.3. Market Analysis, Insights and Forecast - by End-User
- 6.3.1. Hospitals and Clinics
- 6.3.2. Pharmacies
- 6.3.3. Other End-Users
- 6.1. Market Analysis, Insights and Forecast - by Portal
- 7. North America Patient Portal Market Analysis, Insights and Forecast, 2020-2032
- 7.1. Market Analysis, Insights and Forecast - by Portal
- 7.1.1. Integrated Patient Portal
- 7.1.2. Standalone Patient Portal
- 7.2. Market Analysis, Insights and Forecast - by Deployment Mode
- 7.2.1. Cloud-based
- 7.2.2. On-Premise and Web-based
- 7.3. Market Analysis, Insights and Forecast - by End-User
- 7.3.1. Hospitals and Clinics
- 7.3.2. Pharmacies
- 7.3.3. Other End-Users
- 7.1. Market Analysis, Insights and Forecast - by Portal
- 8. Europe Patient Portal Market Analysis, Insights and Forecast, 2020-2032
- 8.1. Market Analysis, Insights and Forecast - by Portal
- 8.1.1. Integrated Patient Portal
- 8.1.2. Standalone Patient Portal
- 8.2. Market Analysis, Insights and Forecast - by Deployment Mode
- 8.2.1. Cloud-based
- 8.2.2. On-Premise and Web-based
- 8.3. Market Analysis, Insights and Forecast - by End-User
- 8.3.1. Hospitals and Clinics
- 8.3.2. Pharmacies
- 8.3.3. Other End-Users
- 8.1. Market Analysis, Insights and Forecast - by Portal
- 9. Asia Pacific Patient Portal Market Analysis, Insights and Forecast, 2020-2032
- 9.1. Market Analysis, Insights and Forecast - by Portal
- 9.1.1. Integrated Patient Portal
- 9.1.2. Standalone Patient Portal
- 9.2. Market Analysis, Insights and Forecast - by Deployment Mode
- 9.2.1. Cloud-based
- 9.2.2. On-Premise and Web-based
- 9.3. Market Analysis, Insights and Forecast - by End-User
- 9.3.1. Hospitals and Clinics
- 9.3.2. Pharmacies
- 9.3.3. Other End-Users
- 9.1. Market Analysis, Insights and Forecast - by Portal
- 10. Middle East and Africa Patient Portal Market Analysis, Insights and Forecast, 2020-2032
- 10.1. Market Analysis, Insights and Forecast - by Portal
- 10.1.1. Integrated Patient Portal
- 10.1.2. Standalone Patient Portal
- 10.2. Market Analysis, Insights and Forecast - by Deployment Mode
- 10.2.1. Cloud-based
- 10.2.2. On-Premise and Web-based
- 10.3. Market Analysis, Insights and Forecast - by End-User
- 10.3.1. Hospitals and Clinics
- 10.3.2. Pharmacies
- 10.3.3. Other End-Users
- 10.1. Market Analysis, Insights and Forecast - by Portal
- 11. South America Patient Portal Market Analysis, Insights and Forecast, 2020-2032
- 11.1. Market Analysis, Insights and Forecast - by Portal
- 11.1.1. Integrated Patient Portal
- 11.1.2. Standalone Patient Portal
- 11.2. Market Analysis, Insights and Forecast - by Deployment Mode
- 11.2.1. Cloud-based
- 11.2.2. On-Premise and Web-based
- 11.3. Market Analysis, Insights and Forecast - by End-User
- 11.3.1. Hospitals and Clinics
- 11.3.2. Pharmacies
- 11.3.3. Other End-Users
- 11.1. Market Analysis, Insights and Forecast - by Portal
- 12. Competitive Analysis
- 12.1. Company Profiles
- 12.1.1 Mckesson Corporation
- 12.1.1.1. Company Overview
- 12.1.1.2. Products
- 12.1.1.3. Company Financials
- 12.1.1.4. SWOT Analysis
- 12.1.2 Intelichart
- 12.1.2.1. Company Overview
- 12.1.2.2. Products
- 12.1.2.3. Company Financials
- 12.1.2.4. SWOT Analysis
- 12.1.3 NXGN Management LLC (Nextgen Healthcare Information Systems LLC)
- 12.1.3.1. Company Overview
- 12.1.3.2. Products
- 12.1.3.3. Company Financials
- 12.1.3.4. SWOT Analysis
- 12.1.4 Eclinicalworks LLC
- 12.1.4.1. Company Overview
- 12.1.4.2. Products
- 12.1.4.3. Company Financials
- 12.1.4.4. SWOT Analysis
- 12.1.5 GE Healthcare
- 12.1.5.1. Company Overview
- 12.1.5.2. Products
- 12.1.5.3. Company Financials
- 12.1.5.4. SWOT Analysis
- 12.1.6 Curemd Healthcare
- 12.1.6.1. Company Overview
- 12.1.6.2. Products
- 12.1.6.3. Company Financials
- 12.1.6.4. SWOT Analysis
- 12.1.7 Epic Corporation Inc
- 12.1.7.1. Company Overview
- 12.1.7.2. Products
- 12.1.7.3. Company Financials
- 12.1.7.4. SWOT Analysis
- 12.1.8 Greenway Health LLC
- 12.1.8.1. Company Overview
- 12.1.8.2. Products
- 12.1.8.3. Company Financials
- 12.1.8.4. SWOT Analysis
- 12.1.9 Oracle (Cerner Corporation)
- 12.1.9.1. Company Overview
- 12.1.9.2. Products
- 12.1.9.3. Company Financials
- 12.1.9.4. SWOT Analysis
- 12.1.10 Allscripts Healthcare Solutions Inc
- 12.1.10.1. Company Overview
- 12.1.10.2. Products
- 12.1.10.3. Company Financials
- 12.1.10.4. SWOT Analysis
- 12.1.11 Athenahealth Inc
- 12.1.11.1. Company Overview
- 12.1.11.2. Products
- 12.1.11.3. Company Financials
- 12.1.11.4. SWOT Analysis
- 12.1.1 Mckesson Corporation
- 12.2. Market Entropy
- 12.2.1 Company's Key Areas Served
- 12.2.2 Recent Developments
- 12.3. Company Market Share Analysis 2025
- 12.3.1 Top 5 Companies Market Share Analysis
- 12.3.2 Top 3 Companies Market Share Analysis
- 12.4. List of Potential Customers
- 13. Research Methodology
List of Figures
- Figure 1: Global Patient Portal Market Revenue Breakdown (Million, %) by Region 2025 & 2033
- Figure 2: Global Patient Portal Market Volume Breakdown (K Unit, %) by Region 2025 & 2033
- Figure 3: North America Patient Portal Market Revenue (Million), by Portal 2025 & 2033
- Figure 4: North America Patient Portal Market Volume (K Unit), by Portal 2025 & 2033
- Figure 5: North America Patient Portal Market Revenue Share (%), by Portal 2025 & 2033
- Figure 6: North America Patient Portal Market Volume Share (%), by Portal 2025 & 2033
- Figure 7: North America Patient Portal Market Revenue (Million), by Deployment Mode 2025 & 2033
- Figure 8: North America Patient Portal Market Volume (K Unit), by Deployment Mode 2025 & 2033
- Figure 9: North America Patient Portal Market Revenue Share (%), by Deployment Mode 2025 & 2033
- Figure 10: North America Patient Portal Market Volume Share (%), by Deployment Mode 2025 & 2033
- Figure 11: North America Patient Portal Market Revenue (Million), by End-User 2025 & 2033
- Figure 12: North America Patient Portal Market Volume (K Unit), by End-User 2025 & 2033
- Figure 13: North America Patient Portal Market Revenue Share (%), by End-User 2025 & 2033
- Figure 14: North America Patient Portal Market Volume Share (%), by End-User 2025 & 2033
- Figure 15: North America Patient Portal Market Revenue (Million), by Country 2025 & 2033
- Figure 16: North America Patient Portal Market Volume (K Unit), by Country 2025 & 2033
- Figure 17: North America Patient Portal Market Revenue Share (%), by Country 2025 & 2033
- Figure 18: North America Patient Portal Market Volume Share (%), by Country 2025 & 2033
- Figure 19: Europe Patient Portal Market Revenue (Million), by Portal 2025 & 2033
- Figure 20: Europe Patient Portal Market Volume (K Unit), by Portal 2025 & 2033
- Figure 21: Europe Patient Portal Market Revenue Share (%), by Portal 2025 & 2033
- Figure 22: Europe Patient Portal Market Volume Share (%), by Portal 2025 & 2033
- Figure 23: Europe Patient Portal Market Revenue (Million), by Deployment Mode 2025 & 2033
- Figure 24: Europe Patient Portal Market Volume (K Unit), by Deployment Mode 2025 & 2033
- Figure 25: Europe Patient Portal Market Revenue Share (%), by Deployment Mode 2025 & 2033
- Figure 26: Europe Patient Portal Market Volume Share (%), by Deployment Mode 2025 & 2033
- Figure 27: Europe Patient Portal Market Revenue (Million), by End-User 2025 & 2033
- Figure 28: Europe Patient Portal Market Volume (K Unit), by End-User 2025 & 2033
- Figure 29: Europe Patient Portal Market Revenue Share (%), by End-User 2025 & 2033
- Figure 30: Europe Patient Portal Market Volume Share (%), by End-User 2025 & 2033
- Figure 31: Europe Patient Portal Market Revenue (Million), by Country 2025 & 2033
- Figure 32: Europe Patient Portal Market Volume (K Unit), by Country 2025 & 2033
- Figure 33: Europe Patient Portal Market Revenue Share (%), by Country 2025 & 2033
- Figure 34: Europe Patient Portal Market Volume Share (%), by Country 2025 & 2033
- Figure 35: Asia Pacific Patient Portal Market Revenue (Million), by Portal 2025 & 2033
- Figure 36: Asia Pacific Patient Portal Market Volume (K Unit), by Portal 2025 & 2033
- Figure 37: Asia Pacific Patient Portal Market Revenue Share (%), by Portal 2025 & 2033
- Figure 38: Asia Pacific Patient Portal Market Volume Share (%), by Portal 2025 & 2033
- Figure 39: Asia Pacific Patient Portal Market Revenue (Million), by Deployment Mode 2025 & 2033
- Figure 40: Asia Pacific Patient Portal Market Volume (K Unit), by Deployment Mode 2025 & 2033
- Figure 41: Asia Pacific Patient Portal Market Revenue Share (%), by Deployment Mode 2025 & 2033
- Figure 42: Asia Pacific Patient Portal Market Volume Share (%), by Deployment Mode 2025 & 2033
- Figure 43: Asia Pacific Patient Portal Market Revenue (Million), by End-User 2025 & 2033
- Figure 44: Asia Pacific Patient Portal Market Volume (K Unit), by End-User 2025 & 2033
- Figure 45: Asia Pacific Patient Portal Market Revenue Share (%), by End-User 2025 & 2033
- Figure 46: Asia Pacific Patient Portal Market Volume Share (%), by End-User 2025 & 2033
- Figure 47: Asia Pacific Patient Portal Market Revenue (Million), by Country 2025 & 2033
- Figure 48: Asia Pacific Patient Portal Market Volume (K Unit), by Country 2025 & 2033
- Figure 49: Asia Pacific Patient Portal Market Revenue Share (%), by Country 2025 & 2033
- Figure 50: Asia Pacific Patient Portal Market Volume Share (%), by Country 2025 & 2033
- Figure 51: Middle East and Africa Patient Portal Market Revenue (Million), by Portal 2025 & 2033
- Figure 52: Middle East and Africa Patient Portal Market Volume (K Unit), by Portal 2025 & 2033
- Figure 53: Middle East and Africa Patient Portal Market Revenue Share (%), by Portal 2025 & 2033
- Figure 54: Middle East and Africa Patient Portal Market Volume Share (%), by Portal 2025 & 2033
- Figure 55: Middle East and Africa Patient Portal Market Revenue (Million), by Deployment Mode 2025 & 2033
- Figure 56: Middle East and Africa Patient Portal Market Volume (K Unit), by Deployment Mode 2025 & 2033
- Figure 57: Middle East and Africa Patient Portal Market Revenue Share (%), by Deployment Mode 2025 & 2033
- Figure 58: Middle East and Africa Patient Portal Market Volume Share (%), by Deployment Mode 2025 & 2033
- Figure 59: Middle East and Africa Patient Portal Market Revenue (Million), by End-User 2025 & 2033
- Figure 60: Middle East and Africa Patient Portal Market Volume (K Unit), by End-User 2025 & 2033
- Figure 61: Middle East and Africa Patient Portal Market Revenue Share (%), by End-User 2025 & 2033
- Figure 62: Middle East and Africa Patient Portal Market Volume Share (%), by End-User 2025 & 2033
- Figure 63: Middle East and Africa Patient Portal Market Revenue (Million), by Country 2025 & 2033
- Figure 64: Middle East and Africa Patient Portal Market Volume (K Unit), by Country 2025 & 2033
- Figure 65: Middle East and Africa Patient Portal Market Revenue Share (%), by Country 2025 & 2033
- Figure 66: Middle East and Africa Patient Portal Market Volume Share (%), by Country 2025 & 2033
- Figure 67: South America Patient Portal Market Revenue (Million), by Portal 2025 & 2033
- Figure 68: South America Patient Portal Market Volume (K Unit), by Portal 2025 & 2033
- Figure 69: South America Patient Portal Market Revenue Share (%), by Portal 2025 & 2033
- Figure 70: South America Patient Portal Market Volume Share (%), by Portal 2025 & 2033
- Figure 71: South America Patient Portal Market Revenue (Million), by Deployment Mode 2025 & 2033
- Figure 72: South America Patient Portal Market Volume (K Unit), by Deployment Mode 2025 & 2033
- Figure 73: South America Patient Portal Market Revenue Share (%), by Deployment Mode 2025 & 2033
- Figure 74: South America Patient Portal Market Volume Share (%), by Deployment Mode 2025 & 2033
- Figure 75: South America Patient Portal Market Revenue (Million), by End-User 2025 & 2033
- Figure 76: South America Patient Portal Market Volume (K Unit), by End-User 2025 & 2033
- Figure 77: South America Patient Portal Market Revenue Share (%), by End-User 2025 & 2033
- Figure 78: South America Patient Portal Market Volume Share (%), by End-User 2025 & 2033
- Figure 79: South America Patient Portal Market Revenue (Million), by Country 2025 & 2033
- Figure 80: South America Patient Portal Market Volume (K Unit), by Country 2025 & 2033
- Figure 81: South America Patient Portal Market Revenue Share (%), by Country 2025 & 2033
- Figure 82: South America Patient Portal Market Volume Share (%), by Country 2025 & 2033
List of Tables
- Table 1: Global Patient Portal Market Revenue Million Forecast, by Portal 2020 & 2033
- Table 2: Global Patient Portal Market Volume K Unit Forecast, by Portal 2020 & 2033
- Table 3: Global Patient Portal Market Revenue Million Forecast, by Deployment Mode 2020 & 2033
- Table 4: Global Patient Portal Market Volume K Unit Forecast, by Deployment Mode 2020 & 2033
- Table 5: Global Patient Portal Market Revenue Million Forecast, by End-User 2020 & 2033
- Table 6: Global Patient Portal Market Volume K Unit Forecast, by End-User 2020 & 2033
- Table 7: Global Patient Portal Market Revenue Million Forecast, by Region 2020 & 2033
- Table 8: Global Patient Portal Market Volume K Unit Forecast, by Region 2020 & 2033
- Table 9: Global Patient Portal Market Revenue Million Forecast, by Portal 2020 & 2033
- Table 10: Global Patient Portal Market Volume K Unit Forecast, by Portal 2020 & 2033
- Table 11: Global Patient Portal Market Revenue Million Forecast, by Deployment Mode 2020 & 2033
- Table 12: Global Patient Portal Market Volume K Unit Forecast, by Deployment Mode 2020 & 2033
- Table 13: Global Patient Portal Market Revenue Million Forecast, by End-User 2020 & 2033
- Table 14: Global Patient Portal Market Volume K Unit Forecast, by End-User 2020 & 2033
- Table 15: Global Patient Portal Market Revenue Million Forecast, by Country 2020 & 2033
- Table 16: Global Patient Portal Market Volume K Unit Forecast, by Country 2020 & 2033
- Table 17: United States Patient Portal Market Revenue (Million) Forecast, by Application 2020 & 2033
- Table 18: United States Patient Portal Market Volume (K Unit) Forecast, by Application 2020 & 2033
- Table 19: Canada Patient Portal Market Revenue (Million) Forecast, by Application 2020 & 2033
- Table 20: Canada Patient Portal Market Volume (K Unit) Forecast, by Application 2020 & 2033
- Table 21: Mexico Patient Portal Market Revenue (Million) Forecast, by Application 2020 & 2033
- Table 22: Mexico Patient Portal Market Volume (K Unit) Forecast, by Application 2020 & 2033
- Table 23: Global Patient Portal Market Revenue Million Forecast, by Portal 2020 & 2033
- Table 24: Global Patient Portal Market Volume K Unit Forecast, by Portal 2020 & 2033
- Table 25: Global Patient Portal Market Revenue Million Forecast, by Deployment Mode 2020 & 2033
- Table 26: Global Patient Portal Market Volume K Unit Forecast, by Deployment Mode 2020 & 2033
- Table 27: Global Patient Portal Market Revenue Million Forecast, by End-User 2020 & 2033
- Table 28: Global Patient Portal Market Volume K Unit Forecast, by End-User 2020 & 2033
- Table 29: Global Patient Portal Market Revenue Million Forecast, by Country 2020 & 2033
- Table 30: Global Patient Portal Market Volume K Unit Forecast, by Country 2020 & 2033
- Table 31: United Kingdom Patient Portal Market Revenue (Million) Forecast, by Application 2020 & 2033
- Table 32: United Kingdom Patient Portal Market Volume (K Unit) Forecast, by Application 2020 & 2033
- Table 33: Germany Patient Portal Market Revenue (Million) Forecast, by Application 2020 & 2033
- Table 34: Germany Patient Portal Market Volume (K Unit) Forecast, by Application 2020 & 2033
- Table 35: France Patient Portal Market Revenue (Million) Forecast, by Application 2020 & 2033
- Table 36: France Patient Portal Market Volume (K Unit) Forecast, by Application 2020 & 2033
- Table 37: Italy Patient Portal Market Revenue (Million) Forecast, by Application 2020 & 2033
- Table 38: Italy Patient Portal Market Volume (K Unit) Forecast, by Application 2020 & 2033
- Table 39: Spain Patient Portal Market Revenue (Million) Forecast, by Application 2020 & 2033
- Table 40: Spain Patient Portal Market Volume (K Unit) Forecast, by Application 2020 & 2033
- Table 41: Rest of Europe Patient Portal Market Revenue (Million) Forecast, by Application 2020 & 2033
- Table 42: Rest of Europe Patient Portal Market Volume (K Unit) Forecast, by Application 2020 & 2033
- Table 43: Global Patient Portal Market Revenue Million Forecast, by Portal 2020 & 2033
- Table 44: Global Patient Portal Market Volume K Unit Forecast, by Portal 2020 & 2033
- Table 45: Global Patient Portal Market Revenue Million Forecast, by Deployment Mode 2020 & 2033
- Table 46: Global Patient Portal Market Volume K Unit Forecast, by Deployment Mode 2020 & 2033
- Table 47: Global Patient Portal Market Revenue Million Forecast, by End-User 2020 & 2033
- Table 48: Global Patient Portal Market Volume K Unit Forecast, by End-User 2020 & 2033
- Table 49: Global Patient Portal Market Revenue Million Forecast, by Country 2020 & 2033
- Table 50: Global Patient Portal Market Volume K Unit Forecast, by Country 2020 & 2033
- Table 51: China Patient Portal Market Revenue (Million) Forecast, by Application 2020 & 2033
- Table 52: China Patient Portal Market Volume (K Unit) Forecast, by Application 2020 & 2033
- Table 53: Japan Patient Portal Market Revenue (Million) Forecast, by Application 2020 & 2033
- Table 54: Japan Patient Portal Market Volume (K Unit) Forecast, by Application 2020 & 2033
- Table 55: India Patient Portal Market Revenue (Million) Forecast, by Application 2020 & 2033
- Table 56: India Patient Portal Market Volume (K Unit) Forecast, by Application 2020 & 2033
- Table 57: Australia Patient Portal Market Revenue (Million) Forecast, by Application 2020 & 2033
- Table 58: Australia Patient Portal Market Volume (K Unit) Forecast, by Application 2020 & 2033
- Table 59: South Korea Patient Portal Market Revenue (Million) Forecast, by Application 2020 & 2033
- Table 60: South Korea Patient Portal Market Volume (K Unit) Forecast, by Application 2020 & 2033
- Table 61: Rest of Asia Pacific Patient Portal Market Revenue (Million) Forecast, by Application 2020 & 2033
- Table 62: Rest of Asia Pacific Patient Portal Market Volume (K Unit) Forecast, by Application 2020 & 2033
- Table 63: Global Patient Portal Market Revenue Million Forecast, by Portal 2020 & 2033
- Table 64: Global Patient Portal Market Volume K Unit Forecast, by Portal 2020 & 2033
- Table 65: Global Patient Portal Market Revenue Million Forecast, by Deployment Mode 2020 & 2033
- Table 66: Global Patient Portal Market Volume K Unit Forecast, by Deployment Mode 2020 & 2033
- Table 67: Global Patient Portal Market Revenue Million Forecast, by End-User 2020 & 2033
- Table 68: Global Patient Portal Market Volume K Unit Forecast, by End-User 2020 & 2033
- Table 69: Global Patient Portal Market Revenue Million Forecast, by Country 2020 & 2033
- Table 70: Global Patient Portal Market Volume K Unit Forecast, by Country 2020 & 2033
- Table 71: GCC Patient Portal Market Revenue (Million) Forecast, by Application 2020 & 2033
- Table 72: GCC Patient Portal Market Volume (K Unit) Forecast, by Application 2020 & 2033
- Table 73: South Africa Patient Portal Market Revenue (Million) Forecast, by Application 2020 & 2033
- Table 74: South Africa Patient Portal Market Volume (K Unit) Forecast, by Application 2020 & 2033
- Table 75: Rest of Middle East and Africa Patient Portal Market Revenue (Million) Forecast, by Application 2020 & 2033
- Table 76: Rest of Middle East and Africa Patient Portal Market Volume (K Unit) Forecast, by Application 2020 & 2033
- Table 77: Global Patient Portal Market Revenue Million Forecast, by Portal 2020 & 2033
- Table 78: Global Patient Portal Market Volume K Unit Forecast, by Portal 2020 & 2033
- Table 79: Global Patient Portal Market Revenue Million Forecast, by Deployment Mode 2020 & 2033
- Table 80: Global Patient Portal Market Volume K Unit Forecast, by Deployment Mode 2020 & 2033
- Table 81: Global Patient Portal Market Revenue Million Forecast, by End-User 2020 & 2033
- Table 82: Global Patient Portal Market Volume K Unit Forecast, by End-User 2020 & 2033
- Table 83: Global Patient Portal Market Revenue Million Forecast, by Country 2020 & 2033
- Table 84: Global Patient Portal Market Volume K Unit Forecast, by Country 2020 & 2033
- Table 85: Brazil Patient Portal Market Revenue (Million) Forecast, by Application 2020 & 2033
- Table 86: Brazil Patient Portal Market Volume (K Unit) Forecast, by Application 2020 & 2033
- Table 87: Argentina Patient Portal Market Revenue (Million) Forecast, by Application 2020 & 2033
- Table 88: Argentina Patient Portal Market Volume (K Unit) Forecast, by Application 2020 & 2033
- Table 89: Rest of South America Patient Portal Market Revenue (Million) Forecast, by Application 2020 & 2033
- Table 90: Rest of South America Patient Portal Market Volume (K Unit) Forecast, by Application 2020 & 2033
Frequently Asked Questions
1. What is the projected Compound Annual Growth Rate (CAGR) of the Patient Portal Market?
The projected CAGR is approximately 18.80%.
2. Which companies are prominent players in the Patient Portal Market?
Key companies in the market include Mckesson Corporation, Intelichart, NXGN Management LLC (Nextgen Healthcare Information Systems LLC), Eclinicalworks LLC, GE Healthcare, Curemd Healthcare, Epic Corporation Inc, Greenway Health LLC, Oracle (Cerner Corporation), Allscripts Healthcare Solutions Inc, Athenahealth Inc.
3. What are the main segments of the Patient Portal Market?
The market segments include Portal, Deployment Mode, End-User.
4. Can you provide details about the market size?
The market size is estimated to be USD 5.52 Million as of 2022.
5. What are some drivers contributing to market growth?
Increased Adoption of Patient-centric Approach by Healthcare Payers; Increase in the Demand for Electronic Health Records (EHRs); Favorable Government Funding Policies and Initiatives for Implementing Healthcare IT Solutions.
6. What are the notable trends driving market growth?
Integrated Patient Portal Holds the Largest Share in the Portal Segment expected to hold a major market share in the Patient Portalmarket.
7. Are there any restraints impacting market growth?
Data Privacy and Security Concerns; High Cost of Implementation and Deployment.
8. Can you provide examples of recent developments in the market?
November 2022- Valant launched MYIO, the first all-in-one behavioral health-specific patient engagement mobile app. By eliminating the need for manual patient data entry into numerous systems, MYIO assists behavioral healthcare practices in increasing operational effectiveness.
9. What pricing options are available for accessing the report?
Pricing options include single-user, multi-user, and enterprise licenses priced at USD 4750, USD 5250, and USD 8750 respectively.
10. Is the market size provided in terms of value or volume?
The market size is provided in terms of value, measured in Million and volume, measured in K Unit.
11. Are there any specific market keywords associated with the report?
Yes, the market keyword associated with the report is "Patient Portal Market," which aids in identifying and referencing the specific market segment covered.
12. How do I determine which pricing option suits my needs best?
The pricing options vary based on user requirements and access needs. Individual users may opt for single-user licenses, while businesses requiring broader access may choose multi-user or enterprise licenses for cost-effective access to the report.
13. Are there any additional resources or data provided in the Patient Portal Market report?
While the report offers comprehensive insights, it's advisable to review the specific contents or supplementary materials provided to ascertain if additional resources or data are available.
14. How can I stay updated on further developments or reports in the Patient Portal Market?
To stay informed about further developments, trends, and reports in the Patient Portal Market, consider subscribing to industry newsletters, following relevant companies and organizations, or regularly checking reputable industry news sources and publications.
Methodology
Step 1 - Identification of Relevant Samples Size from Population Database


Step 2 - Approaches for Defining Global Market Size (Value, Volume* & Price*)

Note*: In applicable scenarios
Step 3 - Data Sources
Primary Research
- Web Analytics
- Survey Reports
- Research Institute
- Latest Research Reports
- Opinion Leaders
Secondary Research
- Annual Reports
- White Paper
- Latest Press Release
- Industry Association
- Paid Database
- Investor Presentations

Step 4 - Data Triangulation
Involves using different sources of information in order to increase the validity of a study
These sources are likely to be stakeholders in a program - participants, other researchers, program staff, other community members, and so on.
Then we put all data in single framework & apply various statistical tools to find out the dynamic on the market.
During the analysis stage, feedback from the stakeholder groups would be compared to determine areas of agreement as well as areas of divergence