

Key Insights
The Asia-Pacific (APAC) sports nutrition market, a dynamic and rapidly expanding sector, is projected to experience robust growth driven by several key factors. Rising health consciousness, increasing disposable incomes, and a surge in participation in fitness activities and sports across the region are fueling demand for sports food, drinks, and supplements. The increasing prevalence of chronic diseases like obesity and diabetes is also driving consumers towards healthier lifestyle choices, including the adoption of sports nutrition products. Further stimulating growth is the burgeoning e-commerce sector, providing convenient access to a wider range of products for consumers in even the most remote areas. Significant growth is expected from countries like China, India, and Japan, fueled by their large and increasingly affluent populations adopting Westernized fitness and wellness trends. However, challenges remain, including fluctuating raw material prices and the prevalence of counterfeit products which can impact consumer confidence.
Despite these challenges, the market's growth trajectory is largely positive. Product diversification, including the introduction of innovative and functional sports nutrition products catering to specific dietary needs and preferences, is expected to drive future expansion. Strategic partnerships between sports nutrition brands and fitness influencers, coupled with targeted marketing campaigns focusing on the health benefits of these products, will likely play a crucial role in expanding market penetration. The segment comprising sports supplements is likely to exhibit faster growth compared to sports food and drinks, driven by the rising demand for specialized products enhancing performance and recovery. The online distribution channel will likely witness the highest growth, benefiting from the rising adoption of e-commerce and the expanding reach of online retailers within the APAC region. Therefore, sustained growth in the APAC sports nutrition market is anticipated throughout the forecast period, driven by evolving consumer preferences, technological advancements, and strategic industry initiatives.
APAC Sports Nutrition Industry Market Report: 2019-2033
This comprehensive report provides a detailed analysis of the Asia-Pacific (APAC) sports nutrition industry, covering market dynamics, growth trends, key players, and future outlook. With a study period spanning 2019-2033, a base year of 2025, and a forecast period of 2025-2033, this report offers invaluable insights for industry professionals, investors, and strategic decision-makers. The report uses Million units as the measurement for all values.
APAC Sports Nutrition Industry Market Dynamics & Structure
The APAC sports nutrition market exhibits a dynamic landscape characterized by increasing market concentration, driven by the expansion of multinational players and the consolidation of smaller regional brands. Technological innovation, particularly in product formulation and delivery systems (e.g., personalized nutrition, advanced protein sources), is a key growth driver. Regulatory frameworks, varying across APAC nations, influence product development and marketing strategies. Competitive pressures from food and beverage giants diversifying into the sector, along with the presence of substitute products (e.g., traditional dietary supplements), necessitate continuous innovation. Consumer demographics, especially the rise of health-conscious millennials and Gen Z, are fueling demand. M&A activity within the sector has been significant, with xx deals recorded between 2019 and 2024, representing an average annual deal volume of xx.
- Market Concentration: High, with leading players holding xx% market share in 2024.
- Technological Innovation: Focus on personalized nutrition, functional ingredients, and convenient formats.
- Regulatory Landscape: Diverse and evolving across APAC, posing challenges for standardization.
- Competitive Substitutes: Traditional dietary supplements and functional foods.
- End-User Demographics: Growing health awareness among millennials and Gen Z, driving demand.
- M&A Activity: Significant consolidation, with xx deals recorded between 2019 and 2024.
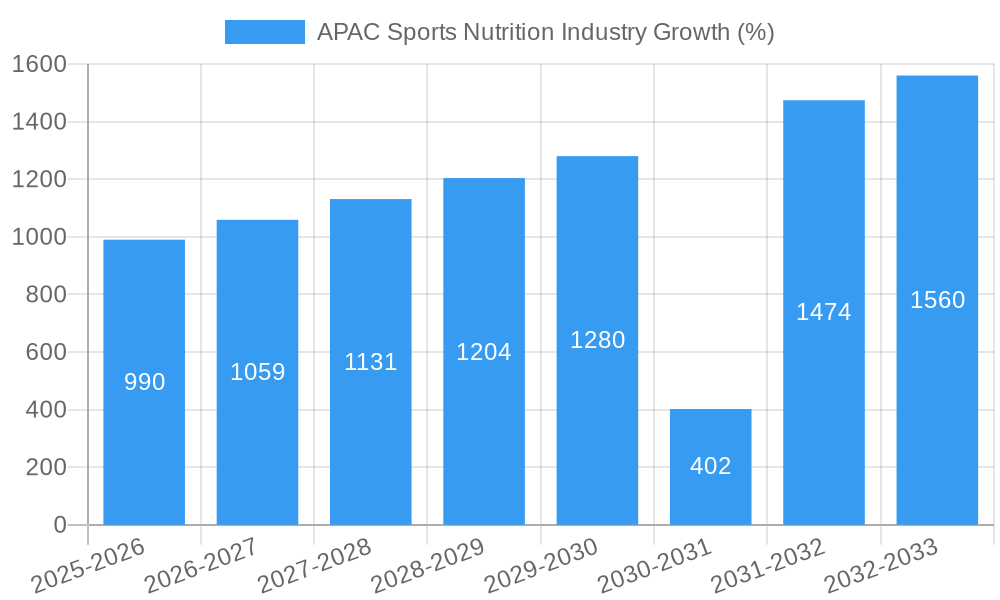
APAC Sports Nutrition Industry Growth Trends & Insights
The APAC sports nutrition market experienced robust growth during the historical period (2019-2024), with a CAGR of xx%. This growth is attributed to rising disposable incomes, increasing health consciousness, and the expanding fitness culture across the region. Market penetration for sports nutrition products remains relatively low in several APAC countries, indicating significant untapped potential. Technological disruptions, including the rise of e-commerce and personalized nutrition solutions, are reshaping consumer behavior. The shift towards healthier lifestyles and increasing participation in sports and fitness activities further contributes to the market's expansion. By 2033, the market is projected to reach xx million units, driven by sustained demand and ongoing innovation. Adoption rates are projected to increase by xx% by 2033, particularly in high-growth markets like India and China.
Dominant Regions, Countries, or Segments in APAC Sports Nutrition Industry
China and India are the leading markets in the APAC sports nutrition industry, accounting for xx% and xx% of the total market value in 2024, respectively. The growth is driven by a large and growing population, rising disposable incomes, increased health awareness, and a rapidly expanding fitness culture. Within product types, Sports Supplements hold the largest market share (xx%), followed by Sports Drinks (xx%) and Sports Food (xx%). Online stores are experiencing rapid growth as a distribution channel, with their share expected to reach xx% by 2033, while supermarkets/hypermarkets continue to dominate (xx%).
- Key Drivers in China: Expanding middle class, increasing health consciousness, government support for sports development.
- Key Drivers in India: Growing young population, rising disposable income, and increased awareness about health and fitness.
- Sports Supplements Dominance: Driven by the increasing popularity of protein powders, creatine, and other performance-enhancing supplements.
- Online Stores Growth: Fueled by rising internet penetration and e-commerce adoption.
APAC Sports Nutrition Industry Product Landscape
The APAC sports nutrition market showcases a diverse product landscape, featuring protein powders, energy bars, sports drinks, and specialized supplements tailored to specific athletic needs. Innovations focus on enhanced bioavailability, natural ingredients, and personalized formulations. Technological advancements are driving the development of products with improved taste, texture, and functionality. Key selling propositions include enhanced efficacy, convenience, and natural ingredients. The market is witnessing a trend towards plant-based and organic options, driven by the rising consumer preference for sustainable and ethical products.
Key Drivers, Barriers & Challenges in APAC Sports Nutrition Industry
Key Drivers:
- Rising health consciousness and fitness culture
- Growing disposable incomes and increased spending on health and wellness
- Technological advancements in product development and delivery
- Government initiatives promoting sports and fitness
Challenges:
- Stringent regulatory requirements and varying standards across different countries
- Counterfeit and substandard products in the market
- High import tariffs and taxes for certain ingredients
- Intense competition from established players and new entrants
Emerging Opportunities in APAP Sports Nutrition Industry
The APAP Sports Nutrition market presents several opportunities:
- Expansion into underdeveloped markets within APAC.
- Development of products specifically catering to the regional dietary habits and preferences.
- Growing demand for personalized nutrition solutions and functional foods.
- Leveraging e-commerce platforms to reach wider consumer base.
Growth Accelerators in the APAC Sports Nutrition Industry
Technological advancements, particularly in personalized nutrition, are a primary driver of long-term growth. Strategic partnerships between brands and fitness influencers expand market reach. Expansion into new markets within APAC, particularly in Southeast Asia, presents significant growth potential. Furthermore, increased product diversification catering to diverse consumer needs will further drive market expansion.
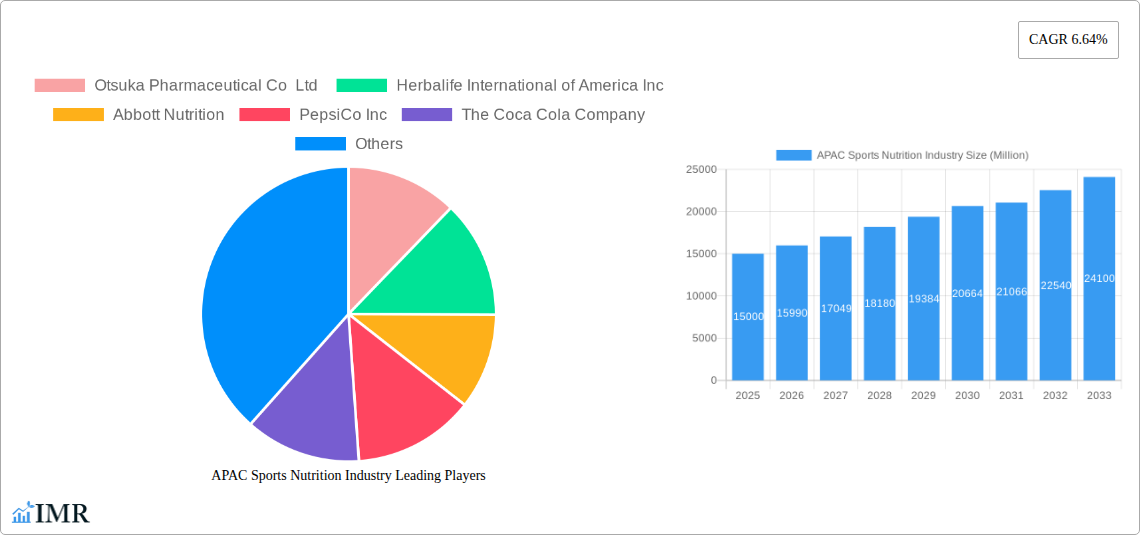
Key Players Shaping the APAC Sports Nutrition Industry Market
- Otsuka Pharmaceutical Co Ltd
- Herbalife International of America Inc
- Abbott Nutrition
- PepsiCo Inc
- The Coca Cola Company
- Glanbia PLC
- Cliff Bar & Company
- Zywie Ventures Pvt Ltd
- Muscleblaze
- Healthkart
- General Nutrition Centers Inc
Notable Milestones in APAC Sports Nutrition Industry Sector
- August 2022: The Coca-Cola Company launched Limca Sportz, expanding its product portfolio into sports drinks.
- September 2022: HRX and OZiva partnered to launch HRX Agame, a new sports & performance nutrition brand.
- April 2023: Genetic Nutrition, a UK brand, launched its supplements in India.
In-Depth APAC Sports Nutrition Industry Market Outlook
The APAC sports nutrition market is poised for continued growth, driven by sustained demand from a growing health-conscious population and ongoing technological innovation. The market presents significant opportunities for established players and new entrants alike, particularly in areas such as personalized nutrition, functional foods, and e-commerce. Strategic partnerships, market expansion, and continued innovation will be crucial for long-term success in this dynamic market.
APAC Sports Nutrition Industry Segmentation
-
1. Product Type
- 1.1. Sports Food
- 1.2. Sports Drinks
- 1.3. Sports Supplements
-
2. Distribution Channel
- 2.1. Supermarkets/Hypermarkets
- 2.2. Convenience Stores
- 2.3. Specialty Stores
- 2.4. Online Stores
- 2.5. Other Distribution Channels
-
3. Geography
- 3.1. China
- 3.2. Japan
- 3.3. India
- 3.4. Australia
- 3.5. Rest of Asia-Pacific
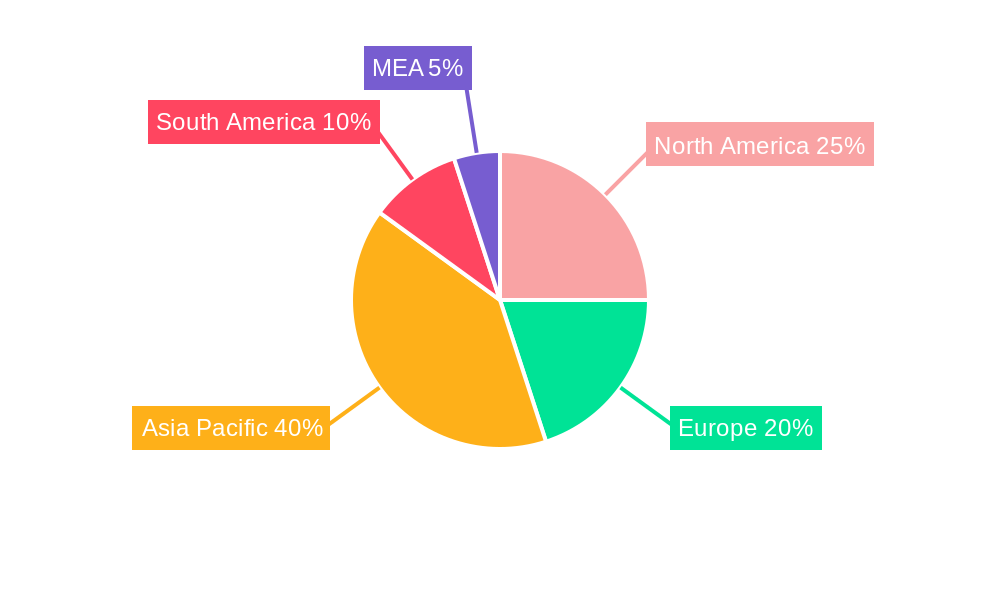
APAC Sports Nutrition Industry Segmentation By Geography
- 1. China
- 2. Japan
- 3. India
- 4. Australia
- 5. Rest of Asia Pacific
APAC Sports Nutrition Industry REPORT HIGHLIGHTS
| Aspects | Details |
|---|---|
| Study Period | 2019-2033 |
| Base Year | 2024 |
| Estimated Year | 2025 |
| Forecast Period | 2025-2033 |
| Historical Period | 2019-2024 |
| Growth Rate | CAGR of 6.64% from 2019-2033 |
| Segmentation |
|
Table of Contents
- 1. Introduction
- 1.1. Research Scope
- 1.2. Market Segmentation
- 1.3. Research Methodology
- 1.4. Definitions and Assumptions
- 2. Executive Summary
- 2.1. Introduction
- 3. Market Dynamics
- 3.1. Introduction
- 3.2. Market Drivers
- 3.2.1. Increasing Sports Participation; Increasing Awareness about Health and Fitness
- 3.3. Market Restrains
- 3.3.1. Adverse Effects of Overconsumption of Products
- 3.4. Market Trends
- 3.4.1. Increasing Sports Participation to Boost Market Growth
- 4. Market Factor Analysis
- 4.1. Porters Five Forces
- 4.2. Supply/Value Chain
- 4.3. PESTEL analysis
- 4.4. Market Entropy
- 4.5. Patent/Trademark Analysis
- 5. Global APAC Sports Nutrition Industry Analysis, Insights and Forecast, 2019-2031
- 5.1. Market Analysis, Insights and Forecast - by Product Type
- 5.1.1. Sports Food
- 5.1.2. Sports Drinks
- 5.1.3. Sports Supplements
- 5.2. Market Analysis, Insights and Forecast - by Distribution Channel
- 5.2.1. Supermarkets/Hypermarkets
- 5.2.2. Convenience Stores
- 5.2.3. Specialty Stores
- 5.2.4. Online Stores
- 5.2.5. Other Distribution Channels
- 5.3. Market Analysis, Insights and Forecast - by Geography
- 5.3.1. China
- 5.3.2. Japan
- 5.3.3. India
- 5.3.4. Australia
- 5.3.5. Rest of Asia-Pacific
- 5.4. Market Analysis, Insights and Forecast - by Region
- 5.4.1. China
- 5.4.2. Japan
- 5.4.3. India
- 5.4.4. Australia
- 5.4.5. Rest of Asia Pacific
- 5.1. Market Analysis, Insights and Forecast - by Product Type
- 6. China APAC Sports Nutrition Industry Analysis, Insights and Forecast, 2019-2031
- 6.1. Market Analysis, Insights and Forecast - by Product Type
- 6.1.1. Sports Food
- 6.1.2. Sports Drinks
- 6.1.3. Sports Supplements
- 6.2. Market Analysis, Insights and Forecast - by Distribution Channel
- 6.2.1. Supermarkets/Hypermarkets
- 6.2.2. Convenience Stores
- 6.2.3. Specialty Stores
- 6.2.4. Online Stores
- 6.2.5. Other Distribution Channels
- 6.3. Market Analysis, Insights and Forecast - by Geography
- 6.3.1. China
- 6.3.2. Japan
- 6.3.3. India
- 6.3.4. Australia
- 6.3.5. Rest of Asia-Pacific
- 6.1. Market Analysis, Insights and Forecast - by Product Type
- 7. Japan APAC Sports Nutrition Industry Analysis, Insights and Forecast, 2019-2031
- 7.1. Market Analysis, Insights and Forecast - by Product Type
- 7.1.1. Sports Food
- 7.1.2. Sports Drinks
- 7.1.3. Sports Supplements
- 7.2. Market Analysis, Insights and Forecast - by Distribution Channel
- 7.2.1. Supermarkets/Hypermarkets
- 7.2.2. Convenience Stores
- 7.2.3. Specialty Stores
- 7.2.4. Online Stores
- 7.2.5. Other Distribution Channels
- 7.3. Market Analysis, Insights and Forecast - by Geography
- 7.3.1. China
- 7.3.2. Japan
- 7.3.3. India
- 7.3.4. Australia
- 7.3.5. Rest of Asia-Pacific
- 7.1. Market Analysis, Insights and Forecast - by Product Type
- 8. India APAC Sports Nutrition Industry Analysis, Insights and Forecast, 2019-2031
- 8.1. Market Analysis, Insights and Forecast - by Product Type
- 8.1.1. Sports Food
- 8.1.2. Sports Drinks
- 8.1.3. Sports Supplements
- 8.2. Market Analysis, Insights and Forecast - by Distribution Channel
- 8.2.1. Supermarkets/Hypermarkets
- 8.2.2. Convenience Stores
- 8.2.3. Specialty Stores
- 8.2.4. Online Stores
- 8.2.5. Other Distribution Channels
- 8.3. Market Analysis, Insights and Forecast - by Geography
- 8.3.1. China
- 8.3.2. Japan
- 8.3.3. India
- 8.3.4. Australia
- 8.3.5. Rest of Asia-Pacific
- 8.1. Market Analysis, Insights and Forecast - by Product Type
- 9. Australia APAC Sports Nutrition Industry Analysis, Insights and Forecast, 2019-2031
- 9.1. Market Analysis, Insights and Forecast - by Product Type
- 9.1.1. Sports Food
- 9.1.2. Sports Drinks
- 9.1.3. Sports Supplements
- 9.2. Market Analysis, Insights and Forecast - by Distribution Channel
- 9.2.1. Supermarkets/Hypermarkets
- 9.2.2. Convenience Stores
- 9.2.3. Specialty Stores
- 9.2.4. Online Stores
- 9.2.5. Other Distribution Channels
- 9.3. Market Analysis, Insights and Forecast - by Geography
- 9.3.1. China
- 9.3.2. Japan
- 9.3.3. India
- 9.3.4. Australia
- 9.3.5. Rest of Asia-Pacific
- 9.1. Market Analysis, Insights and Forecast - by Product Type
- 10. Rest of Asia Pacific APAC Sports Nutrition Industry Analysis, Insights and Forecast, 2019-2031
- 10.1. Market Analysis, Insights and Forecast - by Product Type
- 10.1.1. Sports Food
- 10.1.2. Sports Drinks
- 10.1.3. Sports Supplements
- 10.2. Market Analysis, Insights and Forecast - by Distribution Channel
- 10.2.1. Supermarkets/Hypermarkets
- 10.2.2. Convenience Stores
- 10.2.3. Specialty Stores
- 10.2.4. Online Stores
- 10.2.5. Other Distribution Channels
- 10.3. Market Analysis, Insights and Forecast - by Geography
- 10.3.1. China
- 10.3.2. Japan
- 10.3.3. India
- 10.3.4. Australia
- 10.3.5. Rest of Asia-Pacific
- 10.1. Market Analysis, Insights and Forecast - by Product Type
- 11. North America APAC Sports Nutrition Industry Analysis, Insights and Forecast, 2019-2031
- 11.1. Market Analysis, Insights and Forecast - By Country/Sub-region
- 11.1.1 United States
- 11.1.2 Canada
- 11.1.3 Mexico
- 12. Europe APAC Sports Nutrition Industry Analysis, Insights and Forecast, 2019-2031
- 12.1. Market Analysis, Insights and Forecast - By Country/Sub-region
- 12.1.1 Germany
- 12.1.2 United Kingdom
- 12.1.3 France
- 12.1.4 Spain
- 12.1.5 Italy
- 12.1.6 Spain
- 12.1.7 Belgium
- 12.1.8 Netherland
- 12.1.9 Nordics
- 12.1.10 Rest of Europe
- 13. Asia Pacific APAC Sports Nutrition Industry Analysis, Insights and Forecast, 2019-2031
- 13.1. Market Analysis, Insights and Forecast - By Country/Sub-region
- 13.1.1 China
- 13.1.2 Japan
- 13.1.3 India
- 13.1.4 South Korea
- 13.1.5 Southeast Asia
- 13.1.6 Australia
- 13.1.7 Indonesia
- 13.1.8 Phillipes
- 13.1.9 Singapore
- 13.1.10 Thailandc
- 13.1.11 Rest of Asia Pacific
- 14. South America APAC Sports Nutrition Industry Analysis, Insights and Forecast, 2019-2031
- 14.1. Market Analysis, Insights and Forecast - By Country/Sub-region
- 14.1.1 Brazil
- 14.1.2 Argentina
- 14.1.3 Peru
- 14.1.4 Chile
- 14.1.5 Colombia
- 14.1.6 Ecuador
- 14.1.7 Venezuela
- 14.1.8 Rest of South America
- 15. North America APAC Sports Nutrition Industry Analysis, Insights and Forecast, 2019-2031
- 15.1. Market Analysis, Insights and Forecast - By Country/Sub-region
- 15.1.1 United States
- 15.1.2 Canada
- 15.1.3 Mexico
- 16. MEA APAC Sports Nutrition Industry Analysis, Insights and Forecast, 2019-2031
- 16.1. Market Analysis, Insights and Forecast - By Country/Sub-region
- 16.1.1 United Arab Emirates
- 16.1.2 Saudi Arabia
- 16.1.3 South Africa
- 16.1.4 Rest of Middle East and Africa
- 17. Competitive Analysis
- 17.1. Global Market Share Analysis 2024
- 17.2. Company Profiles
- 17.2.1 Otsuka Pharmaceutical Co Ltd
- 17.2.1.1. Overview
- 17.2.1.2. Products
- 17.2.1.3. SWOT Analysis
- 17.2.1.4. Recent Developments
- 17.2.1.5. Financials (Based on Availability)
- 17.2.2 Herbalife International of America Inc
- 17.2.2.1. Overview
- 17.2.2.2. Products
- 17.2.2.3. SWOT Analysis
- 17.2.2.4. Recent Developments
- 17.2.2.5. Financials (Based on Availability)
- 17.2.3 Abbott Nutrition
- 17.2.3.1. Overview
- 17.2.3.2. Products
- 17.2.3.3. SWOT Analysis
- 17.2.3.4. Recent Developments
- 17.2.3.5. Financials (Based on Availability)
- 17.2.4 PepsiCo Inc
- 17.2.4.1. Overview
- 17.2.4.2. Products
- 17.2.4.3. SWOT Analysis
- 17.2.4.4. Recent Developments
- 17.2.4.5. Financials (Based on Availability)
- 17.2.5 The Coca Cola Company
- 17.2.5.1. Overview
- 17.2.5.2. Products
- 17.2.5.3. SWOT Analysis
- 17.2.5.4. Recent Developments
- 17.2.5.5. Financials (Based on Availability)
- 17.2.6 Glanbia PLC
- 17.2.6.1. Overview
- 17.2.6.2. Products
- 17.2.6.3. SWOT Analysis
- 17.2.6.4. Recent Developments
- 17.2.6.5. Financials (Based on Availability)
- 17.2.7 Cliff Bar & Company
- 17.2.7.1. Overview
- 17.2.7.2. Products
- 17.2.7.3. SWOT Analysis
- 17.2.7.4. Recent Developments
- 17.2.7.5. Financials (Based on Availability)
- 17.2.8 Zywie Ventures Pvt Ltd
- 17.2.8.1. Overview
- 17.2.8.2. Products
- 17.2.8.3. SWOT Analysis
- 17.2.8.4. Recent Developments
- 17.2.8.5. Financials (Based on Availability)
- 17.2.9 Muscleblaze
- 17.2.9.1. Overview
- 17.2.9.2. Products
- 17.2.9.3. SWOT Analysis
- 17.2.9.4. Recent Developments
- 17.2.9.5. Financials (Based on Availability)
- 17.2.10 Healthkart
- 17.2.10.1. Overview
- 17.2.10.2. Products
- 17.2.10.3. SWOT Analysis
- 17.2.10.4. Recent Developments
- 17.2.10.5. Financials (Based on Availability)
- 17.2.11 General Nutrition Centers Inc
- 17.2.11.1. Overview
- 17.2.11.2. Products
- 17.2.11.3. SWOT Analysis
- 17.2.11.4. Recent Developments
- 17.2.11.5. Financials (Based on Availability)
- 17.2.1 Otsuka Pharmaceutical Co Ltd
List of Figures
- Figure 1: Global APAC Sports Nutrition Industry Revenue Breakdown (Million, %) by Region 2024 & 2032
- Figure 2: North America APAC Sports Nutrition Industry Revenue (Million), by Country 2024 & 2032
- Figure 3: North America APAC Sports Nutrition Industry Revenue Share (%), by Country 2024 & 2032
- Figure 4: Europe APAC Sports Nutrition Industry Revenue (Million), by Country 2024 & 2032
- Figure 5: Europe APAC Sports Nutrition Industry Revenue Share (%), by Country 2024 & 2032
- Figure 6: Asia Pacific APAC Sports Nutrition Industry Revenue (Million), by Country 2024 & 2032
- Figure 7: Asia Pacific APAC Sports Nutrition Industry Revenue Share (%), by Country 2024 & 2032
- Figure 8: South America APAC Sports Nutrition Industry Revenue (Million), by Country 2024 & 2032
- Figure 9: South America APAC Sports Nutrition Industry Revenue Share (%), by Country 2024 & 2032
- Figure 10: North America APAC Sports Nutrition Industry Revenue (Million), by Country 2024 & 2032
- Figure 11: North America APAC Sports Nutrition Industry Revenue Share (%), by Country 2024 & 2032
- Figure 12: MEA APAC Sports Nutrition Industry Revenue (Million), by Country 2024 & 2032
- Figure 13: MEA APAC Sports Nutrition Industry Revenue Share (%), by Country 2024 & 2032
- Figure 14: China APAC Sports Nutrition Industry Revenue (Million), by Product Type 2024 & 2032
- Figure 15: China APAC Sports Nutrition Industry Revenue Share (%), by Product Type 2024 & 2032
- Figure 16: China APAC Sports Nutrition Industry Revenue (Million), by Distribution Channel 2024 & 2032
- Figure 17: China APAC Sports Nutrition Industry Revenue Share (%), by Distribution Channel 2024 & 2032
- Figure 18: China APAC Sports Nutrition Industry Revenue (Million), by Geography 2024 & 2032
- Figure 19: China APAC Sports Nutrition Industry Revenue Share (%), by Geography 2024 & 2032
- Figure 20: China APAC Sports Nutrition Industry Revenue (Million), by Country 2024 & 2032
- Figure 21: China APAC Sports Nutrition Industry Revenue Share (%), by Country 2024 & 2032
- Figure 22: Japan APAC Sports Nutrition Industry Revenue (Million), by Product Type 2024 & 2032
- Figure 23: Japan APAC Sports Nutrition Industry Revenue Share (%), by Product Type 2024 & 2032
- Figure 24: Japan APAC Sports Nutrition Industry Revenue (Million), by Distribution Channel 2024 & 2032
- Figure 25: Japan APAC Sports Nutrition Industry Revenue Share (%), by Distribution Channel 2024 & 2032
- Figure 26: Japan APAC Sports Nutrition Industry Revenue (Million), by Geography 2024 & 2032
- Figure 27: Japan APAC Sports Nutrition Industry Revenue Share (%), by Geography 2024 & 2032
- Figure 28: Japan APAC Sports Nutrition Industry Revenue (Million), by Country 2024 & 2032
- Figure 29: Japan APAC Sports Nutrition Industry Revenue Share (%), by Country 2024 & 2032
- Figure 30: India APAC Sports Nutrition Industry Revenue (Million), by Product Type 2024 & 2032
- Figure 31: India APAC Sports Nutrition Industry Revenue Share (%), by Product Type 2024 & 2032
- Figure 32: India APAC Sports Nutrition Industry Revenue (Million), by Distribution Channel 2024 & 2032
- Figure 33: India APAC Sports Nutrition Industry Revenue Share (%), by Distribution Channel 2024 & 2032
- Figure 34: India APAC Sports Nutrition Industry Revenue (Million), by Geography 2024 & 2032
- Figure 35: India APAC Sports Nutrition Industry Revenue Share (%), by Geography 2024 & 2032
- Figure 36: India APAC Sports Nutrition Industry Revenue (Million), by Country 2024 & 2032
- Figure 37: India APAC Sports Nutrition Industry Revenue Share (%), by Country 2024 & 2032
- Figure 38: Australia APAC Sports Nutrition Industry Revenue (Million), by Product Type 2024 & 2032
- Figure 39: Australia APAC Sports Nutrition Industry Revenue Share (%), by Product Type 2024 & 2032
- Figure 40: Australia APAC Sports Nutrition Industry Revenue (Million), by Distribution Channel 2024 & 2032
- Figure 41: Australia APAC Sports Nutrition Industry Revenue Share (%), by Distribution Channel 2024 & 2032
- Figure 42: Australia APAC Sports Nutrition Industry Revenue (Million), by Geography 2024 & 2032
- Figure 43: Australia APAC Sports Nutrition Industry Revenue Share (%), by Geography 2024 & 2032
- Figure 44: Australia APAC Sports Nutrition Industry Revenue (Million), by Country 2024 & 2032
- Figure 45: Australia APAC Sports Nutrition Industry Revenue Share (%), by Country 2024 & 2032
- Figure 46: Rest of Asia Pacific APAC Sports Nutrition Industry Revenue (Million), by Product Type 2024 & 2032
- Figure 47: Rest of Asia Pacific APAC Sports Nutrition Industry Revenue Share (%), by Product Type 2024 & 2032
- Figure 48: Rest of Asia Pacific APAC Sports Nutrition Industry Revenue (Million), by Distribution Channel 2024 & 2032
- Figure 49: Rest of Asia Pacific APAC Sports Nutrition Industry Revenue Share (%), by Distribution Channel 2024 & 2032
- Figure 50: Rest of Asia Pacific APAC Sports Nutrition Industry Revenue (Million), by Geography 2024 & 2032
- Figure 51: Rest of Asia Pacific APAC Sports Nutrition Industry Revenue Share (%), by Geography 2024 & 2032
- Figure 52: Rest of Asia Pacific APAC Sports Nutrition Industry Revenue (Million), by Country 2024 & 2032
- Figure 53: Rest of Asia Pacific APAC Sports Nutrition Industry Revenue Share (%), by Country 2024 & 2032
List of Tables
- Table 1: Global APAC Sports Nutrition Industry Revenue Million Forecast, by Region 2019 & 2032
- Table 2: Global APAC Sports Nutrition Industry Revenue Million Forecast, by Product Type 2019 & 2032
- Table 3: Global APAC Sports Nutrition Industry Revenue Million Forecast, by Distribution Channel 2019 & 2032
- Table 4: Global APAC Sports Nutrition Industry Revenue Million Forecast, by Geography 2019 & 2032
- Table 5: Global APAC Sports Nutrition Industry Revenue Million Forecast, by Region 2019 & 2032
- Table 6: Global APAC Sports Nutrition Industry Revenue Million Forecast, by Country 2019 & 2032
- Table 7: United States APAC Sports Nutrition Industry Revenue (Million) Forecast, by Application 2019 & 2032
- Table 8: Canada APAC Sports Nutrition Industry Revenue (Million) Forecast, by Application 2019 & 2032
- Table 9: Mexico APAC Sports Nutrition Industry Revenue (Million) Forecast, by Application 2019 & 2032
- Table 10: Global APAC Sports Nutrition Industry Revenue Million Forecast, by Country 2019 & 2032
- Table 11: Germany APAC Sports Nutrition Industry Revenue (Million) Forecast, by Application 2019 & 2032
- Table 12: United Kingdom APAC Sports Nutrition Industry Revenue (Million) Forecast, by Application 2019 & 2032
- Table 13: France APAC Sports Nutrition Industry Revenue (Million) Forecast, by Application 2019 & 2032
- Table 14: Spain APAC Sports Nutrition Industry Revenue (Million) Forecast, by Application 2019 & 2032
- Table 15: Italy APAC Sports Nutrition Industry Revenue (Million) Forecast, by Application 2019 & 2032
- Table 16: Spain APAC Sports Nutrition Industry Revenue (Million) Forecast, by Application 2019 & 2032
- Table 17: Belgium APAC Sports Nutrition Industry Revenue (Million) Forecast, by Application 2019 & 2032
- Table 18: Netherland APAC Sports Nutrition Industry Revenue (Million) Forecast, by Application 2019 & 2032
- Table 19: Nordics APAC Sports Nutrition Industry Revenue (Million) Forecast, by Application 2019 & 2032
- Table 20: Rest of Europe APAC Sports Nutrition Industry Revenue (Million) Forecast, by Application 2019 & 2032
- Table 21: Global APAC Sports Nutrition Industry Revenue Million Forecast, by Country 2019 & 2032
- Table 22: China APAC Sports Nutrition Industry Revenue (Million) Forecast, by Application 2019 & 2032
- Table 23: Japan APAC Sports Nutrition Industry Revenue (Million) Forecast, by Application 2019 & 2032
- Table 24: India APAC Sports Nutrition Industry Revenue (Million) Forecast, by Application 2019 & 2032
- Table 25: South Korea APAC Sports Nutrition Industry Revenue (Million) Forecast, by Application 2019 & 2032
- Table 26: Southeast Asia APAC Sports Nutrition Industry Revenue (Million) Forecast, by Application 2019 & 2032
- Table 27: Australia APAC Sports Nutrition Industry Revenue (Million) Forecast, by Application 2019 & 2032
- Table 28: Indonesia APAC Sports Nutrition Industry Revenue (Million) Forecast, by Application 2019 & 2032
- Table 29: Phillipes APAC Sports Nutrition Industry Revenue (Million) Forecast, by Application 2019 & 2032
- Table 30: Singapore APAC Sports Nutrition Industry Revenue (Million) Forecast, by Application 2019 & 2032
- Table 31: Thailandc APAC Sports Nutrition Industry Revenue (Million) Forecast, by Application 2019 & 2032
- Table 32: Rest of Asia Pacific APAC Sports Nutrition Industry Revenue (Million) Forecast, by Application 2019 & 2032
- Table 33: Global APAC Sports Nutrition Industry Revenue Million Forecast, by Country 2019 & 2032
- Table 34: Brazil APAC Sports Nutrition Industry Revenue (Million) Forecast, by Application 2019 & 2032
- Table 35: Argentina APAC Sports Nutrition Industry Revenue (Million) Forecast, by Application 2019 & 2032
- Table 36: Peru APAC Sports Nutrition Industry Revenue (Million) Forecast, by Application 2019 & 2032
- Table 37: Chile APAC Sports Nutrition Industry Revenue (Million) Forecast, by Application 2019 & 2032
- Table 38: Colombia APAC Sports Nutrition Industry Revenue (Million) Forecast, by Application 2019 & 2032
- Table 39: Ecuador APAC Sports Nutrition Industry Revenue (Million) Forecast, by Application 2019 & 2032
- Table 40: Venezuela APAC Sports Nutrition Industry Revenue (Million) Forecast, by Application 2019 & 2032
- Table 41: Rest of South America APAC Sports Nutrition Industry Revenue (Million) Forecast, by Application 2019 & 2032
- Table 42: Global APAC Sports Nutrition Industry Revenue Million Forecast, by Country 2019 & 2032
- Table 43: United States APAC Sports Nutrition Industry Revenue (Million) Forecast, by Application 2019 & 2032
- Table 44: Canada APAC Sports Nutrition Industry Revenue (Million) Forecast, by Application 2019 & 2032
- Table 45: Mexico APAC Sports Nutrition Industry Revenue (Million) Forecast, by Application 2019 & 2032
- Table 46: Global APAC Sports Nutrition Industry Revenue Million Forecast, by Country 2019 & 2032
- Table 47: United Arab Emirates APAC Sports Nutrition Industry Revenue (Million) Forecast, by Application 2019 & 2032
- Table 48: Saudi Arabia APAC Sports Nutrition Industry Revenue (Million) Forecast, by Application 2019 & 2032
- Table 49: South Africa APAC Sports Nutrition Industry Revenue (Million) Forecast, by Application 2019 & 2032
- Table 50: Rest of Middle East and Africa APAC Sports Nutrition Industry Revenue (Million) Forecast, by Application 2019 & 2032
- Table 51: Global APAC Sports Nutrition Industry Revenue Million Forecast, by Product Type 2019 & 2032
- Table 52: Global APAC Sports Nutrition Industry Revenue Million Forecast, by Distribution Channel 2019 & 2032
- Table 53: Global APAC Sports Nutrition Industry Revenue Million Forecast, by Geography 2019 & 2032
- Table 54: Global APAC Sports Nutrition Industry Revenue Million Forecast, by Country 2019 & 2032
- Table 55: Global APAC Sports Nutrition Industry Revenue Million Forecast, by Product Type 2019 & 2032
- Table 56: Global APAC Sports Nutrition Industry Revenue Million Forecast, by Distribution Channel 2019 & 2032
- Table 57: Global APAC Sports Nutrition Industry Revenue Million Forecast, by Geography 2019 & 2032
- Table 58: Global APAC Sports Nutrition Industry Revenue Million Forecast, by Country 2019 & 2032
- Table 59: Global APAC Sports Nutrition Industry Revenue Million Forecast, by Product Type 2019 & 2032
- Table 60: Global APAC Sports Nutrition Industry Revenue Million Forecast, by Distribution Channel 2019 & 2032
- Table 61: Global APAC Sports Nutrition Industry Revenue Million Forecast, by Geography 2019 & 2032
- Table 62: Global APAC Sports Nutrition Industry Revenue Million Forecast, by Country 2019 & 2032
- Table 63: Global APAC Sports Nutrition Industry Revenue Million Forecast, by Product Type 2019 & 2032
- Table 64: Global APAC Sports Nutrition Industry Revenue Million Forecast, by Distribution Channel 2019 & 2032
- Table 65: Global APAC Sports Nutrition Industry Revenue Million Forecast, by Geography 2019 & 2032
- Table 66: Global APAC Sports Nutrition Industry Revenue Million Forecast, by Country 2019 & 2032
- Table 67: Global APAC Sports Nutrition Industry Revenue Million Forecast, by Product Type 2019 & 2032
- Table 68: Global APAC Sports Nutrition Industry Revenue Million Forecast, by Distribution Channel 2019 & 2032
- Table 69: Global APAC Sports Nutrition Industry Revenue Million Forecast, by Geography 2019 & 2032
- Table 70: Global APAC Sports Nutrition Industry Revenue Million Forecast, by Country 2019 & 2032
Frequently Asked Questions
1. What is the projected Compound Annual Growth Rate (CAGR) of the APAC Sports Nutrition Industry?
The projected CAGR is approximately 6.64%.
2. Which companies are prominent players in the APAC Sports Nutrition Industry?
Key companies in the market include Otsuka Pharmaceutical Co Ltd , Herbalife International of America Inc, Abbott Nutrition, PepsiCo Inc, The Coca Cola Company, Glanbia PLC, Cliff Bar & Company, Zywie Ventures Pvt Ltd, Muscleblaze, Healthkart, General Nutrition Centers Inc.
3. What are the main segments of the APAC Sports Nutrition Industry?
The market segments include Product Type, Distribution Channel, Geography.
4. Can you provide details about the market size?
The market size is estimated to be USD XX Million as of 2022.
5. What are some drivers contributing to market growth?
Increasing Sports Participation; Increasing Awareness about Health and Fitness.
6. What are the notable trends driving market growth?
Increasing Sports Participation to Boost Market Growth.
7. Are there any restraints impacting market growth?
Adverse Effects of Overconsumption of Products.
8. Can you provide examples of recent developments in the market?
April 2023: UK sports nutrition brand Genetic Nutrition launched its high-quality sports nutrition supplements in India. The brand's range of supplements includes protein powders, amino acids, and vitamins formulated using best-in-class ingredients for maximum effectiveness.
9. What pricing options are available for accessing the report?
Pricing options include single-user, multi-user, and enterprise licenses priced at USD 4750, USD 5250, and USD 8750 respectively.
10. Is the market size provided in terms of value or volume?
The market size is provided in terms of value, measured in Million.
11. Are there any specific market keywords associated with the report?
Yes, the market keyword associated with the report is "APAC Sports Nutrition Industry," which aids in identifying and referencing the specific market segment covered.
12. How do I determine which pricing option suits my needs best?
The pricing options vary based on user requirements and access needs. Individual users may opt for single-user licenses, while businesses requiring broader access may choose multi-user or enterprise licenses for cost-effective access to the report.
13. Are there any additional resources or data provided in the APAC Sports Nutrition Industry report?
While the report offers comprehensive insights, it's advisable to review the specific contents or supplementary materials provided to ascertain if additional resources or data are available.
14. How can I stay updated on further developments or reports in the APAC Sports Nutrition Industry?
To stay informed about further developments, trends, and reports in the APAC Sports Nutrition Industry, consider subscribing to industry newsletters, following relevant companies and organizations, or regularly checking reputable industry news sources and publications.
Methodology
Step 1 - Identification of Relevant Samples Size from Population Database


Step 2 - Approaches for Defining Global Market Size (Value, Volume* & Price*)

Note*: In applicable scenarios
Step 3 - Data Sources
Primary Research
- Web Analytics
- Survey Reports
- Research Institute
- Latest Research Reports
- Opinion Leaders
Secondary Research
- Annual Reports
- White Paper
- Latest Press Release
- Industry Association
- Paid Database
- Investor Presentations

Step 4 - Data Triangulation
Involves using different sources of information in order to increase the validity of a study
These sources are likely to be stakeholders in a program - participants, other researchers, program staff, other community members, and so on.
Then we put all data in single framework & apply various statistical tools to find out the dynamic on the market.
During the analysis stage, feedback from the stakeholder groups would be compared to determine areas of agreement as well as areas of divergence
