

Key Insights
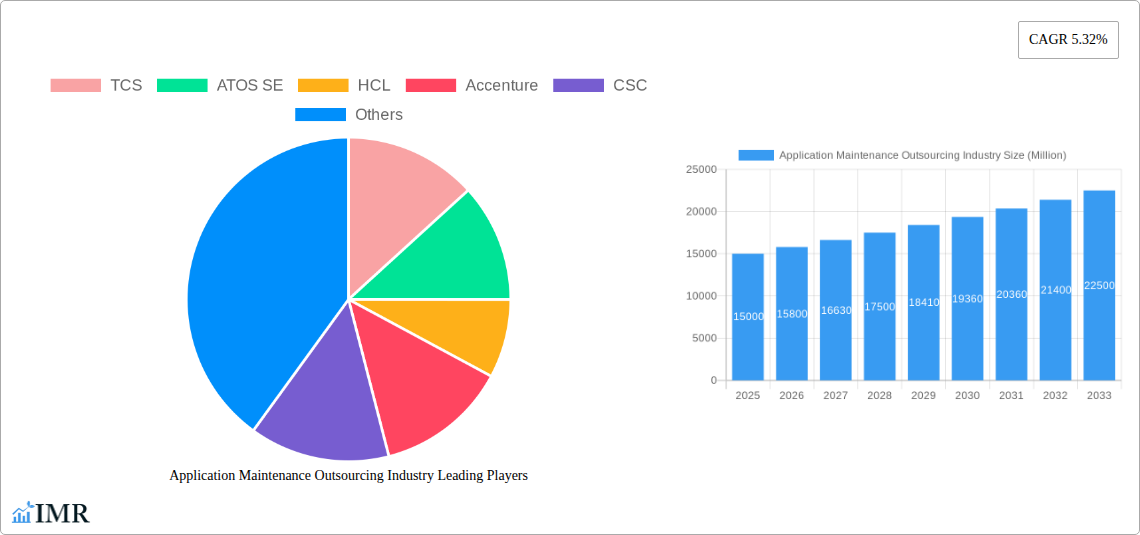
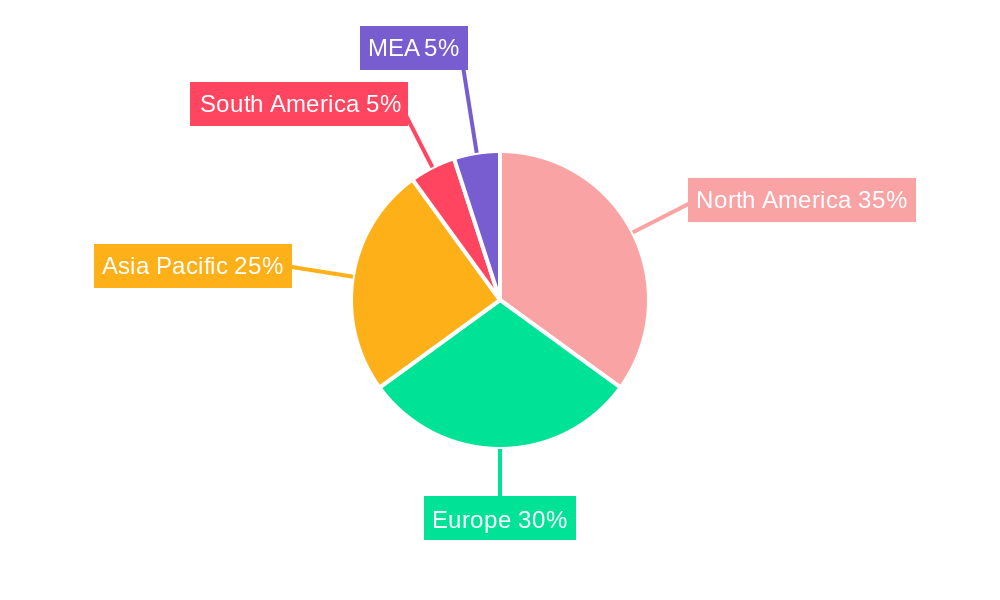
The Application Maintenance Outsourcing (AMO) market is experiencing robust growth, driven by the increasing complexity of enterprise applications, the rising demand for digital transformation, and the escalating costs of in-house maintenance. A 5.32% CAGR indicates a consistently expanding market, projected to reach significant value by 2033. The BFSI (Banking, Financial Services, and Insurance), Healthcare and Lifesciences, and Media and Entertainment sectors are key drivers, demanding high levels of application availability and performance. These industries prioritize outsourcing to leverage specialized expertise, reduce operational costs, and enhance scalability. Geographic distribution shows strong performance across North America and Europe, with Asia-Pacific emerging as a rapidly growing market due to increasing IT adoption and cost-effectiveness. While potential restraints include security concerns and vendor lock-in, the overall market trajectory remains positive, fueled by ongoing technological advancements such as cloud computing, AI, and automation, which are improving efficiency and reducing maintenance costs further stimulating demand for AMO services.
The competitive landscape is highly fragmented, with major players like TCS, ATOS SE, HCL, Accenture, CSC, Wipro, Infosys, NTT Data, IBM Global Services, and Capgemini vying for market share. These companies are constantly innovating and expanding their service offerings to meet evolving customer needs, fostering a dynamic and competitive environment. Successful players are likely those who can offer comprehensive solutions combining application maintenance with modernization and digital transformation services, addressing the broader needs of businesses beyond simple upkeep. The market is likely to see further consolidation as larger players acquire smaller firms to expand their capabilities and geographical reach. Continued focus on security, compliance, and service level agreements will be crucial for maintaining customer trust and achieving long-term success in this competitive space.
Application Maintenance Outsourcing Industry Market Report: 2019-2033
This comprehensive report provides an in-depth analysis of the Application Maintenance Outsourcing market, encompassing market dynamics, growth trends, regional analysis, competitive landscape, and future outlook. The study covers the period from 2019 to 2033, with 2025 as the base year and a forecast period of 2025-2033. The report segments the market by end-user industry (BFSI, Healthcare and Lifesciences, Media and Entertainment, Logistics & Transportation, Other Categories) and analyzes key players such as TCS, ATOS SE, HCL, Accenture, CSC, Wipro, Infosys, NTT Data, IBM Global Services, and Capgemini. Market values are presented in millions of units.
Application Maintenance Outsourcing Industry Market Dynamics & Structure
The Application Maintenance Outsourcing market is characterized by moderate concentration, with a few large players holding significant market share. Technological innovation, particularly in areas like AI-powered automation and cloud-based solutions, is a primary growth driver. Stringent regulatory frameworks governing data security and compliance significantly impact market operations. Competitive substitutes include in-house IT teams and open-source solutions. End-user demographics show a strong preference for outsourcing among businesses seeking cost optimization and increased efficiency. The market has witnessed a moderate level of M&A activity in recent years, with larger players acquiring smaller firms to expand their service offerings and geographical reach.
- Market Concentration: Moderately concentrated, with the top 5 players holding approximately xx% of the market share in 2025.
- Technological Innovation: AI-driven automation, cloud computing, and DevOps are key innovation drivers.
- Regulatory Framework: Compliance with data privacy regulations (e.g., GDPR, CCPA) is a significant factor.
- Competitive Substitutes: In-house IT teams and open-source solutions pose competitive pressure.
- M&A Activity: Approximately xx M&A deals recorded between 2019-2024, with an average deal value of xx Million.
Application Maintenance Outsourcing Industry Growth Trends & Insights
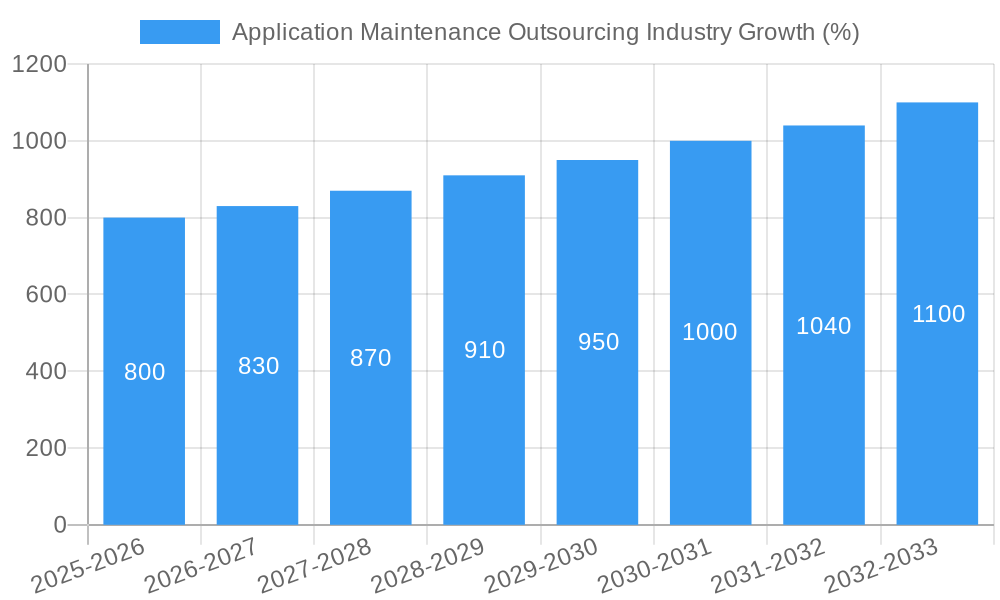
The Application Maintenance Outsourcing market experienced significant growth between 2019 and 2024, driven by increasing adoption of cloud technologies and the growing need for IT infrastructure optimization among businesses of all sizes. The market is projected to maintain a healthy CAGR of xx% during the forecast period (2025-2033), reaching a market size of xx Million by 2033. This growth is further fueled by the rising demand for digital transformation initiatives and the increasing complexity of IT systems. Technological disruptions, such as the emergence of serverless computing and edge computing, are reshaping the industry, demanding continuous adaptation and innovation from service providers. A shift towards outcome-based pricing models and a focus on improved service level agreements are also observed. Market penetration is expected to reach xx% by 2033.
Dominant Regions, Countries, or Segments in Application Maintenance Outsourcing Industry
North America currently holds the largest market share in the Application Maintenance Outsourcing industry, driven by a high concentration of technology companies and a strong emphasis on digital transformation. Within the end-user segments, the BFSI sector demonstrates the highest growth potential, driven by increasing regulatory scrutiny, growing data volumes and the need for robust security systems. Europe follows closely behind, exhibiting strong growth due to the increasing adoption of cloud technologies and outsourcing across various industries.
- North America: High concentration of technology companies and strong adoption of digital technologies.
- Europe: Increasing adoption of cloud technologies and outsourcing initiatives across various sectors.
- BFSI Segment: Highest growth potential due to regulatory compliance demands and data security needs.
- Key Drivers: Favorable economic policies, robust IT infrastructure, and a skilled workforce.
Application Maintenance Outsourcing Industry Product Landscape
The Application Maintenance Outsourcing market offers a wide range of services, including application support, maintenance, upgrades, and modernization. Innovations focus on automating routine tasks, leveraging AI for predictive maintenance, and adopting agile methodologies for faster response times. Key performance indicators include service level agreements (SLAs), mean time to resolution (MTTR), and customer satisfaction scores. The unique selling propositions of leading providers include specialized expertise in specific technologies, global delivery capabilities, and robust security protocols.
Key Drivers, Barriers & Challenges in Application Maintenance Outsourcing Industry
Key Drivers:
- Increasing demand for digital transformation initiatives
- Growing complexity of IT systems
- Cost optimization and efficiency gains
- Shortage of skilled IT professionals internally
Key Challenges & Restraints:
- Data security and privacy concerns (impact: xx% reduction in outsourcing adoption in certain segments)
- Vendor lock-in and contract negotiations
- Cultural differences and communication barriers impacting service quality
- Fluctuations in currency exchange rates impacting pricing
Emerging Opportunities in Application Maintenance Outsourcing Industry
Emerging opportunities lie in the growing adoption of AI-powered automation for application maintenance, the expansion into newer technologies like blockchain and IoT, and the increasing demand for managed services in niche industry sectors. Untapped markets in developing economies represent significant potential. Focus on proactive maintenance and predictive analytics to minimize downtime will also drive future growth.
Growth Accelerators in the Application Maintenance Outsourcing Industry
Technological advancements in AI and automation, strategic partnerships to expand service capabilities, and proactive market expansion into emerging economies are significant growth catalysts. A focus on building strong client relationships and offering customized solutions will further enhance market penetration and long-term growth.
Key Players Shaping the Application Maintenance Outsourcing Market
Notable Milestones in Application Maintenance Outsourcing Industry Sector
- 2020: Increased adoption of cloud-based application maintenance solutions.
- 2021: Several major players invested heavily in AI-powered automation tools for application maintenance.
- 2022: Significant mergers and acquisitions among mid-sized players.
- 2023: Launch of several new application maintenance platforms incorporating advanced security features.
In-Depth Application Maintenance Outsourcing Industry Market Outlook
The Application Maintenance Outsourcing market is poised for sustained growth, driven by the increasing adoption of digital technologies, the growing complexity of IT systems, and the ongoing demand for cost optimization. Strategic investments in emerging technologies, coupled with a focus on client satisfaction and proactive maintenance, will create significant opportunities for market expansion and leadership. The future landscape will be characterized by further consolidation through M&A activity and an increasing focus on AI-driven automation and predictive analytics.
Application Maintenance Outsourcing Industry Segmentation
-
1. End-user Industry
- 1.1. BFSI
- 1.2. Healthcare and Lifesciences
- 1.3. Media and Entertainment
- 1.4. Logistics & Transportation
- 1.5. Other Categories
Application Maintenance Outsourcing Industry Segmentation By Geography
-
1. North America
- 1.1. United States
- 1.2. China
-
2. Europe
- 2.1. Germany
- 2.2. United Kingdom
- 2.3. France
- 2.4. Rest of Europe
-
3. Asia Pacific
- 3.1. India
- 3.2. China
- 3.3. Japan
- 3.4. South Korea
- 3.5. Rest of APAC
- 4. Latin America
- 5. Middle East and Africa
Application Maintenance Outsourcing Industry REPORT HIGHLIGHTS
| Aspects | Details |
|---|---|
| Study Period | 2019-2033 |
| Base Year | 2024 |
| Estimated Year | 2025 |
| Forecast Period | 2025-2033 |
| Historical Period | 2019-2024 |
| Growth Rate | CAGR of 5.32% from 2019-2033 |
| Segmentation |
|
Table of Contents
- 1. Introduction
- 1.1. Research Scope
- 1.2. Market Segmentation
- 1.3. Research Methodology
- 1.4. Definitions and Assumptions
- 2. Executive Summary
- 2.1. Introduction
- 3. Market Dynamics
- 3.1. Introduction
- 3.2. Market Drivers
- 3.2.1. Increased demand from BFSI; Growing emphasis on customer retention & engagement; Move towards digital transformation
- 3.3. Market Restrains
- 3.3.1. Security & Privacy-related concerns
- 3.4. Market Trends
- 3.4.1. BFSI to have a significant share
- 4. Market Factor Analysis
- 4.1. Porters Five Forces
- 4.2. Supply/Value Chain
- 4.3. PESTEL analysis
- 4.4. Market Entropy
- 4.5. Patent/Trademark Analysis
- 5. Global Application Maintenance Outsourcing Industry Analysis, Insights and Forecast, 2019-2031
- 5.1. Market Analysis, Insights and Forecast - by End-user Industry
- 5.1.1. BFSI
- 5.1.2. Healthcare and Lifesciences
- 5.1.3. Media and Entertainment
- 5.1.4. Logistics & Transportation
- 5.1.5. Other Categories
- 5.2. Market Analysis, Insights and Forecast - by Region
- 5.2.1. North America
- 5.2.2. Europe
- 5.2.3. Asia Pacific
- 5.2.4. Latin America
- 5.2.5. Middle East and Africa
- 5.1. Market Analysis, Insights and Forecast - by End-user Industry
- 6. North America Application Maintenance Outsourcing Industry Analysis, Insights and Forecast, 2019-2031
- 6.1. Market Analysis, Insights and Forecast - by End-user Industry
- 6.1.1. BFSI
- 6.1.2. Healthcare and Lifesciences
- 6.1.3. Media and Entertainment
- 6.1.4. Logistics & Transportation
- 6.1.5. Other Categories
- 6.1. Market Analysis, Insights and Forecast - by End-user Industry
- 7. Europe Application Maintenance Outsourcing Industry Analysis, Insights and Forecast, 2019-2031
- 7.1. Market Analysis, Insights and Forecast - by End-user Industry
- 7.1.1. BFSI
- 7.1.2. Healthcare and Lifesciences
- 7.1.3. Media and Entertainment
- 7.1.4. Logistics & Transportation
- 7.1.5. Other Categories
- 7.1. Market Analysis, Insights and Forecast - by End-user Industry
- 8. Asia Pacific Application Maintenance Outsourcing Industry Analysis, Insights and Forecast, 2019-2031
- 8.1. Market Analysis, Insights and Forecast - by End-user Industry
- 8.1.1. BFSI
- 8.1.2. Healthcare and Lifesciences
- 8.1.3. Media and Entertainment
- 8.1.4. Logistics & Transportation
- 8.1.5. Other Categories
- 8.1. Market Analysis, Insights and Forecast - by End-user Industry
- 9. Latin America Application Maintenance Outsourcing Industry Analysis, Insights and Forecast, 2019-2031
- 9.1. Market Analysis, Insights and Forecast - by End-user Industry
- 9.1.1. BFSI
- 9.1.2. Healthcare and Lifesciences
- 9.1.3. Media and Entertainment
- 9.1.4. Logistics & Transportation
- 9.1.5. Other Categories
- 9.1. Market Analysis, Insights and Forecast - by End-user Industry
- 10. Middle East and Africa Application Maintenance Outsourcing Industry Analysis, Insights and Forecast, 2019-2031
- 10.1. Market Analysis, Insights and Forecast - by End-user Industry
- 10.1.1. BFSI
- 10.1.2. Healthcare and Lifesciences
- 10.1.3. Media and Entertainment
- 10.1.4. Logistics & Transportation
- 10.1.5. Other Categories
- 10.1. Market Analysis, Insights and Forecast - by End-user Industry
- 11. North America Application Maintenance Outsourcing Industry Analysis, Insights and Forecast, 2019-2031
- 11.1. Market Analysis, Insights and Forecast - By Country/Sub-region
- 11.1.1 United States
- 11.1.2 Canada
- 11.1.3 Mexico
- 12. Europe Application Maintenance Outsourcing Industry Analysis, Insights and Forecast, 2019-2031
- 12.1. Market Analysis, Insights and Forecast - By Country/Sub-region
- 12.1.1 Germany
- 12.1.2 United Kingdom
- 12.1.3 France
- 12.1.4 Spain
- 12.1.5 Italy
- 12.1.6 Spain
- 12.1.7 Belgium
- 12.1.8 Netherland
- 12.1.9 Nordics
- 12.1.10 Rest of Europe
- 13. Asia Pacific Application Maintenance Outsourcing Industry Analysis, Insights and Forecast, 2019-2031
- 13.1. Market Analysis, Insights and Forecast - By Country/Sub-region
- 13.1.1 China
- 13.1.2 Japan
- 13.1.3 India
- 13.1.4 South Korea
- 13.1.5 Southeast Asia
- 13.1.6 Australia
- 13.1.7 Indonesia
- 13.1.8 Phillipes
- 13.1.9 Singapore
- 13.1.10 Thailandc
- 13.1.11 Rest of Asia Pacific
- 14. South America Application Maintenance Outsourcing Industry Analysis, Insights and Forecast, 2019-2031
- 14.1. Market Analysis, Insights and Forecast - By Country/Sub-region
- 14.1.1 Brazil
- 14.1.2 Argentina
- 14.1.3 Peru
- 14.1.4 Chile
- 14.1.5 Colombia
- 14.1.6 Ecuador
- 14.1.7 Venezuela
- 14.1.8 Rest of South America
- 15. North America Application Maintenance Outsourcing Industry Analysis, Insights and Forecast, 2019-2031
- 15.1. Market Analysis, Insights and Forecast - By Country/Sub-region
- 15.1.1 United States
- 15.1.2 Canada
- 15.1.3 Mexico
- 16. MEA Application Maintenance Outsourcing Industry Analysis, Insights and Forecast, 2019-2031
- 16.1. Market Analysis, Insights and Forecast - By Country/Sub-region
- 16.1.1 United Arab Emirates
- 16.1.2 Saudi Arabia
- 16.1.3 South Africa
- 16.1.4 Rest of Middle East and Africa
- 17. Competitive Analysis
- 17.1. Global Market Share Analysis 2024
- 17.2. Company Profiles
- 17.2.1 TCS
- 17.2.1.1. Overview
- 17.2.1.2. Products
- 17.2.1.3. SWOT Analysis
- 17.2.1.4. Recent Developments
- 17.2.1.5. Financials (Based on Availability)
- 17.2.2 ATOS SE
- 17.2.2.1. Overview
- 17.2.2.2. Products
- 17.2.2.3. SWOT Analysis
- 17.2.2.4. Recent Developments
- 17.2.2.5. Financials (Based on Availability)
- 17.2.3 HCL
- 17.2.3.1. Overview
- 17.2.3.2. Products
- 17.2.3.3. SWOT Analysis
- 17.2.3.4. Recent Developments
- 17.2.3.5. Financials (Based on Availability)
- 17.2.4 Accenture
- 17.2.4.1. Overview
- 17.2.4.2. Products
- 17.2.4.3. SWOT Analysis
- 17.2.4.4. Recent Developments
- 17.2.4.5. Financials (Based on Availability)
- 17.2.5 CSC
- 17.2.5.1. Overview
- 17.2.5.2. Products
- 17.2.5.3. SWOT Analysis
- 17.2.5.4. Recent Developments
- 17.2.5.5. Financials (Based on Availability)
- 17.2.6 Wipro
- 17.2.6.1. Overview
- 17.2.6.2. Products
- 17.2.6.3. SWOT Analysis
- 17.2.6.4. Recent Developments
- 17.2.6.5. Financials (Based on Availability)
- 17.2.7 Infosys
- 17.2.7.1. Overview
- 17.2.7.2. Products
- 17.2.7.3. SWOT Analysis
- 17.2.7.4. Recent Developments
- 17.2.7.5. Financials (Based on Availability)
- 17.2.8 NTT Data
- 17.2.8.1. Overview
- 17.2.8.2. Products
- 17.2.8.3. SWOT Analysis
- 17.2.8.4. Recent Developments
- 17.2.8.5. Financials (Based on Availability)
- 17.2.9 IBM Global Services
- 17.2.9.1. Overview
- 17.2.9.2. Products
- 17.2.9.3. SWOT Analysis
- 17.2.9.4. Recent Developments
- 17.2.9.5. Financials (Based on Availability)
- 17.2.10 Capgemini
- 17.2.10.1. Overview
- 17.2.10.2. Products
- 17.2.10.3. SWOT Analysis
- 17.2.10.4. Recent Developments
- 17.2.10.5. Financials (Based on Availability)
- 17.2.1 TCS
List of Figures
- Figure 1: Global Application Maintenance Outsourcing Industry Revenue Breakdown (Million, %) by Region 2024 & 2032
- Figure 2: Global Application Maintenance Outsourcing Industry Volume Breakdown (K Unit, %) by Region 2024 & 2032
- Figure 3: North America Application Maintenance Outsourcing Industry Revenue (Million), by Country 2024 & 2032
- Figure 4: North America Application Maintenance Outsourcing Industry Volume (K Unit), by Country 2024 & 2032
- Figure 5: North America Application Maintenance Outsourcing Industry Revenue Share (%), by Country 2024 & 2032
- Figure 6: North America Application Maintenance Outsourcing Industry Volume Share (%), by Country 2024 & 2032
- Figure 7: Europe Application Maintenance Outsourcing Industry Revenue (Million), by Country 2024 & 2032
- Figure 8: Europe Application Maintenance Outsourcing Industry Volume (K Unit), by Country 2024 & 2032
- Figure 9: Europe Application Maintenance Outsourcing Industry Revenue Share (%), by Country 2024 & 2032
- Figure 10: Europe Application Maintenance Outsourcing Industry Volume Share (%), by Country 2024 & 2032
- Figure 11: Asia Pacific Application Maintenance Outsourcing Industry Revenue (Million), by Country 2024 & 2032
- Figure 12: Asia Pacific Application Maintenance Outsourcing Industry Volume (K Unit), by Country 2024 & 2032
- Figure 13: Asia Pacific Application Maintenance Outsourcing Industry Revenue Share (%), by Country 2024 & 2032
- Figure 14: Asia Pacific Application Maintenance Outsourcing Industry Volume Share (%), by Country 2024 & 2032
- Figure 15: South America Application Maintenance Outsourcing Industry Revenue (Million), by Country 2024 & 2032
- Figure 16: South America Application Maintenance Outsourcing Industry Volume (K Unit), by Country 2024 & 2032
- Figure 17: South America Application Maintenance Outsourcing Industry Revenue Share (%), by Country 2024 & 2032
- Figure 18: South America Application Maintenance Outsourcing Industry Volume Share (%), by Country 2024 & 2032
- Figure 19: North America Application Maintenance Outsourcing Industry Revenue (Million), by Country 2024 & 2032
- Figure 20: North America Application Maintenance Outsourcing Industry Volume (K Unit), by Country 2024 & 2032
- Figure 21: North America Application Maintenance Outsourcing Industry Revenue Share (%), by Country 2024 & 2032
- Figure 22: North America Application Maintenance Outsourcing Industry Volume Share (%), by Country 2024 & 2032
- Figure 23: MEA Application Maintenance Outsourcing Industry Revenue (Million), by Country 2024 & 2032
- Figure 24: MEA Application Maintenance Outsourcing Industry Volume (K Unit), by Country 2024 & 2032
- Figure 25: MEA Application Maintenance Outsourcing Industry Revenue Share (%), by Country 2024 & 2032
- Figure 26: MEA Application Maintenance Outsourcing Industry Volume Share (%), by Country 2024 & 2032
- Figure 27: North America Application Maintenance Outsourcing Industry Revenue (Million), by End-user Industry 2024 & 2032
- Figure 28: North America Application Maintenance Outsourcing Industry Volume (K Unit), by End-user Industry 2024 & 2032
- Figure 29: North America Application Maintenance Outsourcing Industry Revenue Share (%), by End-user Industry 2024 & 2032
- Figure 30: North America Application Maintenance Outsourcing Industry Volume Share (%), by End-user Industry 2024 & 2032
- Figure 31: North America Application Maintenance Outsourcing Industry Revenue (Million), by Country 2024 & 2032
- Figure 32: North America Application Maintenance Outsourcing Industry Volume (K Unit), by Country 2024 & 2032
- Figure 33: North America Application Maintenance Outsourcing Industry Revenue Share (%), by Country 2024 & 2032
- Figure 34: North America Application Maintenance Outsourcing Industry Volume Share (%), by Country 2024 & 2032
- Figure 35: Europe Application Maintenance Outsourcing Industry Revenue (Million), by End-user Industry 2024 & 2032
- Figure 36: Europe Application Maintenance Outsourcing Industry Volume (K Unit), by End-user Industry 2024 & 2032
- Figure 37: Europe Application Maintenance Outsourcing Industry Revenue Share (%), by End-user Industry 2024 & 2032
- Figure 38: Europe Application Maintenance Outsourcing Industry Volume Share (%), by End-user Industry 2024 & 2032
- Figure 39: Europe Application Maintenance Outsourcing Industry Revenue (Million), by Country 2024 & 2032
- Figure 40: Europe Application Maintenance Outsourcing Industry Volume (K Unit), by Country 2024 & 2032
- Figure 41: Europe Application Maintenance Outsourcing Industry Revenue Share (%), by Country 2024 & 2032
- Figure 42: Europe Application Maintenance Outsourcing Industry Volume Share (%), by Country 2024 & 2032
- Figure 43: Asia Pacific Application Maintenance Outsourcing Industry Revenue (Million), by End-user Industry 2024 & 2032
- Figure 44: Asia Pacific Application Maintenance Outsourcing Industry Volume (K Unit), by End-user Industry 2024 & 2032
- Figure 45: Asia Pacific Application Maintenance Outsourcing Industry Revenue Share (%), by End-user Industry 2024 & 2032
- Figure 46: Asia Pacific Application Maintenance Outsourcing Industry Volume Share (%), by End-user Industry 2024 & 2032
- Figure 47: Asia Pacific Application Maintenance Outsourcing Industry Revenue (Million), by Country 2024 & 2032
- Figure 48: Asia Pacific Application Maintenance Outsourcing Industry Volume (K Unit), by Country 2024 & 2032
- Figure 49: Asia Pacific Application Maintenance Outsourcing Industry Revenue Share (%), by Country 2024 & 2032
- Figure 50: Asia Pacific Application Maintenance Outsourcing Industry Volume Share (%), by Country 2024 & 2032
- Figure 51: Latin America Application Maintenance Outsourcing Industry Revenue (Million), by End-user Industry 2024 & 2032
- Figure 52: Latin America Application Maintenance Outsourcing Industry Volume (K Unit), by End-user Industry 2024 & 2032
- Figure 53: Latin America Application Maintenance Outsourcing Industry Revenue Share (%), by End-user Industry 2024 & 2032
- Figure 54: Latin America Application Maintenance Outsourcing Industry Volume Share (%), by End-user Industry 2024 & 2032
- Figure 55: Latin America Application Maintenance Outsourcing Industry Revenue (Million), by Country 2024 & 2032
- Figure 56: Latin America Application Maintenance Outsourcing Industry Volume (K Unit), by Country 2024 & 2032
- Figure 57: Latin America Application Maintenance Outsourcing Industry Revenue Share (%), by Country 2024 & 2032
- Figure 58: Latin America Application Maintenance Outsourcing Industry Volume Share (%), by Country 2024 & 2032
- Figure 59: Middle East and Africa Application Maintenance Outsourcing Industry Revenue (Million), by End-user Industry 2024 & 2032
- Figure 60: Middle East and Africa Application Maintenance Outsourcing Industry Volume (K Unit), by End-user Industry 2024 & 2032
- Figure 61: Middle East and Africa Application Maintenance Outsourcing Industry Revenue Share (%), by End-user Industry 2024 & 2032
- Figure 62: Middle East and Africa Application Maintenance Outsourcing Industry Volume Share (%), by End-user Industry 2024 & 2032
- Figure 63: Middle East and Africa Application Maintenance Outsourcing Industry Revenue (Million), by Country 2024 & 2032
- Figure 64: Middle East and Africa Application Maintenance Outsourcing Industry Volume (K Unit), by Country 2024 & 2032
- Figure 65: Middle East and Africa Application Maintenance Outsourcing Industry Revenue Share (%), by Country 2024 & 2032
- Figure 66: Middle East and Africa Application Maintenance Outsourcing Industry Volume Share (%), by Country 2024 & 2032
List of Tables
- Table 1: Global Application Maintenance Outsourcing Industry Revenue Million Forecast, by Region 2019 & 2032
- Table 2: Global Application Maintenance Outsourcing Industry Volume K Unit Forecast, by Region 2019 & 2032
- Table 3: Global Application Maintenance Outsourcing Industry Revenue Million Forecast, by End-user Industry 2019 & 2032
- Table 4: Global Application Maintenance Outsourcing Industry Volume K Unit Forecast, by End-user Industry 2019 & 2032
- Table 5: Global Application Maintenance Outsourcing Industry Revenue Million Forecast, by Region 2019 & 2032
- Table 6: Global Application Maintenance Outsourcing Industry Volume K Unit Forecast, by Region 2019 & 2032
- Table 7: Global Application Maintenance Outsourcing Industry Revenue Million Forecast, by Country 2019 & 2032
- Table 8: Global Application Maintenance Outsourcing Industry Volume K Unit Forecast, by Country 2019 & 2032
- Table 9: United States Application Maintenance Outsourcing Industry Revenue (Million) Forecast, by Application 2019 & 2032
- Table 10: United States Application Maintenance Outsourcing Industry Volume (K Unit) Forecast, by Application 2019 & 2032
- Table 11: Canada Application Maintenance Outsourcing Industry Revenue (Million) Forecast, by Application 2019 & 2032
- Table 12: Canada Application Maintenance Outsourcing Industry Volume (K Unit) Forecast, by Application 2019 & 2032
- Table 13: Mexico Application Maintenance Outsourcing Industry Revenue (Million) Forecast, by Application 2019 & 2032
- Table 14: Mexico Application Maintenance Outsourcing Industry Volume (K Unit) Forecast, by Application 2019 & 2032
- Table 15: Global Application Maintenance Outsourcing Industry Revenue Million Forecast, by Country 2019 & 2032
- Table 16: Global Application Maintenance Outsourcing Industry Volume K Unit Forecast, by Country 2019 & 2032
- Table 17: Germany Application Maintenance Outsourcing Industry Revenue (Million) Forecast, by Application 2019 & 2032
- Table 18: Germany Application Maintenance Outsourcing Industry Volume (K Unit) Forecast, by Application 2019 & 2032
- Table 19: United Kingdom Application Maintenance Outsourcing Industry Revenue (Million) Forecast, by Application 2019 & 2032
- Table 20: United Kingdom Application Maintenance Outsourcing Industry Volume (K Unit) Forecast, by Application 2019 & 2032
- Table 21: France Application Maintenance Outsourcing Industry Revenue (Million) Forecast, by Application 2019 & 2032
- Table 22: France Application Maintenance Outsourcing Industry Volume (K Unit) Forecast, by Application 2019 & 2032
- Table 23: Spain Application Maintenance Outsourcing Industry Revenue (Million) Forecast, by Application 2019 & 2032
- Table 24: Spain Application Maintenance Outsourcing Industry Volume (K Unit) Forecast, by Application 2019 & 2032
- Table 25: Italy Application Maintenance Outsourcing Industry Revenue (Million) Forecast, by Application 2019 & 2032
- Table 26: Italy Application Maintenance Outsourcing Industry Volume (K Unit) Forecast, by Application 2019 & 2032
- Table 27: Spain Application Maintenance Outsourcing Industry Revenue (Million) Forecast, by Application 2019 & 2032
- Table 28: Spain Application Maintenance Outsourcing Industry Volume (K Unit) Forecast, by Application 2019 & 2032
- Table 29: Belgium Application Maintenance Outsourcing Industry Revenue (Million) Forecast, by Application 2019 & 2032
- Table 30: Belgium Application Maintenance Outsourcing Industry Volume (K Unit) Forecast, by Application 2019 & 2032
- Table 31: Netherland Application Maintenance Outsourcing Industry Revenue (Million) Forecast, by Application 2019 & 2032
- Table 32: Netherland Application Maintenance Outsourcing Industry Volume (K Unit) Forecast, by Application 2019 & 2032
- Table 33: Nordics Application Maintenance Outsourcing Industry Revenue (Million) Forecast, by Application 2019 & 2032
- Table 34: Nordics Application Maintenance Outsourcing Industry Volume (K Unit) Forecast, by Application 2019 & 2032
- Table 35: Rest of Europe Application Maintenance Outsourcing Industry Revenue (Million) Forecast, by Application 2019 & 2032
- Table 36: Rest of Europe Application Maintenance Outsourcing Industry Volume (K Unit) Forecast, by Application 2019 & 2032
- Table 37: Global Application Maintenance Outsourcing Industry Revenue Million Forecast, by Country 2019 & 2032
- Table 38: Global Application Maintenance Outsourcing Industry Volume K Unit Forecast, by Country 2019 & 2032
- Table 39: China Application Maintenance Outsourcing Industry Revenue (Million) Forecast, by Application 2019 & 2032
- Table 40: China Application Maintenance Outsourcing Industry Volume (K Unit) Forecast, by Application 2019 & 2032
- Table 41: Japan Application Maintenance Outsourcing Industry Revenue (Million) Forecast, by Application 2019 & 2032
- Table 42: Japan Application Maintenance Outsourcing Industry Volume (K Unit) Forecast, by Application 2019 & 2032
- Table 43: India Application Maintenance Outsourcing Industry Revenue (Million) Forecast, by Application 2019 & 2032
- Table 44: India Application Maintenance Outsourcing Industry Volume (K Unit) Forecast, by Application 2019 & 2032
- Table 45: South Korea Application Maintenance Outsourcing Industry Revenue (Million) Forecast, by Application 2019 & 2032
- Table 46: South Korea Application Maintenance Outsourcing Industry Volume (K Unit) Forecast, by Application 2019 & 2032
- Table 47: Southeast Asia Application Maintenance Outsourcing Industry Revenue (Million) Forecast, by Application 2019 & 2032
- Table 48: Southeast Asia Application Maintenance Outsourcing Industry Volume (K Unit) Forecast, by Application 2019 & 2032
- Table 49: Australia Application Maintenance Outsourcing Industry Revenue (Million) Forecast, by Application 2019 & 2032
- Table 50: Australia Application Maintenance Outsourcing Industry Volume (K Unit) Forecast, by Application 2019 & 2032
- Table 51: Indonesia Application Maintenance Outsourcing Industry Revenue (Million) Forecast, by Application 2019 & 2032
- Table 52: Indonesia Application Maintenance Outsourcing Industry Volume (K Unit) Forecast, by Application 2019 & 2032
- Table 53: Phillipes Application Maintenance Outsourcing Industry Revenue (Million) Forecast, by Application 2019 & 2032
- Table 54: Phillipes Application Maintenance Outsourcing Industry Volume (K Unit) Forecast, by Application 2019 & 2032
- Table 55: Singapore Application Maintenance Outsourcing Industry Revenue (Million) Forecast, by Application 2019 & 2032
- Table 56: Singapore Application Maintenance Outsourcing Industry Volume (K Unit) Forecast, by Application 2019 & 2032
- Table 57: Thailandc Application Maintenance Outsourcing Industry Revenue (Million) Forecast, by Application 2019 & 2032
- Table 58: Thailandc Application Maintenance Outsourcing Industry Volume (K Unit) Forecast, by Application 2019 & 2032
- Table 59: Rest of Asia Pacific Application Maintenance Outsourcing Industry Revenue (Million) Forecast, by Application 2019 & 2032
- Table 60: Rest of Asia Pacific Application Maintenance Outsourcing Industry Volume (K Unit) Forecast, by Application 2019 & 2032
- Table 61: Global Application Maintenance Outsourcing Industry Revenue Million Forecast, by Country 2019 & 2032
- Table 62: Global Application Maintenance Outsourcing Industry Volume K Unit Forecast, by Country 2019 & 2032
- Table 63: Brazil Application Maintenance Outsourcing Industry Revenue (Million) Forecast, by Application 2019 & 2032
- Table 64: Brazil Application Maintenance Outsourcing Industry Volume (K Unit) Forecast, by Application 2019 & 2032
- Table 65: Argentina Application Maintenance Outsourcing Industry Revenue (Million) Forecast, by Application 2019 & 2032
- Table 66: Argentina Application Maintenance Outsourcing Industry Volume (K Unit) Forecast, by Application 2019 & 2032
- Table 67: Peru Application Maintenance Outsourcing Industry Revenue (Million) Forecast, by Application 2019 & 2032
- Table 68: Peru Application Maintenance Outsourcing Industry Volume (K Unit) Forecast, by Application 2019 & 2032
- Table 69: Chile Application Maintenance Outsourcing Industry Revenue (Million) Forecast, by Application 2019 & 2032
- Table 70: Chile Application Maintenance Outsourcing Industry Volume (K Unit) Forecast, by Application 2019 & 2032
- Table 71: Colombia Application Maintenance Outsourcing Industry Revenue (Million) Forecast, by Application 2019 & 2032
- Table 72: Colombia Application Maintenance Outsourcing Industry Volume (K Unit) Forecast, by Application 2019 & 2032
- Table 73: Ecuador Application Maintenance Outsourcing Industry Revenue (Million) Forecast, by Application 2019 & 2032
- Table 74: Ecuador Application Maintenance Outsourcing Industry Volume (K Unit) Forecast, by Application 2019 & 2032
- Table 75: Venezuela Application Maintenance Outsourcing Industry Revenue (Million) Forecast, by Application 2019 & 2032
- Table 76: Venezuela Application Maintenance Outsourcing Industry Volume (K Unit) Forecast, by Application 2019 & 2032
- Table 77: Rest of South America Application Maintenance Outsourcing Industry Revenue (Million) Forecast, by Application 2019 & 2032
- Table 78: Rest of South America Application Maintenance Outsourcing Industry Volume (K Unit) Forecast, by Application 2019 & 2032
- Table 79: Global Application Maintenance Outsourcing Industry Revenue Million Forecast, by Country 2019 & 2032
- Table 80: Global Application Maintenance Outsourcing Industry Volume K Unit Forecast, by Country 2019 & 2032
- Table 81: United States Application Maintenance Outsourcing Industry Revenue (Million) Forecast, by Application 2019 & 2032
- Table 82: United States Application Maintenance Outsourcing Industry Volume (K Unit) Forecast, by Application 2019 & 2032
- Table 83: Canada Application Maintenance Outsourcing Industry Revenue (Million) Forecast, by Application 2019 & 2032
- Table 84: Canada Application Maintenance Outsourcing Industry Volume (K Unit) Forecast, by Application 2019 & 2032
- Table 85: Mexico Application Maintenance Outsourcing Industry Revenue (Million) Forecast, by Application 2019 & 2032
- Table 86: Mexico Application Maintenance Outsourcing Industry Volume (K Unit) Forecast, by Application 2019 & 2032
- Table 87: Global Application Maintenance Outsourcing Industry Revenue Million Forecast, by Country 2019 & 2032
- Table 88: Global Application Maintenance Outsourcing Industry Volume K Unit Forecast, by Country 2019 & 2032
- Table 89: United Arab Emirates Application Maintenance Outsourcing Industry Revenue (Million) Forecast, by Application 2019 & 2032
- Table 90: United Arab Emirates Application Maintenance Outsourcing Industry Volume (K Unit) Forecast, by Application 2019 & 2032
- Table 91: Saudi Arabia Application Maintenance Outsourcing Industry Revenue (Million) Forecast, by Application 2019 & 2032
- Table 92: Saudi Arabia Application Maintenance Outsourcing Industry Volume (K Unit) Forecast, by Application 2019 & 2032
- Table 93: South Africa Application Maintenance Outsourcing Industry Revenue (Million) Forecast, by Application 2019 & 2032
- Table 94: South Africa Application Maintenance Outsourcing Industry Volume (K Unit) Forecast, by Application 2019 & 2032
- Table 95: Rest of Middle East and Africa Application Maintenance Outsourcing Industry Revenue (Million) Forecast, by Application 2019 & 2032
- Table 96: Rest of Middle East and Africa Application Maintenance Outsourcing Industry Volume (K Unit) Forecast, by Application 2019 & 2032
- Table 97: Global Application Maintenance Outsourcing Industry Revenue Million Forecast, by End-user Industry 2019 & 2032
- Table 98: Global Application Maintenance Outsourcing Industry Volume K Unit Forecast, by End-user Industry 2019 & 2032
- Table 99: Global Application Maintenance Outsourcing Industry Revenue Million Forecast, by Country 2019 & 2032
- Table 100: Global Application Maintenance Outsourcing Industry Volume K Unit Forecast, by Country 2019 & 2032
- Table 101: United States Application Maintenance Outsourcing Industry Revenue (Million) Forecast, by Application 2019 & 2032
- Table 102: United States Application Maintenance Outsourcing Industry Volume (K Unit) Forecast, by Application 2019 & 2032
- Table 103: China Application Maintenance Outsourcing Industry Revenue (Million) Forecast, by Application 2019 & 2032
- Table 104: China Application Maintenance Outsourcing Industry Volume (K Unit) Forecast, by Application 2019 & 2032
- Table 105: Global Application Maintenance Outsourcing Industry Revenue Million Forecast, by End-user Industry 2019 & 2032
- Table 106: Global Application Maintenance Outsourcing Industry Volume K Unit Forecast, by End-user Industry 2019 & 2032
- Table 107: Global Application Maintenance Outsourcing Industry Revenue Million Forecast, by Country 2019 & 2032
- Table 108: Global Application Maintenance Outsourcing Industry Volume K Unit Forecast, by Country 2019 & 2032
- Table 109: Germany Application Maintenance Outsourcing Industry Revenue (Million) Forecast, by Application 2019 & 2032
- Table 110: Germany Application Maintenance Outsourcing Industry Volume (K Unit) Forecast, by Application 2019 & 2032
- Table 111: United Kingdom Application Maintenance Outsourcing Industry Revenue (Million) Forecast, by Application 2019 & 2032
- Table 112: United Kingdom Application Maintenance Outsourcing Industry Volume (K Unit) Forecast, by Application 2019 & 2032
- Table 113: France Application Maintenance Outsourcing Industry Revenue (Million) Forecast, by Application 2019 & 2032
- Table 114: France Application Maintenance Outsourcing Industry Volume (K Unit) Forecast, by Application 2019 & 2032
- Table 115: Rest of Europe Application Maintenance Outsourcing Industry Revenue (Million) Forecast, by Application 2019 & 2032
- Table 116: Rest of Europe Application Maintenance Outsourcing Industry Volume (K Unit) Forecast, by Application 2019 & 2032
- Table 117: Global Application Maintenance Outsourcing Industry Revenue Million Forecast, by End-user Industry 2019 & 2032
- Table 118: Global Application Maintenance Outsourcing Industry Volume K Unit Forecast, by End-user Industry 2019 & 2032
- Table 119: Global Application Maintenance Outsourcing Industry Revenue Million Forecast, by Country 2019 & 2032
- Table 120: Global Application Maintenance Outsourcing Industry Volume K Unit Forecast, by Country 2019 & 2032
- Table 121: India Application Maintenance Outsourcing Industry Revenue (Million) Forecast, by Application 2019 & 2032
- Table 122: India Application Maintenance Outsourcing Industry Volume (K Unit) Forecast, by Application 2019 & 2032
- Table 123: China Application Maintenance Outsourcing Industry Revenue (Million) Forecast, by Application 2019 & 2032
- Table 124: China Application Maintenance Outsourcing Industry Volume (K Unit) Forecast, by Application 2019 & 2032
- Table 125: Japan Application Maintenance Outsourcing Industry Revenue (Million) Forecast, by Application 2019 & 2032
- Table 126: Japan Application Maintenance Outsourcing Industry Volume (K Unit) Forecast, by Application 2019 & 2032
- Table 127: South Korea Application Maintenance Outsourcing Industry Revenue (Million) Forecast, by Application 2019 & 2032
- Table 128: South Korea Application Maintenance Outsourcing Industry Volume (K Unit) Forecast, by Application 2019 & 2032
- Table 129: Rest of APAC Application Maintenance Outsourcing Industry Revenue (Million) Forecast, by Application 2019 & 2032
- Table 130: Rest of APAC Application Maintenance Outsourcing Industry Volume (K Unit) Forecast, by Application 2019 & 2032
- Table 131: Global Application Maintenance Outsourcing Industry Revenue Million Forecast, by End-user Industry 2019 & 2032
- Table 132: Global Application Maintenance Outsourcing Industry Volume K Unit Forecast, by End-user Industry 2019 & 2032
- Table 133: Global Application Maintenance Outsourcing Industry Revenue Million Forecast, by Country 2019 & 2032
- Table 134: Global Application Maintenance Outsourcing Industry Volume K Unit Forecast, by Country 2019 & 2032
- Table 135: Global Application Maintenance Outsourcing Industry Revenue Million Forecast, by End-user Industry 2019 & 2032
- Table 136: Global Application Maintenance Outsourcing Industry Volume K Unit Forecast, by End-user Industry 2019 & 2032
- Table 137: Global Application Maintenance Outsourcing Industry Revenue Million Forecast, by Country 2019 & 2032
- Table 138: Global Application Maintenance Outsourcing Industry Volume K Unit Forecast, by Country 2019 & 2032
Frequently Asked Questions
1. What is the projected Compound Annual Growth Rate (CAGR) of the Application Maintenance Outsourcing Industry?
The projected CAGR is approximately 5.32%.
2. Which companies are prominent players in the Application Maintenance Outsourcing Industry?
Key companies in the market include TCS, ATOS SE, HCL, Accenture, CSC, Wipro, Infosys, NTT Data, IBM Global Services, Capgemini.
3. What are the main segments of the Application Maintenance Outsourcing Industry?
The market segments include End-user Industry.
4. Can you provide details about the market size?
The market size is estimated to be USD XX Million as of 2022.
5. What are some drivers contributing to market growth?
Increased demand from BFSI; Growing emphasis on customer retention & engagement; Move towards digital transformation.
6. What are the notable trends driving market growth?
BFSI to have a significant share.
7. Are there any restraints impacting market growth?
Security & Privacy-related concerns.
8. Can you provide examples of recent developments in the market?
N/A
9. What pricing options are available for accessing the report?
Pricing options include single-user, multi-user, and enterprise licenses priced at USD 4750, USD 5250, and USD 8750 respectively.
10. Is the market size provided in terms of value or volume?
The market size is provided in terms of value, measured in Million and volume, measured in K Unit.
11. Are there any specific market keywords associated with the report?
Yes, the market keyword associated with the report is "Application Maintenance Outsourcing Industry," which aids in identifying and referencing the specific market segment covered.
12. How do I determine which pricing option suits my needs best?
The pricing options vary based on user requirements and access needs. Individual users may opt for single-user licenses, while businesses requiring broader access may choose multi-user or enterprise licenses for cost-effective access to the report.
13. Are there any additional resources or data provided in the Application Maintenance Outsourcing Industry report?
While the report offers comprehensive insights, it's advisable to review the specific contents or supplementary materials provided to ascertain if additional resources or data are available.
14. How can I stay updated on further developments or reports in the Application Maintenance Outsourcing Industry?
To stay informed about further developments, trends, and reports in the Application Maintenance Outsourcing Industry, consider subscribing to industry newsletters, following relevant companies and organizations, or regularly checking reputable industry news sources and publications.
Methodology
Step 1 - Identification of Relevant Samples Size from Population Database


Step 2 - Approaches for Defining Global Market Size (Value, Volume* & Price*)

Note*: In applicable scenarios
Step 3 - Data Sources
Primary Research
- Web Analytics
- Survey Reports
- Research Institute
- Latest Research Reports
- Opinion Leaders
Secondary Research
- Annual Reports
- White Paper
- Latest Press Release
- Industry Association
- Paid Database
- Investor Presentations

Step 4 - Data Triangulation
Involves using different sources of information in order to increase the validity of a study
These sources are likely to be stakeholders in a program - participants, other researchers, program staff, other community members, and so on.
Then we put all data in single framework & apply various statistical tools to find out the dynamic on the market.
During the analysis stage, feedback from the stakeholder groups would be compared to determine areas of agreement as well as areas of divergence
