

Key Insights
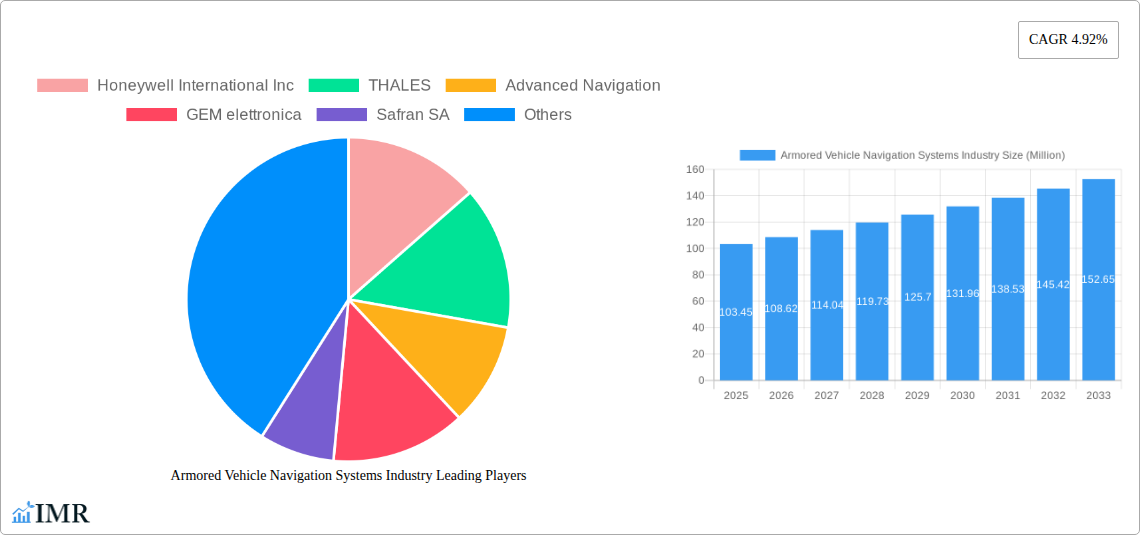
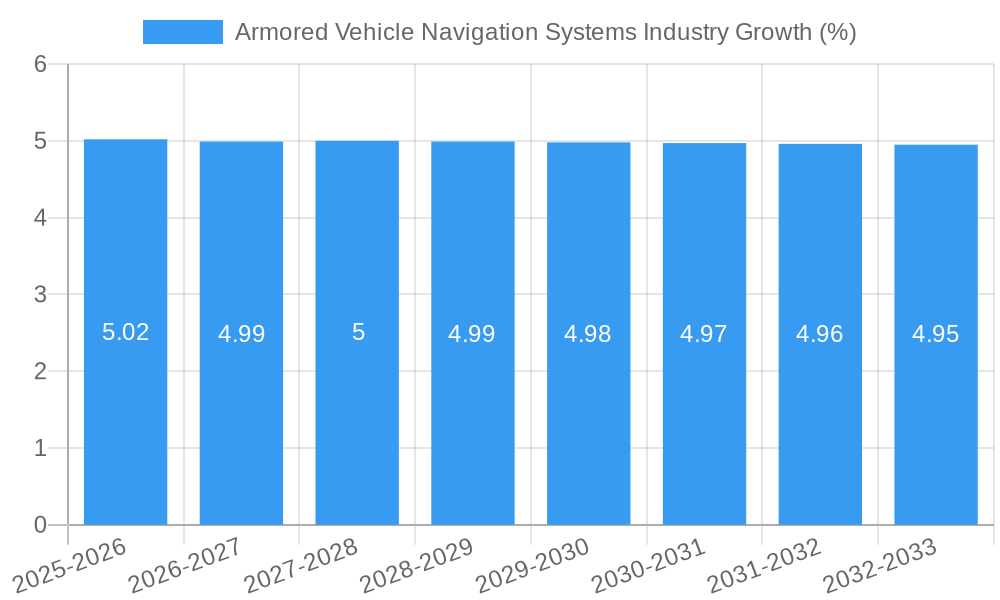
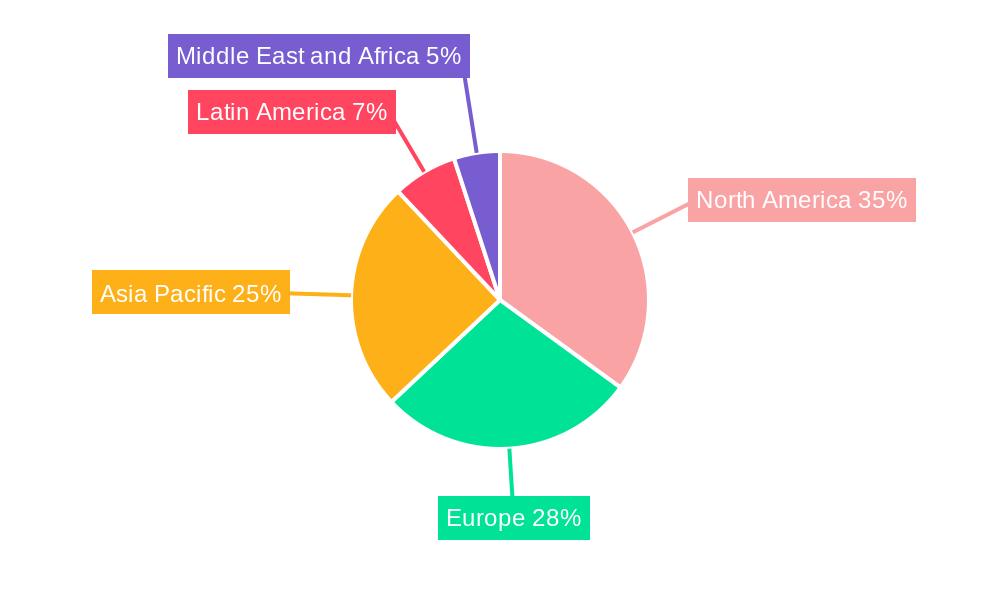
The Armored Vehicle Navigation Systems market, valued at $103.45 million in 2025, is projected to experience robust growth, driven by increasing demand for enhanced situational awareness and precision navigation in military operations. The market's Compound Annual Growth Rate (CAGR) of 4.92% from 2025 to 2033 reflects a steady expansion fueled by technological advancements in inertial navigation systems (INS), satellite navigation systems (SatNav), and the integration of these systems with other advanced technologies like GPS and communication systems. Key drivers include the rising adoption of advanced navigation solutions in modern armored vehicles like Main Battle Tanks (MBTs), Infantry Fighting Vehicles (IFVs), and Armored Personnel Carriers (APCs), a growing focus on improving battlefield effectiveness and reducing friendly fire incidents, and increasing defense budgets globally. Market segmentation reveals a significant share held by satellite navigation systems due to their superior accuracy and wider coverage compared to inertial systems. The regional distribution shows strong growth prospects in Asia-Pacific and the Middle East & Africa driven by modernization initiatives and significant defense spending. However, potential restraints include the high initial investment costs associated with these systems and the challenges posed by GPS jamming and spoofing technologies.
The competitive landscape is characterized by a mix of established defense contractors like Honeywell, Thales, and BAE Systems, along with specialized navigation technology providers like Advanced Navigation and KVH Industries. These companies are actively investing in research and development to offer increasingly sophisticated and resilient navigation solutions. This includes integrating advanced features such as terrain-following capabilities, improved anti-jamming technology, and seamless data integration with command and control systems. Future growth will depend on the continued development of robust and reliable navigation systems capable of withstanding the harsh conditions of modern warfare, and successful adaptation to evolving geopolitical dynamics and technological innovations. The market is poised for significant expansion, driven by the ongoing demand for enhanced capabilities and the continuous investment in defense modernization programs worldwide.
Armored Vehicle Navigation Systems Market Report: 2019-2033
This comprehensive report provides a detailed analysis of the Armored Vehicle Navigation Systems industry, offering invaluable insights for industry professionals, investors, and strategic decision-makers. The study covers the period from 2019 to 2033, with a focus on the forecast period from 2025 to 2033. The base year for the analysis is 2025. The report segments the market by navigation system type (Inertial Navigation System, Satellite Navigation System) and armored vehicle type (Main Battle Tanks, Infantry Fighting Vehicles, Armored Personnel Carriers, Other Armored Vehicle Types). The report values are presented in million units.
Armored Vehicle Navigation Systems Industry Market Dynamics & Structure
The global armored vehicle navigation systems market exhibits a moderately concentrated structure, with key players like Honeywell International Inc, Thales, and BAE Systems holding significant market share. Technological advancements, particularly in GPS augmentation and inertial navigation technologies, are primary growth drivers. Stringent regulatory frameworks governing the use of navigation systems in military applications significantly impact market dynamics. Competition from alternative technologies remains limited, while the end-user demographic is primarily comprised of defense forces and law enforcement agencies. M&A activity in the sector has been relatively modest in recent years, with approximately xx deals recorded between 2019 and 2024, resulting in a xx% market share shift.
- Market Concentration: Moderately concentrated, with top 5 players holding approximately xx% market share in 2025.
- Technological Innovation: Focus on resilient GPS, advanced inertial sensors, and data fusion techniques.
- Regulatory Frameworks: Stringent standards and certifications for military and defense applications.
- Competitive Substitutes: Limited, with minor challenges from alternative positioning technologies.
- End-User Demographics: Primarily defense forces and specialized law enforcement units.
- M&A Trends: Relatively low activity, with xx major deals in the historical period resulting in a xx% market share shift.
- Innovation Barriers: High initial investment costs and rigorous testing & certification processes.
Armored Vehicle Navigation Systems Industry Growth Trends & Insights
The armored vehicle navigation systems market experienced a compound annual growth rate (CAGR) of xx% during the historical period (2019-2024), reaching a market size of xx million units in 2024. This growth is projected to continue, with a forecasted CAGR of xx% from 2025 to 2033, driven by increasing demand for advanced navigation capabilities in modern armored vehicles and rising global defense budgets. Technological disruptions, such as the integration of AI and machine learning for improved situational awareness and autonomous navigation, are significantly influencing market trends. Market penetration is currently estimated at xx% in major defense markets, and adoption rates are expected to increase steadily due to technological advancements and enhanced operational efficiency.
Dominant Regions, Countries, or Segments in Armored Vehicle Navigation Systems Industry
North America and Europe currently dominate the armored vehicle navigation systems market, holding a combined market share of approximately xx% in 2025. This dominance is attributed to significant defense spending, established technological infrastructure, and a high concentration of armored vehicle manufacturers. However, the Asia-Pacific region is expected to witness substantial growth in the forecast period, driven by increasing military modernization efforts and rising demand from rapidly developing economies. Within the segment breakdown:
Navigation System: Satellite navigation systems currently hold a larger market share than inertial navigation systems, driven by their greater accuracy and availability. However, the demand for inertial systems is growing due to their autonomy and anti-jamming features.
Armored Vehicle Type: Main Battle Tanks (MBTs) currently represent the largest segment, followed by Infantry Fighting Vehicles (IFVs) and Armored Personnel Carriers (APCs). The "Other Armored Vehicle Types" segment is also experiencing substantial growth due to increasing utilization of armored vehicles in various non-military applications.
Key Drivers (North America & Europe): High defense spending, technological advancements, established infrastructure.
Key Drivers (Asia-Pacific): Military modernization, rising defense budgets, economic growth.
Market Share: North America (xx%), Europe (xx%), Asia-Pacific (xx%), Rest of World (xx%).
Growth Potential: Asia-Pacific exhibits the highest growth potential.
Armored Vehicle Navigation Systems Industry Product Landscape
The product landscape is characterized by a diverse range of navigation systems offering varying degrees of precision, robustness, and functionality. Recent innovations include advanced data fusion techniques, anti-jamming capabilities, and integration with other vehicle systems for enhanced situational awareness. Unique selling propositions include improved accuracy under challenging conditions, ruggedized design for harsh environments, and seamless integration with existing communication networks. Technological advancements emphasize miniaturization, reduced power consumption, and improved user interface.
Key Drivers, Barriers & Challenges in Armored Vehicle Navigation Systems Industry
Key Drivers:
- Increasing defense budgets globally.
- Growing demand for enhanced situational awareness.
- Technological advancements in navigation and positioning systems.
- Need for improved operational efficiency in military operations.
Key Challenges:
- High initial investment costs associated with advanced navigation systems.
- Dependence on satellite signals, leading to vulnerabilities in GPS-denied environments.
- Stringent regulatory requirements and certification processes.
- Competitive pressure from established and emerging players. The market faces competition from various established navigation providers entering the niche segments of the military domain. This leads to pricing pressure and margin reduction, affecting overall market growth. Supply chain disruptions caused by geopolitical tensions might negatively impact the market, leading to delays and increased costs. These disruptions might restrict the growth of the market to xx% over the forecast period.
Emerging Opportunities in Armored Vehicle Navigation Systems Industry
- Integration of AI and machine learning for autonomous navigation and enhanced decision-making.
- Development of anti-jamming and spoofing-resistant navigation technologies.
- Expansion into new market segments, such as law enforcement and security applications.
- Growing demand for smaller, lighter, and more energy-efficient navigation systems.
Growth Accelerators in the Armored Vehicle Navigation Systems Industry Industry
Technological breakthroughs in areas such as robust GNSS, advanced inertial sensors, and resilient data fusion algorithms are pivotal growth drivers. Strategic partnerships between navigation system manufacturers and armored vehicle producers will streamline integration and accelerate market adoption. Expansion into emerging markets with significant military modernization programs will further fuel market growth.
Key Players Shaping the Armored Vehicle Navigation Systems Market
- Honeywell International Inc
- THALES
- Advanced Navigation
- GEM elettronica
- Safran SA
- Israel Aerospace Industries Ltd
- KVH Industries Inc
- RTX Corporation
- BAE Systems plc
- Northrop Grumman Corporation
- Bharat Electronics Limited (BEL)
- Hertz Systems
Notable Milestones in Armored Vehicle Navigation Systems Industry Sector
- 2020: Introduction of a new, highly resilient GPS receiver by Honeywell.
- 2021: Thales announces a strategic partnership with a major armored vehicle manufacturer.
- 2022: BAE Systems unveils a new navigation system incorporating AI-based predictive capabilities.
- 2023: Successful field testing of a new anti-jamming technology by KVH.
In-Depth Armored Vehicle Navigation Systems Industry Market Outlook
The armored vehicle navigation systems market is poised for robust growth over the coming decade, driven by technological innovation, increased defense spending, and expanding global demand. Strategic partnerships and the adoption of cutting-edge technologies such as AI and machine learning will further enhance market potential. New applications in non-military segments, coupled with a continued focus on improving system reliability and security, will generate considerable growth opportunities for key players.
Armored Vehicle Navigation Systems Industry Segmentation
- 1. Production Analysis
- 2. Consumption Analysis
- 3. Import Market Analysis (Value & Volume)
- 4. Export Market Analysis (Value & Volume)
- 5. Price Trend Analysis
Armored Vehicle Navigation Systems Industry Segmentation By Geography
-
1. North America
- 1.1. United States
- 1.2. Canada
- 1.3. Mexico
-
2. South America
- 2.1. Brazil
- 2.2. Argentina
- 2.3. Rest of South America
-
3. Europe
- 3.1. United Kingdom
- 3.2. Germany
- 3.3. France
- 3.4. Italy
- 3.5. Spain
- 3.6. Russia
- 3.7. Benelux
- 3.8. Nordics
- 3.9. Rest of Europe
-
4. Middle East & Africa
- 4.1. Turkey
- 4.2. Israel
- 4.3. GCC
- 4.4. North Africa
- 4.5. South Africa
- 4.6. Rest of Middle East & Africa
-
5. Asia Pacific
- 5.1. China
- 5.2. India
- 5.3. Japan
- 5.4. South Korea
- 5.5. ASEAN
- 5.6. Oceania
- 5.7. Rest of Asia Pacific
Armored Vehicle Navigation Systems Industry REPORT HIGHLIGHTS
| Aspects | Details |
|---|---|
| Study Period | 2019-2033 |
| Base Year | 2024 |
| Estimated Year | 2025 |
| Forecast Period | 2025-2033 |
| Historical Period | 2019-2024 |
| Growth Rate | CAGR of 4.92% from 2019-2033 |
| Segmentation |
|
Table of Contents
- 1. Introduction
- 1.1. Research Scope
- 1.2. Market Segmentation
- 1.3. Research Methodology
- 1.4. Definitions and Assumptions
- 2. Executive Summary
- 2.1. Introduction
- 3. Market Dynamics
- 3.1. Introduction
- 3.2. Market Drivers
- 3.2.1. ; Increased Seaborne Threats And Ambiguous Maritime Security Policies; Increasing Adoption Of Security Technologies In Bric Countries
- 3.3. Market Restrains
- 3.3.1. ; High Risk Rate In Ungoverned Zones; Unstructured Security Standards And Technologies
- 3.4. Market Trends
- 3.4.1. Inertial Navigation Systems to Exhibit the Highest Growth Rate
- 4. Market Factor Analysis
- 4.1. Porters Five Forces
- 4.2. Supply/Value Chain
- 4.3. PESTEL analysis
- 4.4. Market Entropy
- 4.5. Patent/Trademark Analysis
- 5. Global Armored Vehicle Navigation Systems Industry Analysis, Insights and Forecast, 2019-2031
- 5.1. Market Analysis, Insights and Forecast - by Production Analysis
- 5.2. Market Analysis, Insights and Forecast - by Consumption Analysis
- 5.3. Market Analysis, Insights and Forecast - by Import Market Analysis (Value & Volume)
- 5.4. Market Analysis, Insights and Forecast - by Export Market Analysis (Value & Volume)
- 5.5. Market Analysis, Insights and Forecast - by Price Trend Analysis
- 5.6. Market Analysis, Insights and Forecast - by Region
- 5.6.1. North America
- 5.6.2. South America
- 5.6.3. Europe
- 5.6.4. Middle East & Africa
- 5.6.5. Asia Pacific
- 5.1. Market Analysis, Insights and Forecast - by Production Analysis
- 6. North America Armored Vehicle Navigation Systems Industry Analysis, Insights and Forecast, 2019-2031
- 6.1. Market Analysis, Insights and Forecast - by Production Analysis
- 6.2. Market Analysis, Insights and Forecast - by Consumption Analysis
- 6.3. Market Analysis, Insights and Forecast - by Import Market Analysis (Value & Volume)
- 6.4. Market Analysis, Insights and Forecast - by Export Market Analysis (Value & Volume)
- 6.5. Market Analysis, Insights and Forecast - by Price Trend Analysis
- 6.1. Market Analysis, Insights and Forecast - by Production Analysis
- 7. South America Armored Vehicle Navigation Systems Industry Analysis, Insights and Forecast, 2019-2031
- 7.1. Market Analysis, Insights and Forecast - by Production Analysis
- 7.2. Market Analysis, Insights and Forecast - by Consumption Analysis
- 7.3. Market Analysis, Insights and Forecast - by Import Market Analysis (Value & Volume)
- 7.4. Market Analysis, Insights and Forecast - by Export Market Analysis (Value & Volume)
- 7.5. Market Analysis, Insights and Forecast - by Price Trend Analysis
- 7.1. Market Analysis, Insights and Forecast - by Production Analysis
- 8. Europe Armored Vehicle Navigation Systems Industry Analysis, Insights and Forecast, 2019-2031
- 8.1. Market Analysis, Insights and Forecast - by Production Analysis
- 8.2. Market Analysis, Insights and Forecast - by Consumption Analysis
- 8.3. Market Analysis, Insights and Forecast - by Import Market Analysis (Value & Volume)
- 8.4. Market Analysis, Insights and Forecast - by Export Market Analysis (Value & Volume)
- 8.5. Market Analysis, Insights and Forecast - by Price Trend Analysis
- 8.1. Market Analysis, Insights and Forecast - by Production Analysis
- 9. Middle East & Africa Armored Vehicle Navigation Systems Industry Analysis, Insights and Forecast, 2019-2031
- 9.1. Market Analysis, Insights and Forecast - by Production Analysis
- 9.2. Market Analysis, Insights and Forecast - by Consumption Analysis
- 9.3. Market Analysis, Insights and Forecast - by Import Market Analysis (Value & Volume)
- 9.4. Market Analysis, Insights and Forecast - by Export Market Analysis (Value & Volume)
- 9.5. Market Analysis, Insights and Forecast - by Price Trend Analysis
- 9.1. Market Analysis, Insights and Forecast - by Production Analysis
- 10. Asia Pacific Armored Vehicle Navigation Systems Industry Analysis, Insights and Forecast, 2019-2031
- 10.1. Market Analysis, Insights and Forecast - by Production Analysis
- 10.2. Market Analysis, Insights and Forecast - by Consumption Analysis
- 10.3. Market Analysis, Insights and Forecast - by Import Market Analysis (Value & Volume)
- 10.4. Market Analysis, Insights and Forecast - by Export Market Analysis (Value & Volume)
- 10.5. Market Analysis, Insights and Forecast - by Price Trend Analysis
- 10.1. Market Analysis, Insights and Forecast - by Production Analysis
- 11. North America Armored Vehicle Navigation Systems Industry Analysis, Insights and Forecast, 2019-2031
- 11.1. Market Analysis, Insights and Forecast - By Country/Sub-region
- 11.1.1 United States
- 11.1.2 Canada
- 12. Europe Armored Vehicle Navigation Systems Industry Analysis, Insights and Forecast, 2019-2031
- 12.1. Market Analysis, Insights and Forecast - By Country/Sub-region
- 12.1.1 Germany
- 12.1.2 United Kingdom
- 12.1.3 France
- 12.1.4 Russia
- 12.1.5 Rest of Europe
- 13. Asia Pacific Armored Vehicle Navigation Systems Industry Analysis, Insights and Forecast, 2019-2031
- 13.1. Market Analysis, Insights and Forecast - By Country/Sub-region
- 13.1.1 India
- 13.1.2 China
- 13.1.3 Japan
- 13.1.4 South Korea
- 13.1.5 Australia
- 13.1.6 Rest of Asia Pacific
- 14. Latin America Armored Vehicle Navigation Systems Industry Analysis, Insights and Forecast, 2019-2031
- 14.1. Market Analysis, Insights and Forecast - By Country/Sub-region
- 14.1.1 Mexico
- 14.1.2 Brazil
- 14.1.3 Rest Of Latin America
- 15. Middle East and Africa Armored Vehicle Navigation Systems Industry Analysis, Insights and Forecast, 2019-2031
- 15.1. Market Analysis, Insights and Forecast - By Country/Sub-region
- 15.1.1 United Arab Emirates
- 15.1.2 Saudi Arabia
- 15.1.3 Israel
- 15.1.4 Rest of Middle East and Africa
- 16. Competitive Analysis
- 16.1. Global Market Share Analysis 2024
- 16.2. Company Profiles
- 16.2.1 Honeywell International Inc
- 16.2.1.1. Overview
- 16.2.1.2. Products
- 16.2.1.3. SWOT Analysis
- 16.2.1.4. Recent Developments
- 16.2.1.5. Financials (Based on Availability)
- 16.2.2 THALES
- 16.2.2.1. Overview
- 16.2.2.2. Products
- 16.2.2.3. SWOT Analysis
- 16.2.2.4. Recent Developments
- 16.2.2.5. Financials (Based on Availability)
- 16.2.3 Advanced Navigation
- 16.2.3.1. Overview
- 16.2.3.2. Products
- 16.2.3.3. SWOT Analysis
- 16.2.3.4. Recent Developments
- 16.2.3.5. Financials (Based on Availability)
- 16.2.4 GEM elettronica
- 16.2.4.1. Overview
- 16.2.4.2. Products
- 16.2.4.3. SWOT Analysis
- 16.2.4.4. Recent Developments
- 16.2.4.5. Financials (Based on Availability)
- 16.2.5 Safran SA
- 16.2.5.1. Overview
- 16.2.5.2. Products
- 16.2.5.3. SWOT Analysis
- 16.2.5.4. Recent Developments
- 16.2.5.5. Financials (Based on Availability)
- 16.2.6 Israel Aerospace Industries Ltd
- 16.2.6.1. Overview
- 16.2.6.2. Products
- 16.2.6.3. SWOT Analysis
- 16.2.6.4. Recent Developments
- 16.2.6.5. Financials (Based on Availability)
- 16.2.7 KVH Industries Inc
- 16.2.7.1. Overview
- 16.2.7.2. Products
- 16.2.7.3. SWOT Analysis
- 16.2.7.4. Recent Developments
- 16.2.7.5. Financials (Based on Availability)
- 16.2.8 RTX Corporatio
- 16.2.8.1. Overview
- 16.2.8.2. Products
- 16.2.8.3. SWOT Analysis
- 16.2.8.4. Recent Developments
- 16.2.8.5. Financials (Based on Availability)
- 16.2.9 BAE Systems plc
- 16.2.9.1. Overview
- 16.2.9.2. Products
- 16.2.9.3. SWOT Analysis
- 16.2.9.4. Recent Developments
- 16.2.9.5. Financials (Based on Availability)
- 16.2.10 Northrop Grumman Corporation
- 16.2.10.1. Overview
- 16.2.10.2. Products
- 16.2.10.3. SWOT Analysis
- 16.2.10.4. Recent Developments
- 16.2.10.5. Financials (Based on Availability)
- 16.2.11 Bharat Electronics Limited (BEL)
- 16.2.11.1. Overview
- 16.2.11.2. Products
- 16.2.11.3. SWOT Analysis
- 16.2.11.4. Recent Developments
- 16.2.11.5. Financials (Based on Availability)
- 16.2.12 Hertz Systems
- 16.2.12.1. Overview
- 16.2.12.2. Products
- 16.2.12.3. SWOT Analysis
- 16.2.12.4. Recent Developments
- 16.2.12.5. Financials (Based on Availability)
- 16.2.1 Honeywell International Inc
List of Figures
- Figure 1: Global Armored Vehicle Navigation Systems Industry Revenue Breakdown (Million, %) by Region 2024 & 2032
- Figure 2: North America Armored Vehicle Navigation Systems Industry Revenue (Million), by Country 2024 & 2032
- Figure 3: North America Armored Vehicle Navigation Systems Industry Revenue Share (%), by Country 2024 & 2032
- Figure 4: Europe Armored Vehicle Navigation Systems Industry Revenue (Million), by Country 2024 & 2032
- Figure 5: Europe Armored Vehicle Navigation Systems Industry Revenue Share (%), by Country 2024 & 2032
- Figure 6: Asia Pacific Armored Vehicle Navigation Systems Industry Revenue (Million), by Country 2024 & 2032
- Figure 7: Asia Pacific Armored Vehicle Navigation Systems Industry Revenue Share (%), by Country 2024 & 2032
- Figure 8: Latin America Armored Vehicle Navigation Systems Industry Revenue (Million), by Country 2024 & 2032
- Figure 9: Latin America Armored Vehicle Navigation Systems Industry Revenue Share (%), by Country 2024 & 2032
- Figure 10: Middle East and Africa Armored Vehicle Navigation Systems Industry Revenue (Million), by Country 2024 & 2032
- Figure 11: Middle East and Africa Armored Vehicle Navigation Systems Industry Revenue Share (%), by Country 2024 & 2032
- Figure 12: North America Armored Vehicle Navigation Systems Industry Revenue (Million), by Production Analysis 2024 & 2032
- Figure 13: North America Armored Vehicle Navigation Systems Industry Revenue Share (%), by Production Analysis 2024 & 2032
- Figure 14: North America Armored Vehicle Navigation Systems Industry Revenue (Million), by Consumption Analysis 2024 & 2032
- Figure 15: North America Armored Vehicle Navigation Systems Industry Revenue Share (%), by Consumption Analysis 2024 & 2032
- Figure 16: North America Armored Vehicle Navigation Systems Industry Revenue (Million), by Import Market Analysis (Value & Volume) 2024 & 2032
- Figure 17: North America Armored Vehicle Navigation Systems Industry Revenue Share (%), by Import Market Analysis (Value & Volume) 2024 & 2032
- Figure 18: North America Armored Vehicle Navigation Systems Industry Revenue (Million), by Export Market Analysis (Value & Volume) 2024 & 2032
- Figure 19: North America Armored Vehicle Navigation Systems Industry Revenue Share (%), by Export Market Analysis (Value & Volume) 2024 & 2032
- Figure 20: North America Armored Vehicle Navigation Systems Industry Revenue (Million), by Price Trend Analysis 2024 & 2032
- Figure 21: North America Armored Vehicle Navigation Systems Industry Revenue Share (%), by Price Trend Analysis 2024 & 2032
- Figure 22: North America Armored Vehicle Navigation Systems Industry Revenue (Million), by Country 2024 & 2032
- Figure 23: North America Armored Vehicle Navigation Systems Industry Revenue Share (%), by Country 2024 & 2032
- Figure 24: South America Armored Vehicle Navigation Systems Industry Revenue (Million), by Production Analysis 2024 & 2032
- Figure 25: South America Armored Vehicle Navigation Systems Industry Revenue Share (%), by Production Analysis 2024 & 2032
- Figure 26: South America Armored Vehicle Navigation Systems Industry Revenue (Million), by Consumption Analysis 2024 & 2032
- Figure 27: South America Armored Vehicle Navigation Systems Industry Revenue Share (%), by Consumption Analysis 2024 & 2032
- Figure 28: South America Armored Vehicle Navigation Systems Industry Revenue (Million), by Import Market Analysis (Value & Volume) 2024 & 2032
- Figure 29: South America Armored Vehicle Navigation Systems Industry Revenue Share (%), by Import Market Analysis (Value & Volume) 2024 & 2032
- Figure 30: South America Armored Vehicle Navigation Systems Industry Revenue (Million), by Export Market Analysis (Value & Volume) 2024 & 2032
- Figure 31: South America Armored Vehicle Navigation Systems Industry Revenue Share (%), by Export Market Analysis (Value & Volume) 2024 & 2032
- Figure 32: South America Armored Vehicle Navigation Systems Industry Revenue (Million), by Price Trend Analysis 2024 & 2032
- Figure 33: South America Armored Vehicle Navigation Systems Industry Revenue Share (%), by Price Trend Analysis 2024 & 2032
- Figure 34: South America Armored Vehicle Navigation Systems Industry Revenue (Million), by Country 2024 & 2032
- Figure 35: South America Armored Vehicle Navigation Systems Industry Revenue Share (%), by Country 2024 & 2032
- Figure 36: Europe Armored Vehicle Navigation Systems Industry Revenue (Million), by Production Analysis 2024 & 2032
- Figure 37: Europe Armored Vehicle Navigation Systems Industry Revenue Share (%), by Production Analysis 2024 & 2032
- Figure 38: Europe Armored Vehicle Navigation Systems Industry Revenue (Million), by Consumption Analysis 2024 & 2032
- Figure 39: Europe Armored Vehicle Navigation Systems Industry Revenue Share (%), by Consumption Analysis 2024 & 2032
- Figure 40: Europe Armored Vehicle Navigation Systems Industry Revenue (Million), by Import Market Analysis (Value & Volume) 2024 & 2032
- Figure 41: Europe Armored Vehicle Navigation Systems Industry Revenue Share (%), by Import Market Analysis (Value & Volume) 2024 & 2032
- Figure 42: Europe Armored Vehicle Navigation Systems Industry Revenue (Million), by Export Market Analysis (Value & Volume) 2024 & 2032
- Figure 43: Europe Armored Vehicle Navigation Systems Industry Revenue Share (%), by Export Market Analysis (Value & Volume) 2024 & 2032
- Figure 44: Europe Armored Vehicle Navigation Systems Industry Revenue (Million), by Price Trend Analysis 2024 & 2032
- Figure 45: Europe Armored Vehicle Navigation Systems Industry Revenue Share (%), by Price Trend Analysis 2024 & 2032
- Figure 46: Europe Armored Vehicle Navigation Systems Industry Revenue (Million), by Country 2024 & 2032
- Figure 47: Europe Armored Vehicle Navigation Systems Industry Revenue Share (%), by Country 2024 & 2032
- Figure 48: Middle East & Africa Armored Vehicle Navigation Systems Industry Revenue (Million), by Production Analysis 2024 & 2032
- Figure 49: Middle East & Africa Armored Vehicle Navigation Systems Industry Revenue Share (%), by Production Analysis 2024 & 2032
- Figure 50: Middle East & Africa Armored Vehicle Navigation Systems Industry Revenue (Million), by Consumption Analysis 2024 & 2032
- Figure 51: Middle East & Africa Armored Vehicle Navigation Systems Industry Revenue Share (%), by Consumption Analysis 2024 & 2032
- Figure 52: Middle East & Africa Armored Vehicle Navigation Systems Industry Revenue (Million), by Import Market Analysis (Value & Volume) 2024 & 2032
- Figure 53: Middle East & Africa Armored Vehicle Navigation Systems Industry Revenue Share (%), by Import Market Analysis (Value & Volume) 2024 & 2032
- Figure 54: Middle East & Africa Armored Vehicle Navigation Systems Industry Revenue (Million), by Export Market Analysis (Value & Volume) 2024 & 2032
- Figure 55: Middle East & Africa Armored Vehicle Navigation Systems Industry Revenue Share (%), by Export Market Analysis (Value & Volume) 2024 & 2032
- Figure 56: Middle East & Africa Armored Vehicle Navigation Systems Industry Revenue (Million), by Price Trend Analysis 2024 & 2032
- Figure 57: Middle East & Africa Armored Vehicle Navigation Systems Industry Revenue Share (%), by Price Trend Analysis 2024 & 2032
- Figure 58: Middle East & Africa Armored Vehicle Navigation Systems Industry Revenue (Million), by Country 2024 & 2032
- Figure 59: Middle East & Africa Armored Vehicle Navigation Systems Industry Revenue Share (%), by Country 2024 & 2032
- Figure 60: Asia Pacific Armored Vehicle Navigation Systems Industry Revenue (Million), by Production Analysis 2024 & 2032
- Figure 61: Asia Pacific Armored Vehicle Navigation Systems Industry Revenue Share (%), by Production Analysis 2024 & 2032
- Figure 62: Asia Pacific Armored Vehicle Navigation Systems Industry Revenue (Million), by Consumption Analysis 2024 & 2032
- Figure 63: Asia Pacific Armored Vehicle Navigation Systems Industry Revenue Share (%), by Consumption Analysis 2024 & 2032
- Figure 64: Asia Pacific Armored Vehicle Navigation Systems Industry Revenue (Million), by Import Market Analysis (Value & Volume) 2024 & 2032
- Figure 65: Asia Pacific Armored Vehicle Navigation Systems Industry Revenue Share (%), by Import Market Analysis (Value & Volume) 2024 & 2032
- Figure 66: Asia Pacific Armored Vehicle Navigation Systems Industry Revenue (Million), by Export Market Analysis (Value & Volume) 2024 & 2032
- Figure 67: Asia Pacific Armored Vehicle Navigation Systems Industry Revenue Share (%), by Export Market Analysis (Value & Volume) 2024 & 2032
- Figure 68: Asia Pacific Armored Vehicle Navigation Systems Industry Revenue (Million), by Price Trend Analysis 2024 & 2032
- Figure 69: Asia Pacific Armored Vehicle Navigation Systems Industry Revenue Share (%), by Price Trend Analysis 2024 & 2032
- Figure 70: Asia Pacific Armored Vehicle Navigation Systems Industry Revenue (Million), by Country 2024 & 2032
- Figure 71: Asia Pacific Armored Vehicle Navigation Systems Industry Revenue Share (%), by Country 2024 & 2032
List of Tables
- Table 1: Global Armored Vehicle Navigation Systems Industry Revenue Million Forecast, by Region 2019 & 2032
- Table 2: Global Armored Vehicle Navigation Systems Industry Revenue Million Forecast, by Production Analysis 2019 & 2032
- Table 3: Global Armored Vehicle Navigation Systems Industry Revenue Million Forecast, by Consumption Analysis 2019 & 2032
- Table 4: Global Armored Vehicle Navigation Systems Industry Revenue Million Forecast, by Import Market Analysis (Value & Volume) 2019 & 2032
- Table 5: Global Armored Vehicle Navigation Systems Industry Revenue Million Forecast, by Export Market Analysis (Value & Volume) 2019 & 2032
- Table 6: Global Armored Vehicle Navigation Systems Industry Revenue Million Forecast, by Price Trend Analysis 2019 & 2032
- Table 7: Global Armored Vehicle Navigation Systems Industry Revenue Million Forecast, by Region 2019 & 2032
- Table 8: Global Armored Vehicle Navigation Systems Industry Revenue Million Forecast, by Country 2019 & 2032
- Table 9: United States Armored Vehicle Navigation Systems Industry Revenue (Million) Forecast, by Application 2019 & 2032
- Table 10: Canada Armored Vehicle Navigation Systems Industry Revenue (Million) Forecast, by Application 2019 & 2032
- Table 11: Global Armored Vehicle Navigation Systems Industry Revenue Million Forecast, by Country 2019 & 2032
- Table 12: Germany Armored Vehicle Navigation Systems Industry Revenue (Million) Forecast, by Application 2019 & 2032
- Table 13: United Kingdom Armored Vehicle Navigation Systems Industry Revenue (Million) Forecast, by Application 2019 & 2032
- Table 14: France Armored Vehicle Navigation Systems Industry Revenue (Million) Forecast, by Application 2019 & 2032
- Table 15: Russia Armored Vehicle Navigation Systems Industry Revenue (Million) Forecast, by Application 2019 & 2032
- Table 16: Rest of Europe Armored Vehicle Navigation Systems Industry Revenue (Million) Forecast, by Application 2019 & 2032
- Table 17: Global Armored Vehicle Navigation Systems Industry Revenue Million Forecast, by Country 2019 & 2032
- Table 18: India Armored Vehicle Navigation Systems Industry Revenue (Million) Forecast, by Application 2019 & 2032
- Table 19: China Armored Vehicle Navigation Systems Industry Revenue (Million) Forecast, by Application 2019 & 2032
- Table 20: Japan Armored Vehicle Navigation Systems Industry Revenue (Million) Forecast, by Application 2019 & 2032
- Table 21: South Korea Armored Vehicle Navigation Systems Industry Revenue (Million) Forecast, by Application 2019 & 2032
- Table 22: Australia Armored Vehicle Navigation Systems Industry Revenue (Million) Forecast, by Application 2019 & 2032
- Table 23: Rest of Asia Pacific Armored Vehicle Navigation Systems Industry Revenue (Million) Forecast, by Application 2019 & 2032
- Table 24: Global Armored Vehicle Navigation Systems Industry Revenue Million Forecast, by Country 2019 & 2032
- Table 25: Mexico Armored Vehicle Navigation Systems Industry Revenue (Million) Forecast, by Application 2019 & 2032
- Table 26: Brazil Armored Vehicle Navigation Systems Industry Revenue (Million) Forecast, by Application 2019 & 2032
- Table 27: Rest Of Latin America Armored Vehicle Navigation Systems Industry Revenue (Million) Forecast, by Application 2019 & 2032
- Table 28: Global Armored Vehicle Navigation Systems Industry Revenue Million Forecast, by Country 2019 & 2032
- Table 29: United Arab Emirates Armored Vehicle Navigation Systems Industry Revenue (Million) Forecast, by Application 2019 & 2032
- Table 30: Saudi Arabia Armored Vehicle Navigation Systems Industry Revenue (Million) Forecast, by Application 2019 & 2032
- Table 31: Israel Armored Vehicle Navigation Systems Industry Revenue (Million) Forecast, by Application 2019 & 2032
- Table 32: Rest of Middle East and Africa Armored Vehicle Navigation Systems Industry Revenue (Million) Forecast, by Application 2019 & 2032
- Table 33: Global Armored Vehicle Navigation Systems Industry Revenue Million Forecast, by Production Analysis 2019 & 2032
- Table 34: Global Armored Vehicle Navigation Systems Industry Revenue Million Forecast, by Consumption Analysis 2019 & 2032
- Table 35: Global Armored Vehicle Navigation Systems Industry Revenue Million Forecast, by Import Market Analysis (Value & Volume) 2019 & 2032
- Table 36: Global Armored Vehicle Navigation Systems Industry Revenue Million Forecast, by Export Market Analysis (Value & Volume) 2019 & 2032
- Table 37: Global Armored Vehicle Navigation Systems Industry Revenue Million Forecast, by Price Trend Analysis 2019 & 2032
- Table 38: Global Armored Vehicle Navigation Systems Industry Revenue Million Forecast, by Country 2019 & 2032
- Table 39: United States Armored Vehicle Navigation Systems Industry Revenue (Million) Forecast, by Application 2019 & 2032
- Table 40: Canada Armored Vehicle Navigation Systems Industry Revenue (Million) Forecast, by Application 2019 & 2032
- Table 41: Mexico Armored Vehicle Navigation Systems Industry Revenue (Million) Forecast, by Application 2019 & 2032
- Table 42: Global Armored Vehicle Navigation Systems Industry Revenue Million Forecast, by Production Analysis 2019 & 2032
- Table 43: Global Armored Vehicle Navigation Systems Industry Revenue Million Forecast, by Consumption Analysis 2019 & 2032
- Table 44: Global Armored Vehicle Navigation Systems Industry Revenue Million Forecast, by Import Market Analysis (Value & Volume) 2019 & 2032
- Table 45: Global Armored Vehicle Navigation Systems Industry Revenue Million Forecast, by Export Market Analysis (Value & Volume) 2019 & 2032
- Table 46: Global Armored Vehicle Navigation Systems Industry Revenue Million Forecast, by Price Trend Analysis 2019 & 2032
- Table 47: Global Armored Vehicle Navigation Systems Industry Revenue Million Forecast, by Country 2019 & 2032
- Table 48: Brazil Armored Vehicle Navigation Systems Industry Revenue (Million) Forecast, by Application 2019 & 2032
- Table 49: Argentina Armored Vehicle Navigation Systems Industry Revenue (Million) Forecast, by Application 2019 & 2032
- Table 50: Rest of South America Armored Vehicle Navigation Systems Industry Revenue (Million) Forecast, by Application 2019 & 2032
- Table 51: Global Armored Vehicle Navigation Systems Industry Revenue Million Forecast, by Production Analysis 2019 & 2032
- Table 52: Global Armored Vehicle Navigation Systems Industry Revenue Million Forecast, by Consumption Analysis 2019 & 2032
- Table 53: Global Armored Vehicle Navigation Systems Industry Revenue Million Forecast, by Import Market Analysis (Value & Volume) 2019 & 2032
- Table 54: Global Armored Vehicle Navigation Systems Industry Revenue Million Forecast, by Export Market Analysis (Value & Volume) 2019 & 2032
- Table 55: Global Armored Vehicle Navigation Systems Industry Revenue Million Forecast, by Price Trend Analysis 2019 & 2032
- Table 56: Global Armored Vehicle Navigation Systems Industry Revenue Million Forecast, by Country 2019 & 2032
- Table 57: United Kingdom Armored Vehicle Navigation Systems Industry Revenue (Million) Forecast, by Application 2019 & 2032
- Table 58: Germany Armored Vehicle Navigation Systems Industry Revenue (Million) Forecast, by Application 2019 & 2032
- Table 59: France Armored Vehicle Navigation Systems Industry Revenue (Million) Forecast, by Application 2019 & 2032
- Table 60: Italy Armored Vehicle Navigation Systems Industry Revenue (Million) Forecast, by Application 2019 & 2032
- Table 61: Spain Armored Vehicle Navigation Systems Industry Revenue (Million) Forecast, by Application 2019 & 2032
- Table 62: Russia Armored Vehicle Navigation Systems Industry Revenue (Million) Forecast, by Application 2019 & 2032
- Table 63: Benelux Armored Vehicle Navigation Systems Industry Revenue (Million) Forecast, by Application 2019 & 2032
- Table 64: Nordics Armored Vehicle Navigation Systems Industry Revenue (Million) Forecast, by Application 2019 & 2032
- Table 65: Rest of Europe Armored Vehicle Navigation Systems Industry Revenue (Million) Forecast, by Application 2019 & 2032
- Table 66: Global Armored Vehicle Navigation Systems Industry Revenue Million Forecast, by Production Analysis 2019 & 2032
- Table 67: Global Armored Vehicle Navigation Systems Industry Revenue Million Forecast, by Consumption Analysis 2019 & 2032
- Table 68: Global Armored Vehicle Navigation Systems Industry Revenue Million Forecast, by Import Market Analysis (Value & Volume) 2019 & 2032
- Table 69: Global Armored Vehicle Navigation Systems Industry Revenue Million Forecast, by Export Market Analysis (Value & Volume) 2019 & 2032
- Table 70: Global Armored Vehicle Navigation Systems Industry Revenue Million Forecast, by Price Trend Analysis 2019 & 2032
- Table 71: Global Armored Vehicle Navigation Systems Industry Revenue Million Forecast, by Country 2019 & 2032
- Table 72: Turkey Armored Vehicle Navigation Systems Industry Revenue (Million) Forecast, by Application 2019 & 2032
- Table 73: Israel Armored Vehicle Navigation Systems Industry Revenue (Million) Forecast, by Application 2019 & 2032
- Table 74: GCC Armored Vehicle Navigation Systems Industry Revenue (Million) Forecast, by Application 2019 & 2032
- Table 75: North Africa Armored Vehicle Navigation Systems Industry Revenue (Million) Forecast, by Application 2019 & 2032
- Table 76: South Africa Armored Vehicle Navigation Systems Industry Revenue (Million) Forecast, by Application 2019 & 2032
- Table 77: Rest of Middle East & Africa Armored Vehicle Navigation Systems Industry Revenue (Million) Forecast, by Application 2019 & 2032
- Table 78: Global Armored Vehicle Navigation Systems Industry Revenue Million Forecast, by Production Analysis 2019 & 2032
- Table 79: Global Armored Vehicle Navigation Systems Industry Revenue Million Forecast, by Consumption Analysis 2019 & 2032
- Table 80: Global Armored Vehicle Navigation Systems Industry Revenue Million Forecast, by Import Market Analysis (Value & Volume) 2019 & 2032
- Table 81: Global Armored Vehicle Navigation Systems Industry Revenue Million Forecast, by Export Market Analysis (Value & Volume) 2019 & 2032
- Table 82: Global Armored Vehicle Navigation Systems Industry Revenue Million Forecast, by Price Trend Analysis 2019 & 2032
- Table 83: Global Armored Vehicle Navigation Systems Industry Revenue Million Forecast, by Country 2019 & 2032
- Table 84: China Armored Vehicle Navigation Systems Industry Revenue (Million) Forecast, by Application 2019 & 2032
- Table 85: India Armored Vehicle Navigation Systems Industry Revenue (Million) Forecast, by Application 2019 & 2032
- Table 86: Japan Armored Vehicle Navigation Systems Industry Revenue (Million) Forecast, by Application 2019 & 2032
- Table 87: South Korea Armored Vehicle Navigation Systems Industry Revenue (Million) Forecast, by Application 2019 & 2032
- Table 88: ASEAN Armored Vehicle Navigation Systems Industry Revenue (Million) Forecast, by Application 2019 & 2032
- Table 89: Oceania Armored Vehicle Navigation Systems Industry Revenue (Million) Forecast, by Application 2019 & 2032
- Table 90: Rest of Asia Pacific Armored Vehicle Navigation Systems Industry Revenue (Million) Forecast, by Application 2019 & 2032
Frequently Asked Questions
1. What is the projected Compound Annual Growth Rate (CAGR) of the Armored Vehicle Navigation Systems Industry?
The projected CAGR is approximately 4.92%.
2. Which companies are prominent players in the Armored Vehicle Navigation Systems Industry?
Key companies in the market include Honeywell International Inc, THALES, Advanced Navigation, GEM elettronica, Safran SA, Israel Aerospace Industries Ltd, KVH Industries Inc, RTX Corporatio, BAE Systems plc, Northrop Grumman Corporation, Bharat Electronics Limited (BEL), Hertz Systems.
3. What are the main segments of the Armored Vehicle Navigation Systems Industry?
The market segments include Production Analysis, Consumption Analysis, Import Market Analysis (Value & Volume), Export Market Analysis (Value & Volume), Price Trend Analysis.
4. Can you provide details about the market size?
The market size is estimated to be USD 103.45 Million as of 2022.
5. What are some drivers contributing to market growth?
; Increased Seaborne Threats And Ambiguous Maritime Security Policies; Increasing Adoption Of Security Technologies In Bric Countries.
6. What are the notable trends driving market growth?
Inertial Navigation Systems to Exhibit the Highest Growth Rate.
7. Are there any restraints impacting market growth?
; High Risk Rate In Ungoverned Zones; Unstructured Security Standards And Technologies.
8. Can you provide examples of recent developments in the market?
N/A
9. What pricing options are available for accessing the report?
Pricing options include single-user, multi-user, and enterprise licenses priced at USD 4750, USD 5250, and USD 8750 respectively.
10. Is the market size provided in terms of value or volume?
The market size is provided in terms of value, measured in Million.
11. Are there any specific market keywords associated with the report?
Yes, the market keyword associated with the report is "Armored Vehicle Navigation Systems Industry," which aids in identifying and referencing the specific market segment covered.
12. How do I determine which pricing option suits my needs best?
The pricing options vary based on user requirements and access needs. Individual users may opt for single-user licenses, while businesses requiring broader access may choose multi-user or enterprise licenses for cost-effective access to the report.
13. Are there any additional resources or data provided in the Armored Vehicle Navigation Systems Industry report?
While the report offers comprehensive insights, it's advisable to review the specific contents or supplementary materials provided to ascertain if additional resources or data are available.
14. How can I stay updated on further developments or reports in the Armored Vehicle Navigation Systems Industry?
To stay informed about further developments, trends, and reports in the Armored Vehicle Navigation Systems Industry, consider subscribing to industry newsletters, following relevant companies and organizations, or regularly checking reputable industry news sources and publications.
Methodology
Step 1 - Identification of Relevant Samples Size from Population Database


Step 2 - Approaches for Defining Global Market Size (Value, Volume* & Price*)

Note*: In applicable scenarios
Step 3 - Data Sources
Primary Research
- Web Analytics
- Survey Reports
- Research Institute
- Latest Research Reports
- Opinion Leaders
Secondary Research
- Annual Reports
- White Paper
- Latest Press Release
- Industry Association
- Paid Database
- Investor Presentations

Step 4 - Data Triangulation
Involves using different sources of information in order to increase the validity of a study
These sources are likely to be stakeholders in a program - participants, other researchers, program staff, other community members, and so on.
Then we put all data in single framework & apply various statistical tools to find out the dynamic on the market.
During the analysis stage, feedback from the stakeholder groups would be compared to determine areas of agreement as well as areas of divergence
