

Key Insights
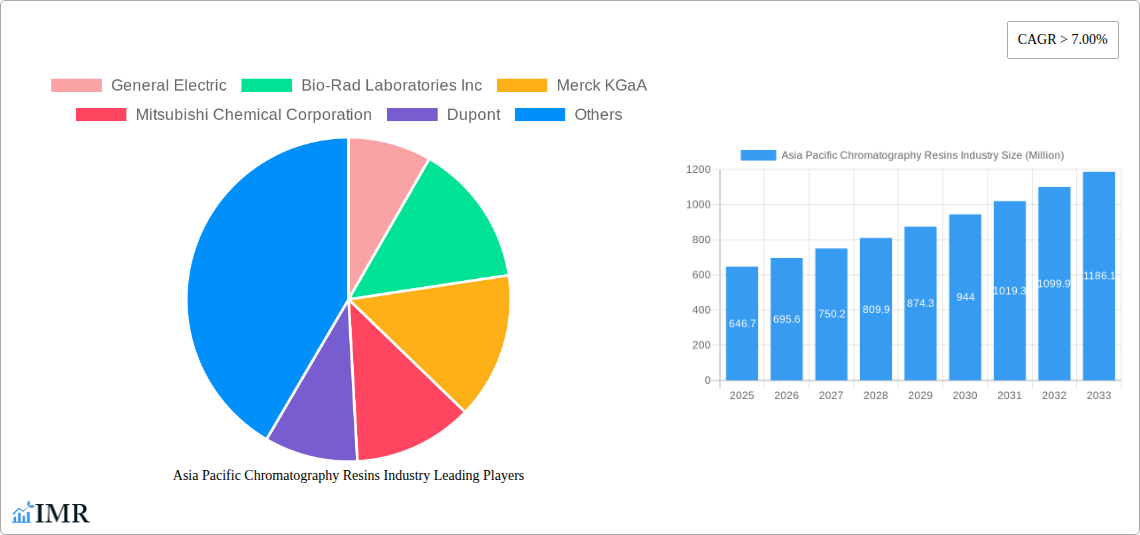
The Asia Pacific chromatography resins market, valued at $646.7 million in 2025, is poised for robust growth, exhibiting a Compound Annual Growth Rate (CAGR) exceeding 7.00% from 2025 to 2033. This expansion is driven by the burgeoning pharmaceutical and biotechnology sectors in the region, particularly in China, India, and Japan, which are experiencing significant investments in drug discovery and development. Increased demand for high-purity biopharmaceuticals and the growing adoption of advanced chromatographic techniques are key factors fueling market growth. Furthermore, the rising prevalence of chronic diseases necessitates advanced diagnostic tools and treatments, further stimulating the demand for chromatography resins. The segment dominated by drug production, specifically within water and environmental agencies, is expected to witness substantial growth, owing to stringent regulatory requirements and increasing environmental concerns. Natural-based chromatography resins currently hold a larger market share but synthetic-based dextran resins are expected to witness faster growth due to their superior performance characteristics and tailor-ability for specific applications. Ion exchange chromatography resins currently comprise the largest technological segment, reflecting the widespread use of this technique across various applications.
However, the market faces certain challenges. Fluctuations in raw material prices and the complexity of the technology associated with chromatography resin manufacturing can constrain market growth. Competition from established players alongside the emergence of new players in the market presents an additional dynamic. Nevertheless, continued technological advancements, focusing on improved resin efficiency, selectivity, and scalability, are expected to mitigate these challenges and sustain the market's upward trajectory. Specific growth within the Asia Pacific region is likely to be influenced by governmental initiatives promoting pharmaceutical and biotechnological development, along with expanding collaborations between research institutions and private companies. The continued focus on innovative drug discovery and development will significantly impact the demand for high-quality chromatography resins in the foreseeable future.
Asia Pacific Chromatography Resins Industry: Market Analysis & Forecast 2019-2033
This comprehensive report provides an in-depth analysis of the Asia Pacific Chromatography Resins industry, covering market dynamics, growth trends, dominant segments, key players, and future outlook. The study period spans from 2019 to 2033, with 2025 as the base year and forecast period from 2025 to 2033. The report uses a robust methodology combining primary and secondary research to deliver accurate and reliable insights for industry professionals, investors, and researchers. The market is segmented by origin (natural-based, synthetic-based (dextran)), technology (ion exchange, affinity, size exclusion, hydrophobic interaction, others), end-user industry (pharmaceuticals, drug production, water & environmental agencies, food & beverages, other industries), and geography across the Asia-Pacific region.
Asia Pacific Chromatography Resins Industry Market Dynamics & Structure
The Asia Pacific chromatography resins market is characterized by moderate concentration, with key players like General Electric, Bio-Rad Laboratories Inc, Merck KGaA, Mitsubishi Chemical Corporation, DuPont, Pall Corporation, Tosoh Bioscience LLC, Purolite, Agilent Technologies, Avantor Inc, and Thermo Fisher Scientific holding significant market share. However, the presence of numerous smaller players indicates a competitive landscape. Technological innovation, driven by the demand for higher efficiency and selectivity, is a key driver, while stringent regulatory frameworks influence product development and market access. The market witnesses consistent M&A activity, with larger players seeking to expand their product portfolios and geographic reach. Substitute technologies, while present, haven't significantly impacted market growth due to the unique capabilities of chromatography resins.
- Market Concentration: Moderately concentrated, with a few dominant players and numerous smaller companies. The top 5 players hold an estimated xx% market share in 2025.
- Technological Innovation: Strong focus on improving resin efficiency, selectivity, and scalability, leading to continuous product improvements.
- Regulatory Frameworks: Stringent regulations regarding purity and safety standards impact product development and market entry.
- Competitive Product Substitutes: Limited impact due to the unique advantages of chromatography in various applications.
- M&A Trends: Significant activity in the past five years, with an estimated xx M&A deals involving chromatography resin companies. Deals primarily focus on expanding product lines and geographic reach.
- End-User Demographics: Growing demand from pharmaceutical and biotech companies, driven by rising drug discovery and development activities.
Asia Pacific Chromatography Resins Industry Growth Trends & Insights
The Asia Pacific chromatography resins market experienced robust growth during the historical period (2019-2024), exhibiting a CAGR of xx%. This growth is primarily attributed to increasing demand from the pharmaceutical and biotechnology sectors, along with expanding applications in other industries such as food and beverages, water treatment, and environmental monitoring. The market is expected to maintain a healthy growth trajectory during the forecast period (2025-2033), driven by technological advancements, rising research and development activities, and increasing government support for healthcare and environmental protection. Market penetration in emerging economies within the Asia-Pacific region remains relatively low, presenting significant growth opportunities. Adoption rates are increasing steadily, particularly in countries with developing healthcare infrastructure. Technological disruptions, such as the emergence of novel resin materials and advanced separation techniques, further enhance market expansion. Consumer behavior is shifting towards eco-friendly and cost-effective solutions, creating demand for sustainable and high-performance chromatography resins.
- Market Size (2025): xx Million Units
- CAGR (2019-2024): xx%
- CAGR (2025-2033): xx%
- Market Penetration (2025): xx%

Dominant Regions, Countries, or Segments in Asia Pacific Chromatography Resins Industry
China and Japan are currently the dominant markets within the Asia-Pacific region, driven by strong pharmaceutical industries and robust research and development investments. However, other countries like India, South Korea, and Singapore are experiencing rapid growth. Within the segments, the pharmaceutical end-user industry is the largest contributor, followed by drug production and water & environmental agencies. In terms of technology, ion exchange chromatography resins hold the largest market share, owing to their versatility and widespread applications. Synthetic-based (dextran) resins are gaining popularity due to their superior performance characteristics.
Key Growth Drivers:
- China: Strong pharmaceutical sector, significant government investment in healthcare infrastructure.
- Japan: Advanced biotech industry, high demand for high-quality resins in pharmaceutical and industrial applications.
- India: Rapidly developing pharmaceutical sector, expanding research and development capabilities.
- Pharmaceutical Industry: High demand for chromatography resins in drug discovery, development, and manufacturing.
- Ion Exchange Chromatography Resins: Versatility and widespread applicability across various industries.
- Synthetic-based (Dextran) Resins: Superior performance and growing adoption rates.
Dominance Factors:
- Established pharmaceutical and biotech industries in China and Japan.
- Growing healthcare spending and infrastructure development in emerging economies.
- Technological advancements driving adoption of advanced resin types.
Asia Pacific Chromatography Resins Industry Product Landscape
The Asia Pacific chromatography resins market showcases a diverse range of products, including ion exchange, affinity, size exclusion, hydrophobic interaction, and other specialized resins. These resins are characterized by varying selectivity, binding capacity, and particle size, tailored to specific applications. Recent innovations include the development of monolithic resins, which offer higher flow rates and improved efficiency. Furthermore, advancements in resin materials, such as the use of novel polymers and functional groups, enhance separation performance and durability. Key selling propositions focus on high purity, consistent performance, and cost-effectiveness.
Key Drivers, Barriers & Challenges in Asia Pacific Chromatography Resins Industry
Key Drivers:
- Increasing demand from the pharmaceutical and biotechnology sectors.
- Rising investments in research and development of new drugs and biopharmaceuticals.
- Growing focus on environmental monitoring and water purification.
- Technological advancements leading to improved resin performance.
Key Challenges & Restraints:
- Price fluctuations in raw materials and manufacturing costs.
- Stringent regulatory requirements related to product safety and purity.
- Intense competition among existing players.
- Supply chain disruptions can impact resin availability and prices. The pandemic illustrated this vulnerability with estimated xx% disruption to supply.
Emerging Opportunities in Asia Pacific Chromatography Resins Industry
- Expansion into untapped markets in Southeast Asia.
- Development of customized resins for niche applications, such as personalized medicine.
- Growing demand for eco-friendly and sustainable resins.
- Increasing adoption of advanced analytical techniques that require high-performance resins.
Growth Accelerators in the Asia Pacific Chromatography Resins Industry Industry
Long-term growth will be fueled by strategic partnerships between resin manufacturers and end-users to optimize resin performance and reduce costs. Continued technological advancements, particularly in materials science, will create more efficient and selective resins. Expanding into new applications in areas like biofuels and environmental remediation will further accelerate market growth.
Key Players Shaping the Asia Pacific Chromatography Resins Industry Market
- General Electric
- Bio-Rad Laboratories Inc
- Merck KGaA
- Mitsubishi Chemical Corporation
- Dupont
- Pall Corporation
- Tosoh Bioscience LLC
- Purolite
- Agilent Technologies
- Avantor Inc
- Thermo Fisher Scientific
Notable Milestones in Asia Pacific Chromatography Resins Industry Sector
- 2020: Launch of a novel monolithic resin by [Company Name] offering improved efficiency and flow rate.
- 2022: Acquisition of [Company Name] by [Company Name], expanding product portfolio and market reach.
- 2023: Introduction of a new generation of environmentally friendly resins by [Company Name]. (Specific details would be added here from actual data)
In-Depth Asia Pacific Chromatography Resins Industry Market Outlook
The Asia Pacific chromatography resins market is poised for continued growth, driven by the factors mentioned previously. The expansion into emerging markets, technological advancements, and the increasing demand from various sectors point to a bright future for this industry. Strategic partnerships and investments in research and development will play a crucial role in shaping the market landscape in the coming years. The market is expected to surpass xx Million Units by 2033, representing substantial growth opportunities for existing and new players.
Asia Pacific Chromatography Resins Industry Segmentation
-
1. Origin
-
1.1. Natural-based
- 1.1.1. Agarose
- 1.1.2. Dextran
-
1.2. Synthetic-based
- 1.2.1. Silica Gel
- 1.2.2. Aluminum Oxide
- 1.2.3. Polystyrene
- 1.2.4. Other Synthetic-based Resins
-
1.1. Natural-based
-
2. Technology
- 2.1. Ion Exchange Chromatography Resins
- 2.2. Affinity Chromatography Resins
- 2.3. Size Exclusion Chromatography Resins
- 2.4. Hydrophobic Interaction Chromatography Resins
- 2.5. Other Technologies
-
3. End-user Industry
-
3.1. Pharmaceuticals
- 3.1.1. Biotechnology
- 3.1.2. Drug Discovery
- 3.1.3. Drug Production
- 3.2. Water and Environmental Agencies
- 3.3. Food and Beverages
- 3.4. Other End-user Industries
-
3.1. Pharmaceuticals
-
4. Geography
- 4.1. China
- 4.2. India
- 4.3. Japan
- 4.4. Rest of Asia-Pacific
Asia Pacific Chromatography Resins Industry Segmentation By Geography
- 1. China
- 2. India
- 3. Japan
- 4. Rest of Asia Pacific

Asia Pacific Chromatography Resins Industry REPORT HIGHLIGHTS
| Aspects | Details |
|---|---|
| Study Period | 2019-2033 |
| Base Year | 2024 |
| Estimated Year | 2025 |
| Forecast Period | 2025-2033 |
| Historical Period | 2019-2024 |
| Growth Rate | CAGR of > 7.00% from 2019-2033 |
| Segmentation |
|
Table of Contents
- 1. Introduction
- 1.1. Research Scope
- 1.2. Market Segmentation
- 1.3. Research Methodology
- 1.4. Definitions and Assumptions
- 2. Executive Summary
- 2.1. Introduction
- 3. Market Dynamics
- 3.1. Introduction
- 3.2. Market Drivers
- 3.2.1. ; Rising Demand from the Pharmaceutical Sector; Technological Advancements in Chromatography Resins; Increasing Importance of Chromatography Tests in Drug Approvals
- 3.3. Market Restrains
- 3.3.1. ; High Costs vs. Productivity of Chromatography Systems
- 3.4. Market Trends
- 3.4.1. Increasing Demand from Pharmaceutical Sector
- 4. Market Factor Analysis
- 4.1. Porters Five Forces
- 4.2. Supply/Value Chain
- 4.3. PESTEL analysis
- 4.4. Market Entropy
- 4.5. Patent/Trademark Analysis
- 5. Asia Pacific Chromatography Resins Industry Analysis, Insights and Forecast, 2019-2031
- 5.1. Market Analysis, Insights and Forecast - by Origin
- 5.1.1. Natural-based
- 5.1.1.1. Agarose
- 5.1.1.2. Dextran
- 5.1.2. Synthetic-based
- 5.1.2.1. Silica Gel
- 5.1.2.2. Aluminum Oxide
- 5.1.2.3. Polystyrene
- 5.1.2.4. Other Synthetic-based Resins
- 5.1.1. Natural-based
- 5.2. Market Analysis, Insights and Forecast - by Technology
- 5.2.1. Ion Exchange Chromatography Resins
- 5.2.2. Affinity Chromatography Resins
- 5.2.3. Size Exclusion Chromatography Resins
- 5.2.4. Hydrophobic Interaction Chromatography Resins
- 5.2.5. Other Technologies
- 5.3. Market Analysis, Insights and Forecast - by End-user Industry
- 5.3.1. Pharmaceuticals
- 5.3.1.1. Biotechnology
- 5.3.1.2. Drug Discovery
- 5.3.1.3. Drug Production
- 5.3.2. Water and Environmental Agencies
- 5.3.3. Food and Beverages
- 5.3.4. Other End-user Industries
- 5.3.1. Pharmaceuticals
- 5.4. Market Analysis, Insights and Forecast - by Geography
- 5.4.1. China
- 5.4.2. India
- 5.4.3. Japan
- 5.4.4. Rest of Asia-Pacific
- 5.5. Market Analysis, Insights and Forecast - by Region
- 5.5.1. China
- 5.5.2. India
- 5.5.3. Japan
- 5.5.4. Rest of Asia Pacific
- 5.1. Market Analysis, Insights and Forecast - by Origin
- 6. China Asia Pacific Chromatography Resins Industry Analysis, Insights and Forecast, 2019-2031
- 6.1. Market Analysis, Insights and Forecast - by Origin
- 6.1.1. Natural-based
- 6.1.1.1. Agarose
- 6.1.1.2. Dextran
- 6.1.2. Synthetic-based
- 6.1.2.1. Silica Gel
- 6.1.2.2. Aluminum Oxide
- 6.1.2.3. Polystyrene
- 6.1.2.4. Other Synthetic-based Resins
- 6.1.1. Natural-based
- 6.2. Market Analysis, Insights and Forecast - by Technology
- 6.2.1. Ion Exchange Chromatography Resins
- 6.2.2. Affinity Chromatography Resins
- 6.2.3. Size Exclusion Chromatography Resins
- 6.2.4. Hydrophobic Interaction Chromatography Resins
- 6.2.5. Other Technologies
- 6.3. Market Analysis, Insights and Forecast - by End-user Industry
- 6.3.1. Pharmaceuticals
- 6.3.1.1. Biotechnology
- 6.3.1.2. Drug Discovery
- 6.3.1.3. Drug Production
- 6.3.2. Water and Environmental Agencies
- 6.3.3. Food and Beverages
- 6.3.4. Other End-user Industries
- 6.3.1. Pharmaceuticals
- 6.4. Market Analysis, Insights and Forecast - by Geography
- 6.4.1. China
- 6.4.2. India
- 6.4.3. Japan
- 6.4.4. Rest of Asia-Pacific
- 6.1. Market Analysis, Insights and Forecast - by Origin
- 7. India Asia Pacific Chromatography Resins Industry Analysis, Insights and Forecast, 2019-2031
- 7.1. Market Analysis, Insights and Forecast - by Origin
- 7.1.1. Natural-based
- 7.1.1.1. Agarose
- 7.1.1.2. Dextran
- 7.1.2. Synthetic-based
- 7.1.2.1. Silica Gel
- 7.1.2.2. Aluminum Oxide
- 7.1.2.3. Polystyrene
- 7.1.2.4. Other Synthetic-based Resins
- 7.1.1. Natural-based
- 7.2. Market Analysis, Insights and Forecast - by Technology
- 7.2.1. Ion Exchange Chromatography Resins
- 7.2.2. Affinity Chromatography Resins
- 7.2.3. Size Exclusion Chromatography Resins
- 7.2.4. Hydrophobic Interaction Chromatography Resins
- 7.2.5. Other Technologies
- 7.3. Market Analysis, Insights and Forecast - by End-user Industry
- 7.3.1. Pharmaceuticals
- 7.3.1.1. Biotechnology
- 7.3.1.2. Drug Discovery
- 7.3.1.3. Drug Production
- 7.3.2. Water and Environmental Agencies
- 7.3.3. Food and Beverages
- 7.3.4. Other End-user Industries
- 7.3.1. Pharmaceuticals
- 7.4. Market Analysis, Insights and Forecast - by Geography
- 7.4.1. China
- 7.4.2. India
- 7.4.3. Japan
- 7.4.4. Rest of Asia-Pacific
- 7.1. Market Analysis, Insights and Forecast - by Origin
- 8. Japan Asia Pacific Chromatography Resins Industry Analysis, Insights and Forecast, 2019-2031
- 8.1. Market Analysis, Insights and Forecast - by Origin
- 8.1.1. Natural-based
- 8.1.1.1. Agarose
- 8.1.1.2. Dextran
- 8.1.2. Synthetic-based
- 8.1.2.1. Silica Gel
- 8.1.2.2. Aluminum Oxide
- 8.1.2.3. Polystyrene
- 8.1.2.4. Other Synthetic-based Resins
- 8.1.1. Natural-based
- 8.2. Market Analysis, Insights and Forecast - by Technology
- 8.2.1. Ion Exchange Chromatography Resins
- 8.2.2. Affinity Chromatography Resins
- 8.2.3. Size Exclusion Chromatography Resins
- 8.2.4. Hydrophobic Interaction Chromatography Resins
- 8.2.5. Other Technologies
- 8.3. Market Analysis, Insights and Forecast - by End-user Industry
- 8.3.1. Pharmaceuticals
- 8.3.1.1. Biotechnology
- 8.3.1.2. Drug Discovery
- 8.3.1.3. Drug Production
- 8.3.2. Water and Environmental Agencies
- 8.3.3. Food and Beverages
- 8.3.4. Other End-user Industries
- 8.3.1. Pharmaceuticals
- 8.4. Market Analysis, Insights and Forecast - by Geography
- 8.4.1. China
- 8.4.2. India
- 8.4.3. Japan
- 8.4.4. Rest of Asia-Pacific
- 8.1. Market Analysis, Insights and Forecast - by Origin
- 9. Rest of Asia Pacific Asia Pacific Chromatography Resins Industry Analysis, Insights and Forecast, 2019-2031
- 9.1. Market Analysis, Insights and Forecast - by Origin
- 9.1.1. Natural-based
- 9.1.1.1. Agarose
- 9.1.1.2. Dextran
- 9.1.2. Synthetic-based
- 9.1.2.1. Silica Gel
- 9.1.2.2. Aluminum Oxide
- 9.1.2.3. Polystyrene
- 9.1.2.4. Other Synthetic-based Resins
- 9.1.1. Natural-based
- 9.2. Market Analysis, Insights and Forecast - by Technology
- 9.2.1. Ion Exchange Chromatography Resins
- 9.2.2. Affinity Chromatography Resins
- 9.2.3. Size Exclusion Chromatography Resins
- 9.2.4. Hydrophobic Interaction Chromatography Resins
- 9.2.5. Other Technologies
- 9.3. Market Analysis, Insights and Forecast - by End-user Industry
- 9.3.1. Pharmaceuticals
- 9.3.1.1. Biotechnology
- 9.3.1.2. Drug Discovery
- 9.3.1.3. Drug Production
- 9.3.2. Water and Environmental Agencies
- 9.3.3. Food and Beverages
- 9.3.4. Other End-user Industries
- 9.3.1. Pharmaceuticals
- 9.4. Market Analysis, Insights and Forecast - by Geography
- 9.4.1. China
- 9.4.2. India
- 9.4.3. Japan
- 9.4.4. Rest of Asia-Pacific
- 9.1. Market Analysis, Insights and Forecast - by Origin
- 10. China Asia Pacific Chromatography Resins Industry Analysis, Insights and Forecast, 2019-2031
- 11. Japan Asia Pacific Chromatography Resins Industry Analysis, Insights and Forecast, 2019-2031
- 12. India Asia Pacific Chromatography Resins Industry Analysis, Insights and Forecast, 2019-2031
- 13. South Korea Asia Pacific Chromatography Resins Industry Analysis, Insights and Forecast, 2019-2031
- 14. Taiwan Asia Pacific Chromatography Resins Industry Analysis, Insights and Forecast, 2019-2031
- 15. Australia Asia Pacific Chromatography Resins Industry Analysis, Insights and Forecast, 2019-2031
- 16. Rest of Asia-Pacific Asia Pacific Chromatography Resins Industry Analysis, Insights and Forecast, 2019-2031
- 17. Competitive Analysis
- 17.1. Market Share Analysis 2024
- 17.2. Company Profiles
- 17.2.1 General Electric
- 17.2.1.1. Overview
- 17.2.1.2. Products
- 17.2.1.3. SWOT Analysis
- 17.2.1.4. Recent Developments
- 17.2.1.5. Financials (Based on Availability)
- 17.2.2 Bio-Rad Laboratories Inc
- 17.2.2.1. Overview
- 17.2.2.2. Products
- 17.2.2.3. SWOT Analysis
- 17.2.2.4. Recent Developments
- 17.2.2.5. Financials (Based on Availability)
- 17.2.3 Merck KGaA
- 17.2.3.1. Overview
- 17.2.3.2. Products
- 17.2.3.3. SWOT Analysis
- 17.2.3.4. Recent Developments
- 17.2.3.5. Financials (Based on Availability)
- 17.2.4 Mitsubishi Chemical Corporation
- 17.2.4.1. Overview
- 17.2.4.2. Products
- 17.2.4.3. SWOT Analysis
- 17.2.4.4. Recent Developments
- 17.2.4.5. Financials (Based on Availability)
- 17.2.5 Dupont
- 17.2.5.1. Overview
- 17.2.5.2. Products
- 17.2.5.3. SWOT Analysis
- 17.2.5.4. Recent Developments
- 17.2.5.5. Financials (Based on Availability)
- 17.2.6 Pall Corporation
- 17.2.6.1. Overview
- 17.2.6.2. Products
- 17.2.6.3. SWOT Analysis
- 17.2.6.4. Recent Developments
- 17.2.6.5. Financials (Based on Availability)
- 17.2.7 Tosoh Bioscience LLC*List Not Exhaustive
- 17.2.7.1. Overview
- 17.2.7.2. Products
- 17.2.7.3. SWOT Analysis
- 17.2.7.4. Recent Developments
- 17.2.7.5. Financials (Based on Availability)
- 17.2.8 Purolite
- 17.2.8.1. Overview
- 17.2.8.2. Products
- 17.2.8.3. SWOT Analysis
- 17.2.8.4. Recent Developments
- 17.2.8.5. Financials (Based on Availability)
- 17.2.9 Agilient Technologies
- 17.2.9.1. Overview
- 17.2.9.2. Products
- 17.2.9.3. SWOT Analysis
- 17.2.9.4. Recent Developments
- 17.2.9.5. Financials (Based on Availability)
- 17.2.10 Avantor Inc
- 17.2.10.1. Overview
- 17.2.10.2. Products
- 17.2.10.3. SWOT Analysis
- 17.2.10.4. Recent Developments
- 17.2.10.5. Financials (Based on Availability)
- 17.2.11 Thermo Fisher Scientific
- 17.2.11.1. Overview
- 17.2.11.2. Products
- 17.2.11.3. SWOT Analysis
- 17.2.11.4. Recent Developments
- 17.2.11.5. Financials (Based on Availability)
- 17.2.1 General Electric
List of Figures
- Figure 1: Asia Pacific Chromatography Resins Industry Revenue Breakdown (Million, %) by Product 2024 & 2032
- Figure 2: Asia Pacific Chromatography Resins Industry Share (%) by Company 2024
List of Tables
- Table 1: Asia Pacific Chromatography Resins Industry Revenue Million Forecast, by Region 2019 & 2032
- Table 2: Asia Pacific Chromatography Resins Industry Volume K Tons Forecast, by Region 2019 & 2032
- Table 3: Asia Pacific Chromatography Resins Industry Revenue Million Forecast, by Origin 2019 & 2032
- Table 4: Asia Pacific Chromatography Resins Industry Volume K Tons Forecast, by Origin 2019 & 2032
- Table 5: Asia Pacific Chromatography Resins Industry Revenue Million Forecast, by Technology 2019 & 2032
- Table 6: Asia Pacific Chromatography Resins Industry Volume K Tons Forecast, by Technology 2019 & 2032
- Table 7: Asia Pacific Chromatography Resins Industry Revenue Million Forecast, by End-user Industry 2019 & 2032
- Table 8: Asia Pacific Chromatography Resins Industry Volume K Tons Forecast, by End-user Industry 2019 & 2032
- Table 9: Asia Pacific Chromatography Resins Industry Revenue Million Forecast, by Geography 2019 & 2032
- Table 10: Asia Pacific Chromatography Resins Industry Volume K Tons Forecast, by Geography 2019 & 2032
- Table 11: Asia Pacific Chromatography Resins Industry Revenue Million Forecast, by Region 2019 & 2032
- Table 12: Asia Pacific Chromatography Resins Industry Volume K Tons Forecast, by Region 2019 & 2032
- Table 13: Asia Pacific Chromatography Resins Industry Revenue Million Forecast, by Country 2019 & 2032
- Table 14: Asia Pacific Chromatography Resins Industry Volume K Tons Forecast, by Country 2019 & 2032
- Table 15: China Asia Pacific Chromatography Resins Industry Revenue (Million) Forecast, by Application 2019 & 2032
- Table 16: China Asia Pacific Chromatography Resins Industry Volume (K Tons) Forecast, by Application 2019 & 2032
- Table 17: Japan Asia Pacific Chromatography Resins Industry Revenue (Million) Forecast, by Application 2019 & 2032
- Table 18: Japan Asia Pacific Chromatography Resins Industry Volume (K Tons) Forecast, by Application 2019 & 2032
- Table 19: India Asia Pacific Chromatography Resins Industry Revenue (Million) Forecast, by Application 2019 & 2032
- Table 20: India Asia Pacific Chromatography Resins Industry Volume (K Tons) Forecast, by Application 2019 & 2032
- Table 21: South Korea Asia Pacific Chromatography Resins Industry Revenue (Million) Forecast, by Application 2019 & 2032
- Table 22: South Korea Asia Pacific Chromatography Resins Industry Volume (K Tons) Forecast, by Application 2019 & 2032
- Table 23: Taiwan Asia Pacific Chromatography Resins Industry Revenue (Million) Forecast, by Application 2019 & 2032
- Table 24: Taiwan Asia Pacific Chromatography Resins Industry Volume (K Tons) Forecast, by Application 2019 & 2032
- Table 25: Australia Asia Pacific Chromatography Resins Industry Revenue (Million) Forecast, by Application 2019 & 2032
- Table 26: Australia Asia Pacific Chromatography Resins Industry Volume (K Tons) Forecast, by Application 2019 & 2032
- Table 27: Rest of Asia-Pacific Asia Pacific Chromatography Resins Industry Revenue (Million) Forecast, by Application 2019 & 2032
- Table 28: Rest of Asia-Pacific Asia Pacific Chromatography Resins Industry Volume (K Tons) Forecast, by Application 2019 & 2032
- Table 29: Asia Pacific Chromatography Resins Industry Revenue Million Forecast, by Origin 2019 & 2032
- Table 30: Asia Pacific Chromatography Resins Industry Volume K Tons Forecast, by Origin 2019 & 2032
- Table 31: Asia Pacific Chromatography Resins Industry Revenue Million Forecast, by Technology 2019 & 2032
- Table 32: Asia Pacific Chromatography Resins Industry Volume K Tons Forecast, by Technology 2019 & 2032
- Table 33: Asia Pacific Chromatography Resins Industry Revenue Million Forecast, by End-user Industry 2019 & 2032
- Table 34: Asia Pacific Chromatography Resins Industry Volume K Tons Forecast, by End-user Industry 2019 & 2032
- Table 35: Asia Pacific Chromatography Resins Industry Revenue Million Forecast, by Geography 2019 & 2032
- Table 36: Asia Pacific Chromatography Resins Industry Volume K Tons Forecast, by Geography 2019 & 2032
- Table 37: Asia Pacific Chromatography Resins Industry Revenue Million Forecast, by Country 2019 & 2032
- Table 38: Asia Pacific Chromatography Resins Industry Volume K Tons Forecast, by Country 2019 & 2032
- Table 39: Asia Pacific Chromatography Resins Industry Revenue Million Forecast, by Origin 2019 & 2032
- Table 40: Asia Pacific Chromatography Resins Industry Volume K Tons Forecast, by Origin 2019 & 2032
- Table 41: Asia Pacific Chromatography Resins Industry Revenue Million Forecast, by Technology 2019 & 2032
- Table 42: Asia Pacific Chromatography Resins Industry Volume K Tons Forecast, by Technology 2019 & 2032
- Table 43: Asia Pacific Chromatography Resins Industry Revenue Million Forecast, by End-user Industry 2019 & 2032
- Table 44: Asia Pacific Chromatography Resins Industry Volume K Tons Forecast, by End-user Industry 2019 & 2032
- Table 45: Asia Pacific Chromatography Resins Industry Revenue Million Forecast, by Geography 2019 & 2032
- Table 46: Asia Pacific Chromatography Resins Industry Volume K Tons Forecast, by Geography 2019 & 2032
- Table 47: Asia Pacific Chromatography Resins Industry Revenue Million Forecast, by Country 2019 & 2032
- Table 48: Asia Pacific Chromatography Resins Industry Volume K Tons Forecast, by Country 2019 & 2032
- Table 49: Asia Pacific Chromatography Resins Industry Revenue Million Forecast, by Origin 2019 & 2032
- Table 50: Asia Pacific Chromatography Resins Industry Volume K Tons Forecast, by Origin 2019 & 2032
- Table 51: Asia Pacific Chromatography Resins Industry Revenue Million Forecast, by Technology 2019 & 2032
- Table 52: Asia Pacific Chromatography Resins Industry Volume K Tons Forecast, by Technology 2019 & 2032
- Table 53: Asia Pacific Chromatography Resins Industry Revenue Million Forecast, by End-user Industry 2019 & 2032
- Table 54: Asia Pacific Chromatography Resins Industry Volume K Tons Forecast, by End-user Industry 2019 & 2032
- Table 55: Asia Pacific Chromatography Resins Industry Revenue Million Forecast, by Geography 2019 & 2032
- Table 56: Asia Pacific Chromatography Resins Industry Volume K Tons Forecast, by Geography 2019 & 2032
- Table 57: Asia Pacific Chromatography Resins Industry Revenue Million Forecast, by Country 2019 & 2032
- Table 58: Asia Pacific Chromatography Resins Industry Volume K Tons Forecast, by Country 2019 & 2032
- Table 59: Asia Pacific Chromatography Resins Industry Revenue Million Forecast, by Origin 2019 & 2032
- Table 60: Asia Pacific Chromatography Resins Industry Volume K Tons Forecast, by Origin 2019 & 2032
- Table 61: Asia Pacific Chromatography Resins Industry Revenue Million Forecast, by Technology 2019 & 2032
- Table 62: Asia Pacific Chromatography Resins Industry Volume K Tons Forecast, by Technology 2019 & 2032
- Table 63: Asia Pacific Chromatography Resins Industry Revenue Million Forecast, by End-user Industry 2019 & 2032
- Table 64: Asia Pacific Chromatography Resins Industry Volume K Tons Forecast, by End-user Industry 2019 & 2032
- Table 65: Asia Pacific Chromatography Resins Industry Revenue Million Forecast, by Geography 2019 & 2032
- Table 66: Asia Pacific Chromatography Resins Industry Volume K Tons Forecast, by Geography 2019 & 2032
- Table 67: Asia Pacific Chromatography Resins Industry Revenue Million Forecast, by Country 2019 & 2032
- Table 68: Asia Pacific Chromatography Resins Industry Volume K Tons Forecast, by Country 2019 & 2032
Frequently Asked Questions
1. What is the projected Compound Annual Growth Rate (CAGR) of the Asia Pacific Chromatography Resins Industry?
The projected CAGR is approximately > 7.00%.
2. Which companies are prominent players in the Asia Pacific Chromatography Resins Industry?
Key companies in the market include General Electric, Bio-Rad Laboratories Inc, Merck KGaA, Mitsubishi Chemical Corporation, Dupont, Pall Corporation, Tosoh Bioscience LLC*List Not Exhaustive, Purolite, Agilient Technologies, Avantor Inc, Thermo Fisher Scientific.
3. What are the main segments of the Asia Pacific Chromatography Resins Industry?
The market segments include Origin, Technology, End-user Industry, Geography.
4. Can you provide details about the market size?
The market size is estimated to be USD 646.7 Million as of 2022.
5. What are some drivers contributing to market growth?
; Rising Demand from the Pharmaceutical Sector; Technological Advancements in Chromatography Resins; Increasing Importance of Chromatography Tests in Drug Approvals.
6. What are the notable trends driving market growth?
Increasing Demand from Pharmaceutical Sector.
7. Are there any restraints impacting market growth?
; High Costs vs. Productivity of Chromatography Systems.
8. Can you provide examples of recent developments in the market?
N/A
9. What pricing options are available for accessing the report?
Pricing options include single-user, multi-user, and enterprise licenses priced at USD 4750, USD 5250, and USD 8750 respectively.
10. Is the market size provided in terms of value or volume?
The market size is provided in terms of value, measured in Million and volume, measured in K Tons.
11. Are there any specific market keywords associated with the report?
Yes, the market keyword associated with the report is "Asia Pacific Chromatography Resins Industry," which aids in identifying and referencing the specific market segment covered.
12. How do I determine which pricing option suits my needs best?
The pricing options vary based on user requirements and access needs. Individual users may opt for single-user licenses, while businesses requiring broader access may choose multi-user or enterprise licenses for cost-effective access to the report.
13. Are there any additional resources or data provided in the Asia Pacific Chromatography Resins Industry report?
While the report offers comprehensive insights, it's advisable to review the specific contents or supplementary materials provided to ascertain if additional resources or data are available.
14. How can I stay updated on further developments or reports in the Asia Pacific Chromatography Resins Industry?
To stay informed about further developments, trends, and reports in the Asia Pacific Chromatography Resins Industry, consider subscribing to industry newsletters, following relevant companies and organizations, or regularly checking reputable industry news sources and publications.
Methodology
Step 1 - Identification of Relevant Samples Size from Population Database


Step 2 - Approaches for Defining Global Market Size (Value, Volume* & Price*)

Note*: In applicable scenarios
Step 3 - Data Sources
Primary Research
- Web Analytics
- Survey Reports
- Research Institute
- Latest Research Reports
- Opinion Leaders
Secondary Research
- Annual Reports
- White Paper
- Latest Press Release
- Industry Association
- Paid Database
- Investor Presentations

Step 4 - Data Triangulation
Involves using different sources of information in order to increase the validity of a study
These sources are likely to be stakeholders in a program - participants, other researchers, program staff, other community members, and so on.
Then we put all data in single framework & apply various statistical tools to find out the dynamic on the market.
During the analysis stage, feedback from the stakeholder groups would be compared to determine areas of agreement as well as areas of divergence
