

Key Insights
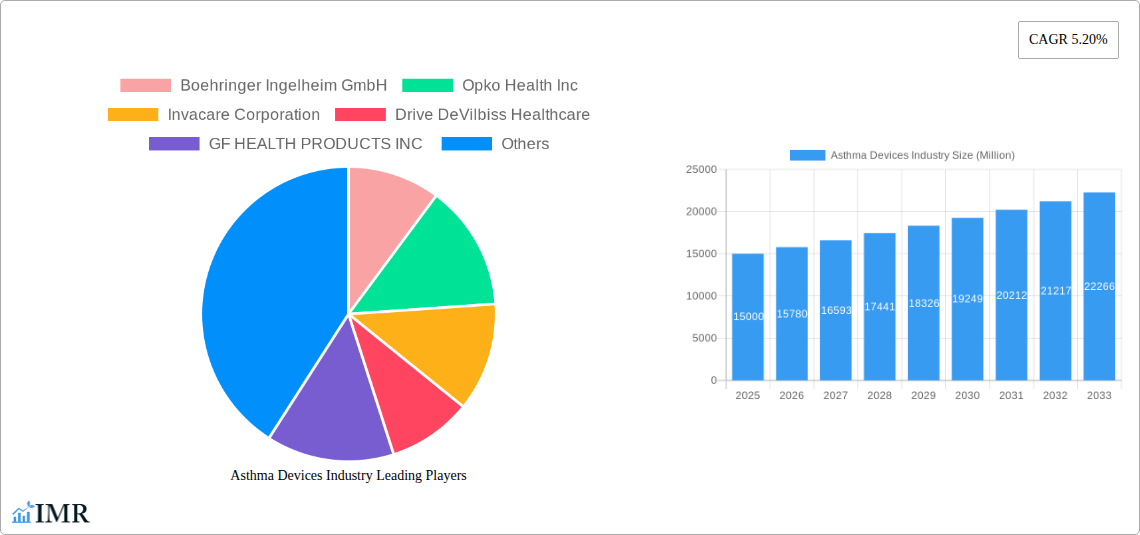
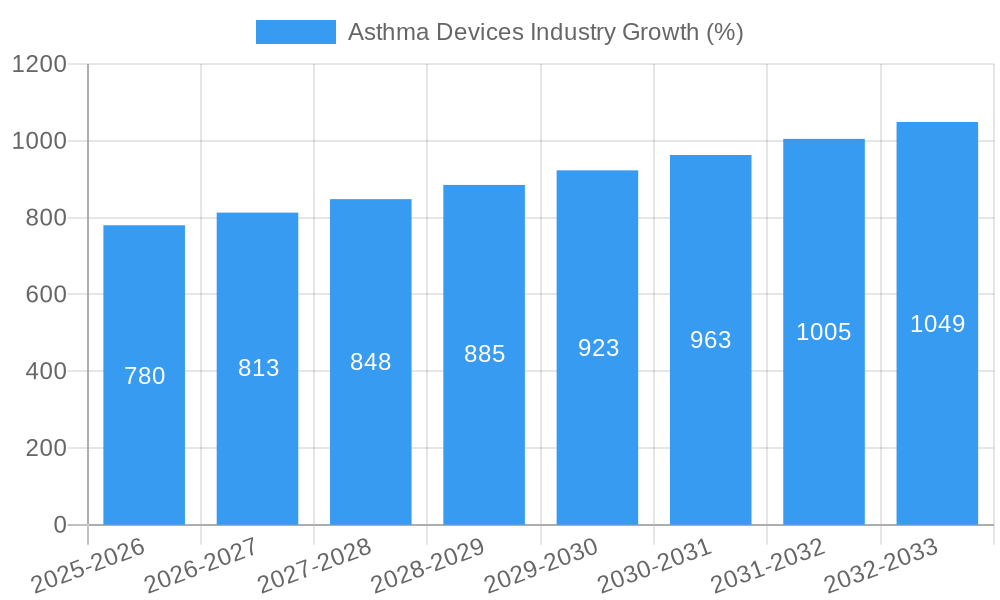
The global asthma devices market, valued at approximately $15 billion in 2025, is projected to experience robust growth, driven by increasing asthma prevalence, particularly in developing nations, and the rising demand for convenient and effective treatment options. The market's Compound Annual Growth Rate (CAGR) of 5.20% from 2025 to 2033 reflects a steady expansion fueled by several factors. Technological advancements, such as the development of smart inhalers with improved drug delivery and adherence monitoring, are contributing significantly to market growth. Furthermore, the aging global population, increased awareness of asthma management, and better access to healthcare in emerging economies are all positively impacting market expansion. However, the market faces certain restraints, including the high cost of advanced devices, potential side effects associated with certain inhalers, and the prevalence of generic drug competition.
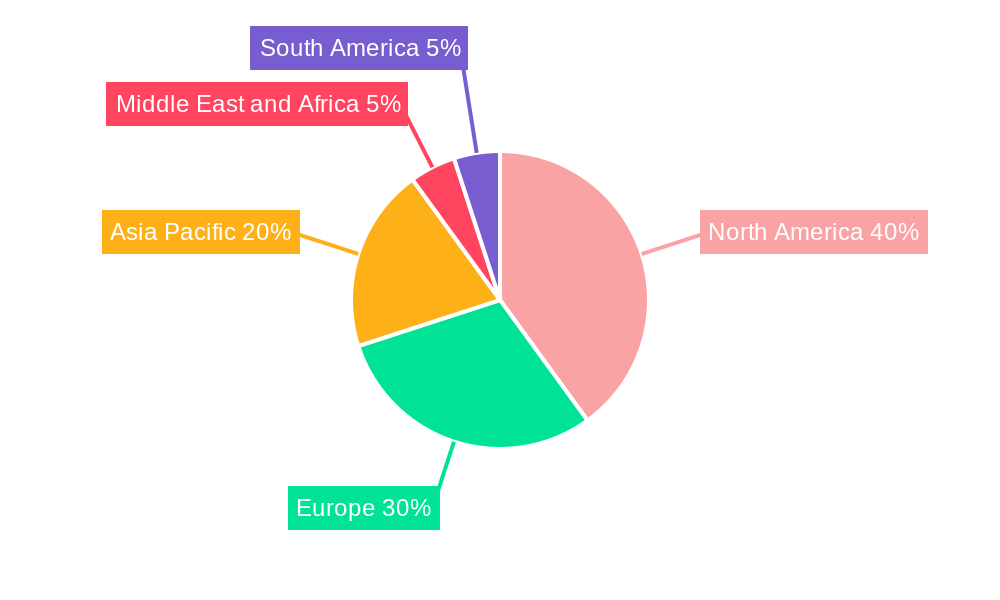
The market is segmented by product type (inhalers – including soft mist inhalers – and nebulizers) and indication (primarily asthma and chronic obstructive pulmonary disease or COPD). Inhalers currently dominate the market due to their portability and ease of use, but the soft mist inhaler segment is experiencing rapid growth due to improved drug delivery and reduced side effects. Geographically, North America and Europe currently hold significant market shares due to high healthcare expenditure and advanced healthcare infrastructure. However, the Asia Pacific region is projected to witness the fastest growth rate in the forecast period, driven by rising asthma prevalence and increasing disposable incomes. Key players in the market, including Boehringer Ingelheim, AstraZeneca, GlaxoSmithKline, and Philips Healthcare, are focused on developing innovative devices, expanding their product portfolios, and strengthening their market presence through strategic partnerships and acquisitions. The competitive landscape is dynamic, characterized by both established players and emerging companies striving to meet the growing demand for advanced asthma management solutions.
Asthma Devices Industry: Market Report 2019-2033
This comprehensive report provides a detailed analysis of the Asthma Devices Industry, encompassing market dynamics, growth trends, regional performance, product landscape, and key player activities from 2019 to 2033. We delve into the parent market of respiratory devices and the child market of asthma-specific devices, offering invaluable insights for industry professionals, investors, and stakeholders. The report utilizes data from 2019-2024 as the historical period, 2025 as the base and estimated year, and projects the market outlook from 2025-2033. Market values are presented in million units.
Asthma Devices Industry Market Dynamics & Structure
The Asthma Devices market is characterized by moderate concentration, with a few major players holding significant market share, but also room for smaller, specialized companies. Technological innovation, particularly in smart inhalers and digital therapeutics, is a key driver, alongside regulatory changes impacting device approvals and reimbursement. Competitive substitutes include alternative therapies like biologics and oral medications. The end-user demographic is primarily comprised of individuals with asthma and COPD, with varying needs across age groups and disease severity. M&A activity in the sector has been relatively consistent, with larger companies acquiring smaller innovative firms to expand their product portfolios and technological capabilities.
- Market Concentration: Moderately concentrated, with top 5 players holding approximately xx% market share (2024).
- Technological Innovation: Focus on smart inhalers, digital therapeutics, and improved drug delivery systems.
- Regulatory Landscape: Stringent regulatory approvals impacting market entry and innovation.
- Competitive Substitutes: Alternative therapies pose competitive pressure.
- M&A Activity: Consistent M&A activity, with xx deals recorded between 2019-2024.
- Innovation Barriers: High R&D costs, stringent regulatory pathways, and intellectual property challenges.
Asthma Devices Industry Growth Trends & Insights
The Asthma Devices market experienced steady growth during the historical period (2019-2024), driven by increasing prevalence of asthma and COPD, growing awareness, and improved access to healthcare. Technological advancements, such as the introduction of smart inhalers and digital health solutions, are accelerating adoption rates. Consumer behavior is shifting towards greater preference for convenient, user-friendly devices, personalized medicine, and remote monitoring capabilities. We project a Compound Annual Growth Rate (CAGR) of xx% during the forecast period (2025-2033), driven by factors such as increasing prevalence of respiratory diseases, technological innovation, and improved healthcare infrastructure. The market penetration is anticipated to reach xx% by 2033.
Dominant Regions, Countries, or Segments in Asthma Devices Industry
North America and Europe currently dominate the Asthma Devices market, driven by high prevalence rates of respiratory diseases, robust healthcare infrastructure, and higher disposable incomes. Within the product segments, inhalers (including soft mist inhalers) hold the largest market share, followed by nebulizers. Asthma remains the dominant indication, although COPD is a significant and growing segment. Asia-Pacific is expected to exhibit the highest growth rate during the forecast period, due to rising prevalence of respiratory diseases, increasing healthcare expenditure, and growing adoption of advanced technologies.
- Key Drivers (North America & Europe): High disease prevalence, strong healthcare infrastructure, high per capita income, favorable reimbursement policies.
- Key Drivers (Asia-Pacific): Rapidly increasing prevalence of respiratory diseases, rising healthcare spending, expanding middle class, technological advancements.
- Market Share: North America (xx%), Europe (xx%), Asia-Pacific (xx%) (2024).
- Growth Potential: Asia-Pacific shows highest growth potential (xx% CAGR).
Asthma Devices Industry Product Landscape
The Asthma Devices market offers a diverse range of products, including traditional inhalers (metered-dose inhalers (MDIs), dry powder inhalers (DPIs)), soft mist inhalers (SMIs), and nebulizers. Recent innovations focus on improved drug delivery, enhanced usability, and smart features for data monitoring and personalized therapy. Key product differentiators include portability, ease of use, and efficacy. Technological advancements such as integrated sensors, connectivity features, and AI-powered algorithms are transforming the landscape, leading to the emergence of smart inhalers and digital therapeutics.
Key Drivers, Barriers & Challenges in Asthma Devices Industry
Key Drivers: Increasing prevalence of asthma and COPD, technological advancements (smart inhalers, digital therapeutics), rising healthcare expenditure, favorable regulatory environment in certain regions.
Challenges: High R&D costs, stringent regulatory approvals, competition from alternative therapies, pricing pressures, supply chain disruptions (impacting manufacturing and distribution). The impact of supply chain disruptions on the market size is estimated at xx million units annually (2024).
Emerging Opportunities in Asthma Devices Industry
Emerging opportunities lie in the development of personalized medicine approaches, targeted therapies, improved device designs for specific patient populations (e.g., children, elderly), expansion into underserved markets, integration of digital health platforms for remote patient monitoring and management, and the development of innovative drug delivery systems.
Growth Accelerators in the Asthma Devices Industry
Long-term growth will be fueled by continued technological innovation, strategic partnerships between device manufacturers and pharmaceutical companies, expansion into emerging markets, and the increasing integration of digital health technologies into respiratory care. Government initiatives supporting early disease detection and management will also contribute to market growth.
Key Players Shaping the Asthma Devices Industry Market
- Boehringer Ingelheim GmbH
- Opko Health Inc
- Invacare Corporation
- Drive DeVilbiss Healthcare
- GF HEALTH PRODUCTS INC
- Merck & Company
- Philips Healthcare
- Teva Pharmaceutical Industries Ltd
- AstraZeneca Plc
- Glaxosmithcline PLC
- PARI Pharma
- Recipharm AB
- GF Health Products
- Omron Healthcare
Notable Milestones in Asthma Devices Industry Sector
- May 2022: Alkem launches "Innohaler" for asthma and COPD patients.
- January 2022: Life Wellness Healthcare expands online sales of AirPhysio device for COPD treatment in the US.
In-Depth Asthma Devices Industry Market Outlook
The Asthma Devices market is poised for sustained growth driven by technological advancements, an aging population with higher prevalence of respiratory diseases, and increased healthcare spending globally. Strategic partnerships, expansion into emerging markets, and the development of innovative and personalized therapies present significant opportunities for companies in the sector. The market's future trajectory will be influenced by factors such as regulatory changes, pricing pressures, and the emergence of disruptive technologies.
Asthma Devices Industry Segmentation
-
1. Product
-
1.1. Inhaler
- 1.1.1. Metered Dose Inhalers
- 1.1.2. Dry Powder Inhalers
- 1.1.3. Soft Mist Inhalers
-
1.2. Nebulizer
- 1.2.1. Compressor Nebulizer
- 1.2.2. Ultrasonic Nebulizer
- 1.2.3. Mesh Nebulizer
-
1.1. Inhaler
-
2. Indication
- 2.1. Asthma
- 2.2. Chronic Obstructive Pulmonary Disease
Asthma Devices Industry Segmentation By Geography
-
1. North America
- 1.1. United States
- 1.2. Canada
- 1.3. Mexico
-
2. Europe
- 2.1. Germany
- 2.2. United Kingdom
- 2.3. France
- 2.4. Italy
- 2.5. Spain
- 2.6. Rest of Europe
-
3. Asia Pacific
- 3.1. China
- 3.2. Japan
- 3.3. India
- 3.4. Australia
- 3.5. South Korea
- 3.6. Rest of Asia Pacific
-
4. Middle East and Africa
- 4.1. GCC
- 4.2. South Africa
- 4.3. Rest of Middle East and Africa
-
5. South America
- 5.1. Brazil
- 5.2. Argentina
- 5.3. Rest of South America
Asthma Devices Industry REPORT HIGHLIGHTS
| Aspects | Details |
|---|---|
| Study Period | 2019-2033 |
| Base Year | 2024 |
| Estimated Year | 2025 |
| Forecast Period | 2025-2033 |
| Historical Period | 2019-2024 |
| Growth Rate | CAGR of 5.20% from 2019-2033 |
| Segmentation |
|
Table of Contents
- 1. Introduction
- 1.1. Research Scope
- 1.2. Market Segmentation
- 1.3. Research Methodology
- 1.4. Definitions and Assumptions
- 2. Executive Summary
- 2.1. Introduction
- 3. Market Dynamics
- 3.1. Introduction
- 3.2. Market Drivers
- 3.2.1. Increase in Incidence and Prevalence of Asthma and COPD; Technological Advancements; Growing Geriatric Population
- 3.3. Market Restrains
- 3.3.1. Stringent Government Regulations for the Product Approval; Inadequate Reimbursement Policies
- 3.4. Market Trends
- 3.4.1. The Asthma Segment is Expected to Hold a Major Market Share in the Asthma and COPD Devices Market
- 4. Market Factor Analysis
- 4.1. Porters Five Forces
- 4.2. Supply/Value Chain
- 4.3. PESTEL analysis
- 4.4. Market Entropy
- 4.5. Patent/Trademark Analysis
- 5. Global Asthma Devices Industry Analysis, Insights and Forecast, 2019-2031
- 5.1. Market Analysis, Insights and Forecast - by Product
- 5.1.1. Inhaler
- 5.1.1.1. Metered Dose Inhalers
- 5.1.1.2. Dry Powder Inhalers
- 5.1.1.3. Soft Mist Inhalers
- 5.1.2. Nebulizer
- 5.1.2.1. Compressor Nebulizer
- 5.1.2.2. Ultrasonic Nebulizer
- 5.1.2.3. Mesh Nebulizer
- 5.1.1. Inhaler
- 5.2. Market Analysis, Insights and Forecast - by Indication
- 5.2.1. Asthma
- 5.2.2. Chronic Obstructive Pulmonary Disease
- 5.3. Market Analysis, Insights and Forecast - by Region
- 5.3.1. North America
- 5.3.2. Europe
- 5.3.3. Asia Pacific
- 5.3.4. Middle East and Africa
- 5.3.5. South America
- 5.1. Market Analysis, Insights and Forecast - by Product
- 6. North America Asthma Devices Industry Analysis, Insights and Forecast, 2019-2031
- 6.1. Market Analysis, Insights and Forecast - by Product
- 6.1.1. Inhaler
- 6.1.1.1. Metered Dose Inhalers
- 6.1.1.2. Dry Powder Inhalers
- 6.1.1.3. Soft Mist Inhalers
- 6.1.2. Nebulizer
- 6.1.2.1. Compressor Nebulizer
- 6.1.2.2. Ultrasonic Nebulizer
- 6.1.2.3. Mesh Nebulizer
- 6.1.1. Inhaler
- 6.2. Market Analysis, Insights and Forecast - by Indication
- 6.2.1. Asthma
- 6.2.2. Chronic Obstructive Pulmonary Disease
- 6.1. Market Analysis, Insights and Forecast - by Product
- 7. Europe Asthma Devices Industry Analysis, Insights and Forecast, 2019-2031
- 7.1. Market Analysis, Insights and Forecast - by Product
- 7.1.1. Inhaler
- 7.1.1.1. Metered Dose Inhalers
- 7.1.1.2. Dry Powder Inhalers
- 7.1.1.3. Soft Mist Inhalers
- 7.1.2. Nebulizer
- 7.1.2.1. Compressor Nebulizer
- 7.1.2.2. Ultrasonic Nebulizer
- 7.1.2.3. Mesh Nebulizer
- 7.1.1. Inhaler
- 7.2. Market Analysis, Insights and Forecast - by Indication
- 7.2.1. Asthma
- 7.2.2. Chronic Obstructive Pulmonary Disease
- 7.1. Market Analysis, Insights and Forecast - by Product
- 8. Asia Pacific Asthma Devices Industry Analysis, Insights and Forecast, 2019-2031
- 8.1. Market Analysis, Insights and Forecast - by Product
- 8.1.1. Inhaler
- 8.1.1.1. Metered Dose Inhalers
- 8.1.1.2. Dry Powder Inhalers
- 8.1.1.3. Soft Mist Inhalers
- 8.1.2. Nebulizer
- 8.1.2.1. Compressor Nebulizer
- 8.1.2.2. Ultrasonic Nebulizer
- 8.1.2.3. Mesh Nebulizer
- 8.1.1. Inhaler
- 8.2. Market Analysis, Insights and Forecast - by Indication
- 8.2.1. Asthma
- 8.2.2. Chronic Obstructive Pulmonary Disease
- 8.1. Market Analysis, Insights and Forecast - by Product
- 9. Middle East and Africa Asthma Devices Industry Analysis, Insights and Forecast, 2019-2031
- 9.1. Market Analysis, Insights and Forecast - by Product
- 9.1.1. Inhaler
- 9.1.1.1. Metered Dose Inhalers
- 9.1.1.2. Dry Powder Inhalers
- 9.1.1.3. Soft Mist Inhalers
- 9.1.2. Nebulizer
- 9.1.2.1. Compressor Nebulizer
- 9.1.2.2. Ultrasonic Nebulizer
- 9.1.2.3. Mesh Nebulizer
- 9.1.1. Inhaler
- 9.2. Market Analysis, Insights and Forecast - by Indication
- 9.2.1. Asthma
- 9.2.2. Chronic Obstructive Pulmonary Disease
- 9.1. Market Analysis, Insights and Forecast - by Product
- 10. South America Asthma Devices Industry Analysis, Insights and Forecast, 2019-2031
- 10.1. Market Analysis, Insights and Forecast - by Product
- 10.1.1. Inhaler
- 10.1.1.1. Metered Dose Inhalers
- 10.1.1.2. Dry Powder Inhalers
- 10.1.1.3. Soft Mist Inhalers
- 10.1.2. Nebulizer
- 10.1.2.1. Compressor Nebulizer
- 10.1.2.2. Ultrasonic Nebulizer
- 10.1.2.3. Mesh Nebulizer
- 10.1.1. Inhaler
- 10.2. Market Analysis, Insights and Forecast - by Indication
- 10.2.1. Asthma
- 10.2.2. Chronic Obstructive Pulmonary Disease
- 10.1. Market Analysis, Insights and Forecast - by Product
- 11. North America Asthma Devices Industry Analysis, Insights and Forecast, 2019-2031
- 11.1. Market Analysis, Insights and Forecast - By Country/Sub-region
- 11.1.1. undefined
- 12. Europe Asthma Devices Industry Analysis, Insights and Forecast, 2019-2031
- 12.1. Market Analysis, Insights and Forecast - By Country/Sub-region
- 12.1.1. undefined
- 13. Asia Pacific Asthma Devices Industry Analysis, Insights and Forecast, 2019-2031
- 13.1. Market Analysis, Insights and Forecast - By Country/Sub-region
- 13.1.1. undefined
- 14. Middle East and Africa Asthma Devices Industry Analysis, Insights and Forecast, 2019-2031
- 14.1. Market Analysis, Insights and Forecast - By Country/Sub-region
- 14.1.1. undefined
- 15. South America Asthma Devices Industry Analysis, Insights and Forecast, 2019-2031
- 15.1. Market Analysis, Insights and Forecast - By Country/Sub-region
- 15.1.1. undefined
- 16. Competitive Analysis
- 16.1. Global Market Share Analysis 2024
- 16.2. Company Profiles
- 16.2.1 Boehringer Ingelheim GmbH
- 16.2.1.1. Overview
- 16.2.1.2. Products
- 16.2.1.3. SWOT Analysis
- 16.2.1.4. Recent Developments
- 16.2.1.5. Financials (Based on Availability)
- 16.2.2 Opko Health Inc
- 16.2.2.1. Overview
- 16.2.2.2. Products
- 16.2.2.3. SWOT Analysis
- 16.2.2.4. Recent Developments
- 16.2.2.5. Financials (Based on Availability)
- 16.2.3 Invacare Corporation
- 16.2.3.1. Overview
- 16.2.3.2. Products
- 16.2.3.3. SWOT Analysis
- 16.2.3.4. Recent Developments
- 16.2.3.5. Financials (Based on Availability)
- 16.2.4 Drive DeVilbiss Healthcare
- 16.2.4.1. Overview
- 16.2.4.2. Products
- 16.2.4.3. SWOT Analysis
- 16.2.4.4. Recent Developments
- 16.2.4.5. Financials (Based on Availability)
- 16.2.5 GF HEALTH PRODUCTS INC
- 16.2.5.1. Overview
- 16.2.5.2. Products
- 16.2.5.3. SWOT Analysis
- 16.2.5.4. Recent Developments
- 16.2.5.5. Financials (Based on Availability)
- 16.2.6 Merck & Company
- 16.2.6.1. Overview
- 16.2.6.2. Products
- 16.2.6.3. SWOT Analysis
- 16.2.6.4. Recent Developments
- 16.2.6.5. Financials (Based on Availability)
- 16.2.7 Philips Healthcare
- 16.2.7.1. Overview
- 16.2.7.2. Products
- 16.2.7.3. SWOT Analysis
- 16.2.7.4. Recent Developments
- 16.2.7.5. Financials (Based on Availability)
- 16.2.8 Teva Pharmaceutical Industries Ltd
- 16.2.8.1. Overview
- 16.2.8.2. Products
- 16.2.8.3. SWOT Analysis
- 16.2.8.4. Recent Developments
- 16.2.8.5. Financials (Based on Availability)
- 16.2.9 AstraZeneca Plc
- 16.2.9.1. Overview
- 16.2.9.2. Products
- 16.2.9.3. SWOT Analysis
- 16.2.9.4. Recent Developments
- 16.2.9.5. Financials (Based on Availability)
- 16.2.10 Glaxosmithcline PLC
- 16.2.10.1. Overview
- 16.2.10.2. Products
- 16.2.10.3. SWOT Analysis
- 16.2.10.4. Recent Developments
- 16.2.10.5. Financials (Based on Availability)
- 16.2.11 PARI Pharma
- 16.2.11.1. Overview
- 16.2.11.2. Products
- 16.2.11.3. SWOT Analysis
- 16.2.11.4. Recent Developments
- 16.2.11.5. Financials (Based on Availability)
- 16.2.12 Recipharm AB
- 16.2.12.1. Overview
- 16.2.12.2. Products
- 16.2.12.3. SWOT Analysis
- 16.2.12.4. Recent Developments
- 16.2.12.5. Financials (Based on Availability)
- 16.2.13 GF Health Products
- 16.2.13.1. Overview
- 16.2.13.2. Products
- 16.2.13.3. SWOT Analysis
- 16.2.13.4. Recent Developments
- 16.2.13.5. Financials (Based on Availability)
- 16.2.14 Omron Healthcare
- 16.2.14.1. Overview
- 16.2.14.2. Products
- 16.2.14.3. SWOT Analysis
- 16.2.14.4. Recent Developments
- 16.2.14.5. Financials (Based on Availability)
- 16.2.1 Boehringer Ingelheim GmbH
List of Figures
- Figure 1: Global Asthma Devices Industry Revenue Breakdown (Million, %) by Region 2024 & 2032
- Figure 2: Global Asthma Devices Industry Volume Breakdown (K Unit, %) by Region 2024 & 2032
- Figure 3: North America Asthma Devices Industry Revenue (Million), by Country 2024 & 2032
- Figure 4: North America Asthma Devices Industry Volume (K Unit), by Country 2024 & 2032
- Figure 5: North America Asthma Devices Industry Revenue Share (%), by Country 2024 & 2032
- Figure 6: North America Asthma Devices Industry Volume Share (%), by Country 2024 & 2032
- Figure 7: Europe Asthma Devices Industry Revenue (Million), by Country 2024 & 2032
- Figure 8: Europe Asthma Devices Industry Volume (K Unit), by Country 2024 & 2032
- Figure 9: Europe Asthma Devices Industry Revenue Share (%), by Country 2024 & 2032
- Figure 10: Europe Asthma Devices Industry Volume Share (%), by Country 2024 & 2032
- Figure 11: Asia Pacific Asthma Devices Industry Revenue (Million), by Country 2024 & 2032
- Figure 12: Asia Pacific Asthma Devices Industry Volume (K Unit), by Country 2024 & 2032
- Figure 13: Asia Pacific Asthma Devices Industry Revenue Share (%), by Country 2024 & 2032
- Figure 14: Asia Pacific Asthma Devices Industry Volume Share (%), by Country 2024 & 2032
- Figure 15: Middle East and Africa Asthma Devices Industry Revenue (Million), by Country 2024 & 2032
- Figure 16: Middle East and Africa Asthma Devices Industry Volume (K Unit), by Country 2024 & 2032
- Figure 17: Middle East and Africa Asthma Devices Industry Revenue Share (%), by Country 2024 & 2032
- Figure 18: Middle East and Africa Asthma Devices Industry Volume Share (%), by Country 2024 & 2032
- Figure 19: South America Asthma Devices Industry Revenue (Million), by Country 2024 & 2032
- Figure 20: South America Asthma Devices Industry Volume (K Unit), by Country 2024 & 2032
- Figure 21: South America Asthma Devices Industry Revenue Share (%), by Country 2024 & 2032
- Figure 22: South America Asthma Devices Industry Volume Share (%), by Country 2024 & 2032
- Figure 23: North America Asthma Devices Industry Revenue (Million), by Product 2024 & 2032
- Figure 24: North America Asthma Devices Industry Volume (K Unit), by Product 2024 & 2032
- Figure 25: North America Asthma Devices Industry Revenue Share (%), by Product 2024 & 2032
- Figure 26: North America Asthma Devices Industry Volume Share (%), by Product 2024 & 2032
- Figure 27: North America Asthma Devices Industry Revenue (Million), by Indication 2024 & 2032
- Figure 28: North America Asthma Devices Industry Volume (K Unit), by Indication 2024 & 2032
- Figure 29: North America Asthma Devices Industry Revenue Share (%), by Indication 2024 & 2032
- Figure 30: North America Asthma Devices Industry Volume Share (%), by Indication 2024 & 2032
- Figure 31: North America Asthma Devices Industry Revenue (Million), by Country 2024 & 2032
- Figure 32: North America Asthma Devices Industry Volume (K Unit), by Country 2024 & 2032
- Figure 33: North America Asthma Devices Industry Revenue Share (%), by Country 2024 & 2032
- Figure 34: North America Asthma Devices Industry Volume Share (%), by Country 2024 & 2032
- Figure 35: Europe Asthma Devices Industry Revenue (Million), by Product 2024 & 2032
- Figure 36: Europe Asthma Devices Industry Volume (K Unit), by Product 2024 & 2032
- Figure 37: Europe Asthma Devices Industry Revenue Share (%), by Product 2024 & 2032
- Figure 38: Europe Asthma Devices Industry Volume Share (%), by Product 2024 & 2032
- Figure 39: Europe Asthma Devices Industry Revenue (Million), by Indication 2024 & 2032
- Figure 40: Europe Asthma Devices Industry Volume (K Unit), by Indication 2024 & 2032
- Figure 41: Europe Asthma Devices Industry Revenue Share (%), by Indication 2024 & 2032
- Figure 42: Europe Asthma Devices Industry Volume Share (%), by Indication 2024 & 2032
- Figure 43: Europe Asthma Devices Industry Revenue (Million), by Country 2024 & 2032
- Figure 44: Europe Asthma Devices Industry Volume (K Unit), by Country 2024 & 2032
- Figure 45: Europe Asthma Devices Industry Revenue Share (%), by Country 2024 & 2032
- Figure 46: Europe Asthma Devices Industry Volume Share (%), by Country 2024 & 2032
- Figure 47: Asia Pacific Asthma Devices Industry Revenue (Million), by Product 2024 & 2032
- Figure 48: Asia Pacific Asthma Devices Industry Volume (K Unit), by Product 2024 & 2032
- Figure 49: Asia Pacific Asthma Devices Industry Revenue Share (%), by Product 2024 & 2032
- Figure 50: Asia Pacific Asthma Devices Industry Volume Share (%), by Product 2024 & 2032
- Figure 51: Asia Pacific Asthma Devices Industry Revenue (Million), by Indication 2024 & 2032
- Figure 52: Asia Pacific Asthma Devices Industry Volume (K Unit), by Indication 2024 & 2032
- Figure 53: Asia Pacific Asthma Devices Industry Revenue Share (%), by Indication 2024 & 2032
- Figure 54: Asia Pacific Asthma Devices Industry Volume Share (%), by Indication 2024 & 2032
- Figure 55: Asia Pacific Asthma Devices Industry Revenue (Million), by Country 2024 & 2032
- Figure 56: Asia Pacific Asthma Devices Industry Volume (K Unit), by Country 2024 & 2032
- Figure 57: Asia Pacific Asthma Devices Industry Revenue Share (%), by Country 2024 & 2032
- Figure 58: Asia Pacific Asthma Devices Industry Volume Share (%), by Country 2024 & 2032
- Figure 59: Middle East and Africa Asthma Devices Industry Revenue (Million), by Product 2024 & 2032
- Figure 60: Middle East and Africa Asthma Devices Industry Volume (K Unit), by Product 2024 & 2032
- Figure 61: Middle East and Africa Asthma Devices Industry Revenue Share (%), by Product 2024 & 2032
- Figure 62: Middle East and Africa Asthma Devices Industry Volume Share (%), by Product 2024 & 2032
- Figure 63: Middle East and Africa Asthma Devices Industry Revenue (Million), by Indication 2024 & 2032
- Figure 64: Middle East and Africa Asthma Devices Industry Volume (K Unit), by Indication 2024 & 2032
- Figure 65: Middle East and Africa Asthma Devices Industry Revenue Share (%), by Indication 2024 & 2032
- Figure 66: Middle East and Africa Asthma Devices Industry Volume Share (%), by Indication 2024 & 2032
- Figure 67: Middle East and Africa Asthma Devices Industry Revenue (Million), by Country 2024 & 2032
- Figure 68: Middle East and Africa Asthma Devices Industry Volume (K Unit), by Country 2024 & 2032
- Figure 69: Middle East and Africa Asthma Devices Industry Revenue Share (%), by Country 2024 & 2032
- Figure 70: Middle East and Africa Asthma Devices Industry Volume Share (%), by Country 2024 & 2032
- Figure 71: South America Asthma Devices Industry Revenue (Million), by Product 2024 & 2032
- Figure 72: South America Asthma Devices Industry Volume (K Unit), by Product 2024 & 2032
- Figure 73: South America Asthma Devices Industry Revenue Share (%), by Product 2024 & 2032
- Figure 74: South America Asthma Devices Industry Volume Share (%), by Product 2024 & 2032
- Figure 75: South America Asthma Devices Industry Revenue (Million), by Indication 2024 & 2032
- Figure 76: South America Asthma Devices Industry Volume (K Unit), by Indication 2024 & 2032
- Figure 77: South America Asthma Devices Industry Revenue Share (%), by Indication 2024 & 2032
- Figure 78: South America Asthma Devices Industry Volume Share (%), by Indication 2024 & 2032
- Figure 79: South America Asthma Devices Industry Revenue (Million), by Country 2024 & 2032
- Figure 80: South America Asthma Devices Industry Volume (K Unit), by Country 2024 & 2032
- Figure 81: South America Asthma Devices Industry Revenue Share (%), by Country 2024 & 2032
- Figure 82: South America Asthma Devices Industry Volume Share (%), by Country 2024 & 2032
List of Tables
- Table 1: Global Asthma Devices Industry Revenue Million Forecast, by Region 2019 & 2032
- Table 2: Global Asthma Devices Industry Volume K Unit Forecast, by Region 2019 & 2032
- Table 3: Global Asthma Devices Industry Revenue Million Forecast, by Product 2019 & 2032
- Table 4: Global Asthma Devices Industry Volume K Unit Forecast, by Product 2019 & 2032
- Table 5: Global Asthma Devices Industry Revenue Million Forecast, by Indication 2019 & 2032
- Table 6: Global Asthma Devices Industry Volume K Unit Forecast, by Indication 2019 & 2032
- Table 7: Global Asthma Devices Industry Revenue Million Forecast, by Region 2019 & 2032
- Table 8: Global Asthma Devices Industry Volume K Unit Forecast, by Region 2019 & 2032
- Table 9: Global Asthma Devices Industry Revenue Million Forecast, by Country 2019 & 2032
- Table 10: Global Asthma Devices Industry Volume K Unit Forecast, by Country 2019 & 2032
- Table 11: Global Asthma Devices Industry Revenue Million Forecast, by Country 2019 & 2032
- Table 12: Global Asthma Devices Industry Volume K Unit Forecast, by Country 2019 & 2032
- Table 13: Global Asthma Devices Industry Revenue Million Forecast, by Country 2019 & 2032
- Table 14: Global Asthma Devices Industry Volume K Unit Forecast, by Country 2019 & 2032
- Table 15: Global Asthma Devices Industry Revenue Million Forecast, by Country 2019 & 2032
- Table 16: Global Asthma Devices Industry Volume K Unit Forecast, by Country 2019 & 2032
- Table 17: Global Asthma Devices Industry Revenue Million Forecast, by Country 2019 & 2032
- Table 18: Global Asthma Devices Industry Volume K Unit Forecast, by Country 2019 & 2032
- Table 19: Global Asthma Devices Industry Revenue Million Forecast, by Product 2019 & 2032
- Table 20: Global Asthma Devices Industry Volume K Unit Forecast, by Product 2019 & 2032
- Table 21: Global Asthma Devices Industry Revenue Million Forecast, by Indication 2019 & 2032
- Table 22: Global Asthma Devices Industry Volume K Unit Forecast, by Indication 2019 & 2032
- Table 23: Global Asthma Devices Industry Revenue Million Forecast, by Country 2019 & 2032
- Table 24: Global Asthma Devices Industry Volume K Unit Forecast, by Country 2019 & 2032
- Table 25: United States Asthma Devices Industry Revenue (Million) Forecast, by Application 2019 & 2032
- Table 26: United States Asthma Devices Industry Volume (K Unit) Forecast, by Application 2019 & 2032
- Table 27: Canada Asthma Devices Industry Revenue (Million) Forecast, by Application 2019 & 2032
- Table 28: Canada Asthma Devices Industry Volume (K Unit) Forecast, by Application 2019 & 2032
- Table 29: Mexico Asthma Devices Industry Revenue (Million) Forecast, by Application 2019 & 2032
- Table 30: Mexico Asthma Devices Industry Volume (K Unit) Forecast, by Application 2019 & 2032
- Table 31: Global Asthma Devices Industry Revenue Million Forecast, by Product 2019 & 2032
- Table 32: Global Asthma Devices Industry Volume K Unit Forecast, by Product 2019 & 2032
- Table 33: Global Asthma Devices Industry Revenue Million Forecast, by Indication 2019 & 2032
- Table 34: Global Asthma Devices Industry Volume K Unit Forecast, by Indication 2019 & 2032
- Table 35: Global Asthma Devices Industry Revenue Million Forecast, by Country 2019 & 2032
- Table 36: Global Asthma Devices Industry Volume K Unit Forecast, by Country 2019 & 2032
- Table 37: Germany Asthma Devices Industry Revenue (Million) Forecast, by Application 2019 & 2032
- Table 38: Germany Asthma Devices Industry Volume (K Unit) Forecast, by Application 2019 & 2032
- Table 39: United Kingdom Asthma Devices Industry Revenue (Million) Forecast, by Application 2019 & 2032
- Table 40: United Kingdom Asthma Devices Industry Volume (K Unit) Forecast, by Application 2019 & 2032
- Table 41: France Asthma Devices Industry Revenue (Million) Forecast, by Application 2019 & 2032
- Table 42: France Asthma Devices Industry Volume (K Unit) Forecast, by Application 2019 & 2032
- Table 43: Italy Asthma Devices Industry Revenue (Million) Forecast, by Application 2019 & 2032
- Table 44: Italy Asthma Devices Industry Volume (K Unit) Forecast, by Application 2019 & 2032
- Table 45: Spain Asthma Devices Industry Revenue (Million) Forecast, by Application 2019 & 2032
- Table 46: Spain Asthma Devices Industry Volume (K Unit) Forecast, by Application 2019 & 2032
- Table 47: Rest of Europe Asthma Devices Industry Revenue (Million) Forecast, by Application 2019 & 2032
- Table 48: Rest of Europe Asthma Devices Industry Volume (K Unit) Forecast, by Application 2019 & 2032
- Table 49: Global Asthma Devices Industry Revenue Million Forecast, by Product 2019 & 2032
- Table 50: Global Asthma Devices Industry Volume K Unit Forecast, by Product 2019 & 2032
- Table 51: Global Asthma Devices Industry Revenue Million Forecast, by Indication 2019 & 2032
- Table 52: Global Asthma Devices Industry Volume K Unit Forecast, by Indication 2019 & 2032
- Table 53: Global Asthma Devices Industry Revenue Million Forecast, by Country 2019 & 2032
- Table 54: Global Asthma Devices Industry Volume K Unit Forecast, by Country 2019 & 2032
- Table 55: China Asthma Devices Industry Revenue (Million) Forecast, by Application 2019 & 2032
- Table 56: China Asthma Devices Industry Volume (K Unit) Forecast, by Application 2019 & 2032
- Table 57: Japan Asthma Devices Industry Revenue (Million) Forecast, by Application 2019 & 2032
- Table 58: Japan Asthma Devices Industry Volume (K Unit) Forecast, by Application 2019 & 2032
- Table 59: India Asthma Devices Industry Revenue (Million) Forecast, by Application 2019 & 2032
- Table 60: India Asthma Devices Industry Volume (K Unit) Forecast, by Application 2019 & 2032
- Table 61: Australia Asthma Devices Industry Revenue (Million) Forecast, by Application 2019 & 2032
- Table 62: Australia Asthma Devices Industry Volume (K Unit) Forecast, by Application 2019 & 2032
- Table 63: South Korea Asthma Devices Industry Revenue (Million) Forecast, by Application 2019 & 2032
- Table 64: South Korea Asthma Devices Industry Volume (K Unit) Forecast, by Application 2019 & 2032
- Table 65: Rest of Asia Pacific Asthma Devices Industry Revenue (Million) Forecast, by Application 2019 & 2032
- Table 66: Rest of Asia Pacific Asthma Devices Industry Volume (K Unit) Forecast, by Application 2019 & 2032
- Table 67: Global Asthma Devices Industry Revenue Million Forecast, by Product 2019 & 2032
- Table 68: Global Asthma Devices Industry Volume K Unit Forecast, by Product 2019 & 2032
- Table 69: Global Asthma Devices Industry Revenue Million Forecast, by Indication 2019 & 2032
- Table 70: Global Asthma Devices Industry Volume K Unit Forecast, by Indication 2019 & 2032
- Table 71: Global Asthma Devices Industry Revenue Million Forecast, by Country 2019 & 2032
- Table 72: Global Asthma Devices Industry Volume K Unit Forecast, by Country 2019 & 2032
- Table 73: GCC Asthma Devices Industry Revenue (Million) Forecast, by Application 2019 & 2032
- Table 74: GCC Asthma Devices Industry Volume (K Unit) Forecast, by Application 2019 & 2032
- Table 75: South Africa Asthma Devices Industry Revenue (Million) Forecast, by Application 2019 & 2032
- Table 76: South Africa Asthma Devices Industry Volume (K Unit) Forecast, by Application 2019 & 2032
- Table 77: Rest of Middle East and Africa Asthma Devices Industry Revenue (Million) Forecast, by Application 2019 & 2032
- Table 78: Rest of Middle East and Africa Asthma Devices Industry Volume (K Unit) Forecast, by Application 2019 & 2032
- Table 79: Global Asthma Devices Industry Revenue Million Forecast, by Product 2019 & 2032
- Table 80: Global Asthma Devices Industry Volume K Unit Forecast, by Product 2019 & 2032
- Table 81: Global Asthma Devices Industry Revenue Million Forecast, by Indication 2019 & 2032
- Table 82: Global Asthma Devices Industry Volume K Unit Forecast, by Indication 2019 & 2032
- Table 83: Global Asthma Devices Industry Revenue Million Forecast, by Country 2019 & 2032
- Table 84: Global Asthma Devices Industry Volume K Unit Forecast, by Country 2019 & 2032
- Table 85: Brazil Asthma Devices Industry Revenue (Million) Forecast, by Application 2019 & 2032
- Table 86: Brazil Asthma Devices Industry Volume (K Unit) Forecast, by Application 2019 & 2032
- Table 87: Argentina Asthma Devices Industry Revenue (Million) Forecast, by Application 2019 & 2032
- Table 88: Argentina Asthma Devices Industry Volume (K Unit) Forecast, by Application 2019 & 2032
- Table 89: Rest of South America Asthma Devices Industry Revenue (Million) Forecast, by Application 2019 & 2032
- Table 90: Rest of South America Asthma Devices Industry Volume (K Unit) Forecast, by Application 2019 & 2032
Frequently Asked Questions
1. What is the projected Compound Annual Growth Rate (CAGR) of the Asthma Devices Industry?
The projected CAGR is approximately 5.20%.
2. Which companies are prominent players in the Asthma Devices Industry?
Key companies in the market include Boehringer Ingelheim GmbH, Opko Health Inc, Invacare Corporation, Drive DeVilbiss Healthcare, GF HEALTH PRODUCTS INC , Merck & Company, Philips Healthcare, Teva Pharmaceutical Industries Ltd, AstraZeneca Plc, Glaxosmithcline PLC, PARI Pharma, Recipharm AB, GF Health Products, Omron Healthcare.
3. What are the main segments of the Asthma Devices Industry?
The market segments include Product, Indication.
4. Can you provide details about the market size?
The market size is estimated to be USD XX Million as of 2022.
5. What are some drivers contributing to market growth?
Increase in Incidence and Prevalence of Asthma and COPD; Technological Advancements; Growing Geriatric Population.
6. What are the notable trends driving market growth?
The Asthma Segment is Expected to Hold a Major Market Share in the Asthma and COPD Devices Market.
7. Are there any restraints impacting market growth?
Stringent Government Regulations for the Product Approval; Inadequate Reimbursement Policies.
8. Can you provide examples of recent developments in the market?
In May 2022, Alkem launched its first inhalation device, "Innohaler", for asthma and COPD patients.
9. What pricing options are available for accessing the report?
Pricing options include single-user, multi-user, and enterprise licenses priced at USD 4750, USD 5250, and USD 8750 respectively.
10. Is the market size provided in terms of value or volume?
The market size is provided in terms of value, measured in Million and volume, measured in K Unit.
11. Are there any specific market keywords associated with the report?
Yes, the market keyword associated with the report is "Asthma Devices Industry," which aids in identifying and referencing the specific market segment covered.
12. How do I determine which pricing option suits my needs best?
The pricing options vary based on user requirements and access needs. Individual users may opt for single-user licenses, while businesses requiring broader access may choose multi-user or enterprise licenses for cost-effective access to the report.
13. Are there any additional resources or data provided in the Asthma Devices Industry report?
While the report offers comprehensive insights, it's advisable to review the specific contents or supplementary materials provided to ascertain if additional resources or data are available.
14. How can I stay updated on further developments or reports in the Asthma Devices Industry?
To stay informed about further developments, trends, and reports in the Asthma Devices Industry, consider subscribing to industry newsletters, following relevant companies and organizations, or regularly checking reputable industry news sources and publications.
Methodology
Step 1 - Identification of Relevant Samples Size from Population Database


Step 2 - Approaches for Defining Global Market Size (Value, Volume* & Price*)

Note*: In applicable scenarios
Step 3 - Data Sources
Primary Research
- Web Analytics
- Survey Reports
- Research Institute
- Latest Research Reports
- Opinion Leaders
Secondary Research
- Annual Reports
- White Paper
- Latest Press Release
- Industry Association
- Paid Database
- Investor Presentations

Step 4 - Data Triangulation
Involves using different sources of information in order to increase the validity of a study
These sources are likely to be stakeholders in a program - participants, other researchers, program staff, other community members, and so on.
Then we put all data in single framework & apply various statistical tools to find out the dynamic on the market.
During the analysis stage, feedback from the stakeholder groups would be compared to determine areas of agreement as well as areas of divergence
