

Key Insights
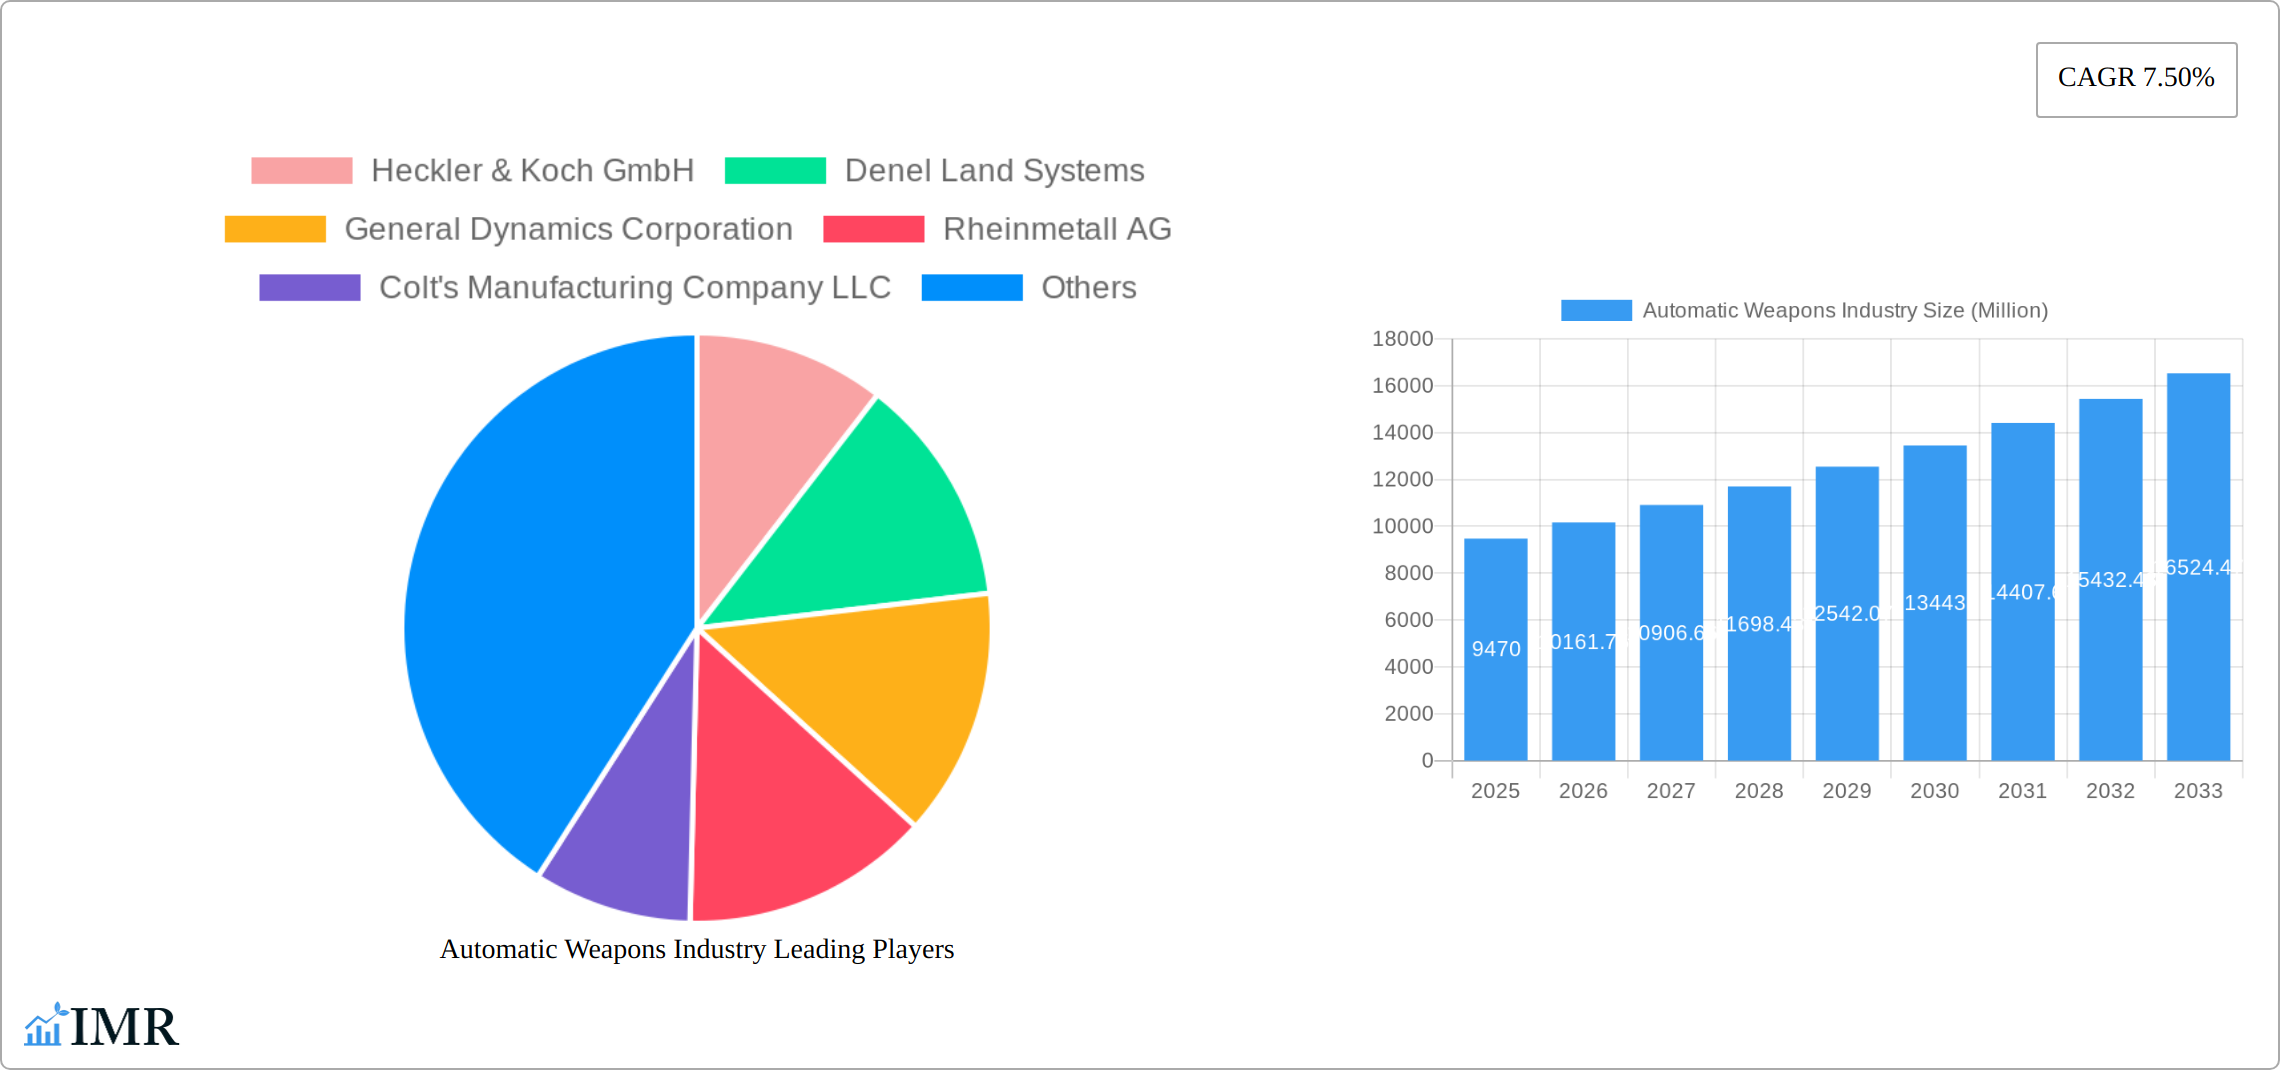
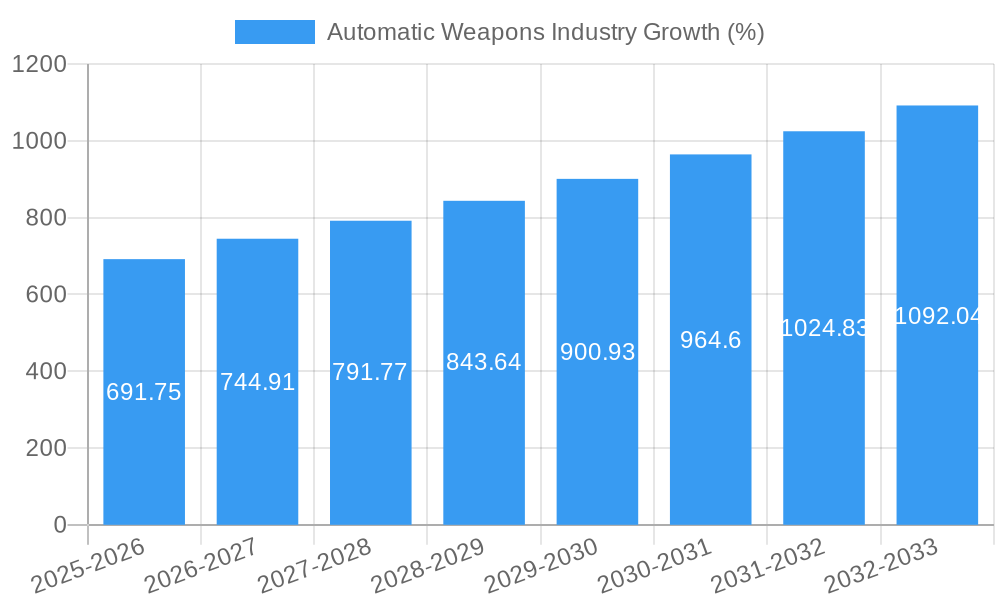
The global automatic weapons market, valued at $9.47 billion in 2025, is projected to experience robust growth, driven by escalating geopolitical tensions, increasing defense budgets worldwide, and the ongoing modernization of armed forces. The market's Compound Annual Growth Rate (CAGR) of 7.50% from 2025 to 2033 indicates a significant expansion, with substantial contributions anticipated from emerging economies in Asia-Pacific and the Middle East. Key growth drivers include the demand for advanced features like improved accuracy, reduced recoil, and enhanced lethality in automatic rifles, machine guns, and other automatic weapon systems. Furthermore, technological advancements leading to lighter, more durable, and adaptable weapons, suitable for various platforms (land, airborne, naval) are fueling market expansion. The increasing adoption of unmanned aerial vehicles (UAVs) and other remotely piloted systems necessitates lightweight and highly accurate automatic weapons for integration, driving further growth in the airborne segment. While potential restraints such as stringent regulations surrounding arms trade and ethical concerns regarding the use of lethal autonomous weapons systems exist, the overall market outlook remains optimistic due to persistent global security challenges and sustained investment in military technology.
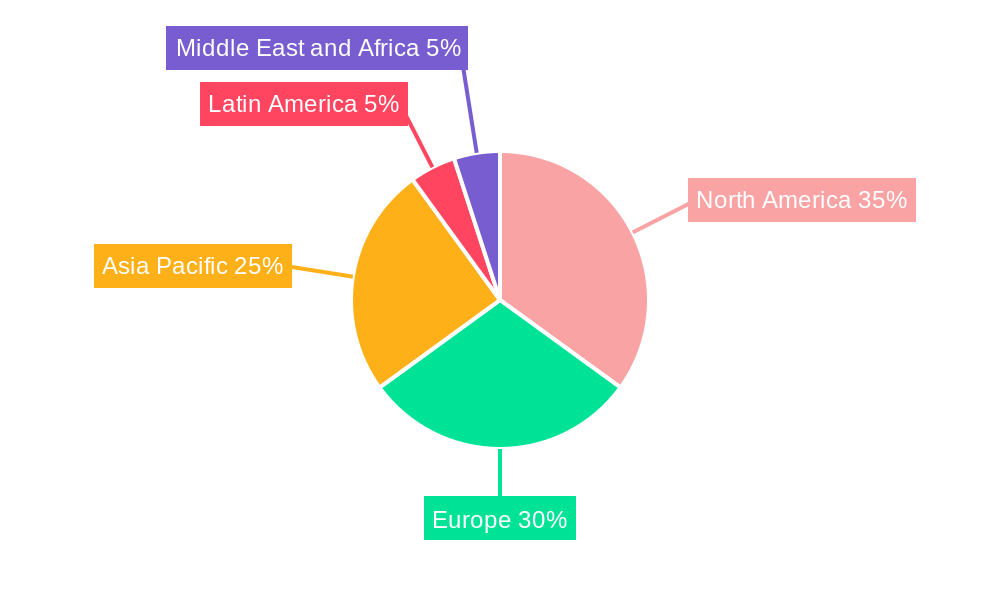
The market segmentation highlights a significant demand across various weapon types, with automatic rifles and machine guns holding the largest shares, driven by their widespread use in military operations and law enforcement. The land platform segment dominates due to conventional warfare requirements, while the airborne and naval segments are witnessing substantial growth fueled by evolving military strategies and technological innovations. Leading companies like Heckler & Koch, General Dynamics, and Rheinmetall, among others, are key players, constantly investing in research and development to maintain their competitive edge and meet evolving market needs. Regional market analysis shows strong performance in North America and Europe, attributed to significant defense spending and technological advancements. However, the Asia-Pacific region is expected to demonstrate rapid expansion during the forecast period, due to rising defense budgets and regional geopolitical dynamics.
Automatic Weapons Industry Market Report: 2019-2033
This comprehensive report provides a detailed analysis of the Automatic Weapons Industry, encompassing market dynamics, growth trends, regional dominance, product landscape, key players, and future outlook. The report covers the period 2019-2033, with a focus on the forecast period 2025-2033 and a base year of 2025. The study segments the market by weapon Type (Automatic Rifle, Machine Gun, Automatic Launchers, Automatic Cannon, Gatling Gun) and Platform (Land, Airborne, Naval), providing granular insights into each segment's performance and future potential. This report is essential for industry professionals, investors, and policymakers seeking a deep understanding of this dynamic market. Market values are presented in million units.
Automatic Weapons Industry Market Dynamics & Structure
The Automatic Weapons Industry is a complex market characterized by high concentration among a few major players, intense competition, and significant regulatory oversight. Market concentration is high, with a few major players controlling a significant share of the global market, while smaller players focus on niche segments or regional markets. Technological innovation is a critical driver, with continuous advancements in materials, design, and manufacturing processes leading to lighter, more accurate, and durable automatic weapons. Stringent regulatory frameworks, varying by country and region, govern the production, sale, and export of automatic weapons. This affects market access, operational costs, and overall market growth. Competitive product substitutes are limited, with the primary alternatives being older generation weapons, or increasingly, non-lethal crowd control devices. End-user demographics are heavily weighted towards government military and law enforcement agencies, with some specific smaller segments catering to civilian markets in regions with more lax regulations. M&A activity is relatively infrequent due to the highly regulated nature of the industry and the long-term nature of the contracts involved.
- Market Concentration: High, with top 5 players holding approximately xx% of market share in 2025.
- Technological Innovation: Significant driver, focusing on lighter weight, improved accuracy, and enhanced durability.
- Regulatory Frameworks: Stringent and vary significantly by region, impacting market access and operations.
- M&A Activity: Relatively low, with xx major deals recorded between 2019-2024.
- Innovation Barriers: High capital expenditure requirements, stringent testing and certification processes, and lengthy approval times.
Automatic Weapons Industry Growth Trends & Insights
The global automatic weapons market experienced consistent growth during the historical period (2019-2024), driven by increased defense spending globally and rising geopolitical instability. The market size is estimated at xx million units in 2025, with a projected Compound Annual Growth Rate (CAGR) of xx% during the forecast period (2025-2033). This growth is expected to be fueled by ongoing modernization efforts by militaries worldwide, demand for improved weapon systems with enhanced capabilities, and emerging markets adopting modern automatic weapons. Technological disruptions, such as the increasing integration of advanced technologies like precision-guided munitions and networked weapon systems, are transforming the industry. However, market fluctuations are likely due to geopolitical factors, budgetary constraints, and evolving defense strategies. Market penetration of advanced weapon systems is relatively low in certain regions which offers opportunity for growth. Consumer behavior is influenced primarily by government procurement policies, technological advancements, and cost considerations. Several key market trends include increased demand for lightweight weapons, higher accuracy, and improved ergonomics.
Dominant Regions, Countries, or Segments in Automatic Weapons Industry
The North American region, particularly the United States, holds a dominant position in the automatic weapons industry, largely driven by the country's significant defense spending and its role as a major exporter of arms. Europe also holds a substantial market share due to the presence of major manufacturers and a strong demand from European Union member states. The Asia-Pacific region is experiencing substantial growth, fueled by increasing defense budgets and modernization efforts by several countries in the region. Within weapon types, Machine Guns consistently represent the largest segment, followed by Automatic Rifles. The Land platform currently dominates the market, but there is notable growth in the Airborne segment, driven by the demand for lightweight and highly reliable weapons for airborne operations.
- Key Drivers (North America): High defense spending, robust domestic manufacturing base, advanced technology, and significant export market.
- Key Drivers (Europe): Presence of established manufacturers, substantial defense budgets of EU member states, and strong export capabilities.
- Key Drivers (Asia-Pacific): Rising defense budgets, modernization of armed forces, and increasing geopolitical tensions.
- Dominant Segments: Machine guns (xx% Market Share), Land Platform (xx% Market Share)
Automatic Weapons Industry Product Landscape
The automatic weapons market is characterized by a wide range of products, from lightweight assault rifles to heavy machine guns and advanced automatic cannons. Product innovations focus on enhancing accuracy, reducing weight, improving ergonomics, and integrating advanced technologies like smart targeting systems. The focus remains on increasing lethality while reducing collateral damage. Key performance metrics include range, accuracy, rate of fire, reliability, and weight. Unique selling propositions vary across manufacturers, with a focus on aspects like specific designs, materials, superior targeting, and ease of maintenance. Advances are being made in ammunition types, with the development of superior projectiles and propellants continuously improving automatic weapons effectiveness.
Key Drivers, Barriers & Challenges in Automatic Weapons Industry
Key Drivers:
- Increased defense spending globally, particularly in regions experiencing geopolitical instability.
- Technological advancements leading to lighter, more accurate, and durable weapons.
- Modernization of armed forces in developing countries.
Challenges & Restraints:
- Stringent regulations and export controls limiting market access. This results in a xx% reduction in potential market revenue.
- Intense competition among established manufacturers.
- Supply chain disruptions impacting production and delivery timelines.
Emerging Opportunities in Automatic Weapons Industry
- Growth in the unmanned aerial vehicle (UAV) market, driving demand for lightweight and adaptable automatic weapons systems.
- Emerging markets in Africa and South America offering opportunities for market expansion.
- Development of advanced materials and manufacturing technologies reducing weapon weight and enhancing durability.
Growth Accelerators in the Automatic Weapons Industry
Long-term growth will be driven by technological advancements such as the integration of artificial intelligence (AI) for enhanced targeting and autonomous systems. Strategic partnerships between manufacturers and defense organizations are also accelerating innovation and streamlining procurement processes. Expansion into emerging markets and the development of niche products for specialized applications will create further growth opportunities.
Key Players Shaping the Automatic Weapons Industry Market
- Heckler & Koch GmbH
- Denel Land Systems
- General Dynamics Corporation
- Rheinmetall AG
- Colt's Manufacturing Company LLC
- UkrOboronProm
- Sig Sauer Inc
- Israel Weapon Industries (IWI) Ltd
- Singapore Technologies Engineering Ltd
- BAE Systems plc
- Northrop Grumman Corporation
- FN HERSTAL (Herstal Group)
Notable Milestones in Automatic Weapons Industry Sector
- March 2023: The Estonian Defense Investment Centre awarded a contract to Israel Weapon Industries (IWI) for the supply of 1,000 NG7 "Negev" light machine guns.
- February 2022: The US Army awarded FN America a USD 49 million contract for M240L medium machine guns.
In-Depth Automatic Weapons Industry Market Outlook
The future of the automatic weapons industry is bright, driven by continuous technological advancements, evolving geopolitical landscapes, and the persistent need for advanced weaponry by global militaries and law enforcement agencies. The market is expected to experience sustained growth, propelled by the increasing adoption of advanced technologies, strategic partnerships, and the expansion into new markets. Strategic investments in research and development, coupled with strategic partnerships, will shape the industry's future trajectory, and offer substantial opportunities for businesses seeking growth and market share.
Automatic Weapons Industry Segmentation
-
1. Type
- 1.1. Automatic Rifle
- 1.2. Machine Gun
- 1.3. Automatic launchers
- 1.4. Automatic Cannon
- 1.5. Gatling Gun
-
2. Platform
- 2.1. Land
- 2.2. Airborne
- 2.3. Naval
Automatic Weapons Industry Segmentation By Geography
-
1. North America
- 1.1. United States
- 1.2. Canada
-
2. Europe
- 2.1. United Kingdom
- 2.2. Germany
- 2.3. France
- 2.4. Russia
- 2.5. Rest of Europe
-
3. Asia Pacific
- 3.1. China
- 3.2. India
- 3.3. Japan
- 3.4. South Korea
- 3.5. Rest of Asia Pacific
-
4. Latin America
- 4.1. Brazil
- 4.2. Rest of Latin America
-
5. Middle East and Africa
- 5.1. United Arab Emirates
- 5.2. Saudi Arabia
- 5.3. South Africa
- 5.4. Rest of Middle East and Africa
Automatic Weapons Industry REPORT HIGHLIGHTS
| Aspects | Details |
|---|---|
| Study Period | 2019-2033 |
| Base Year | 2024 |
| Estimated Year | 2025 |
| Forecast Period | 2025-2033 |
| Historical Period | 2019-2024 |
| Growth Rate | CAGR of 7.50% from 2019-2033 |
| Segmentation |
|
Table of Contents
- 1. Introduction
- 1.1. Research Scope
- 1.2. Market Segmentation
- 1.3. Research Methodology
- 1.4. Definitions and Assumptions
- 2. Executive Summary
- 2.1. Introduction
- 3. Market Dynamics
- 3.1. Introduction
- 3.2. Market Drivers
- 3.3. Market Restrains
- 3.4. Market Trends
- 3.4.1. Land Segment to Witness Highest Growth During the Forecast Period
- 4. Market Factor Analysis
- 4.1. Porters Five Forces
- 4.2. Supply/Value Chain
- 4.3. PESTEL analysis
- 4.4. Market Entropy
- 4.5. Patent/Trademark Analysis
- 5. Global Automatic Weapons Industry Analysis, Insights and Forecast, 2019-2031
- 5.1. Market Analysis, Insights and Forecast - by Type
- 5.1.1. Automatic Rifle
- 5.1.2. Machine Gun
- 5.1.3. Automatic launchers
- 5.1.4. Automatic Cannon
- 5.1.5. Gatling Gun
- 5.2. Market Analysis, Insights and Forecast - by Platform
- 5.2.1. Land
- 5.2.2. Airborne
- 5.2.3. Naval
- 5.3. Market Analysis, Insights and Forecast - by Region
- 5.3.1. North America
- 5.3.2. Europe
- 5.3.3. Asia Pacific
- 5.3.4. Latin America
- 5.3.5. Middle East and Africa
- 5.1. Market Analysis, Insights and Forecast - by Type
- 6. North America Automatic Weapons Industry Analysis, Insights and Forecast, 2019-2031
- 6.1. Market Analysis, Insights and Forecast - by Type
- 6.1.1. Automatic Rifle
- 6.1.2. Machine Gun
- 6.1.3. Automatic launchers
- 6.1.4. Automatic Cannon
- 6.1.5. Gatling Gun
- 6.2. Market Analysis, Insights and Forecast - by Platform
- 6.2.1. Land
- 6.2.2. Airborne
- 6.2.3. Naval
- 6.1. Market Analysis, Insights and Forecast - by Type
- 7. Europe Automatic Weapons Industry Analysis, Insights and Forecast, 2019-2031
- 7.1. Market Analysis, Insights and Forecast - by Type
- 7.1.1. Automatic Rifle
- 7.1.2. Machine Gun
- 7.1.3. Automatic launchers
- 7.1.4. Automatic Cannon
- 7.1.5. Gatling Gun
- 7.2. Market Analysis, Insights and Forecast - by Platform
- 7.2.1. Land
- 7.2.2. Airborne
- 7.2.3. Naval
- 7.1. Market Analysis, Insights and Forecast - by Type
- 8. Asia Pacific Automatic Weapons Industry Analysis, Insights and Forecast, 2019-2031
- 8.1. Market Analysis, Insights and Forecast - by Type
- 8.1.1. Automatic Rifle
- 8.1.2. Machine Gun
- 8.1.3. Automatic launchers
- 8.1.4. Automatic Cannon
- 8.1.5. Gatling Gun
- 8.2. Market Analysis, Insights and Forecast - by Platform
- 8.2.1. Land
- 8.2.2. Airborne
- 8.2.3. Naval
- 8.1. Market Analysis, Insights and Forecast - by Type
- 9. Latin America Automatic Weapons Industry Analysis, Insights and Forecast, 2019-2031
- 9.1. Market Analysis, Insights and Forecast - by Type
- 9.1.1. Automatic Rifle
- 9.1.2. Machine Gun
- 9.1.3. Automatic launchers
- 9.1.4. Automatic Cannon
- 9.1.5. Gatling Gun
- 9.2. Market Analysis, Insights and Forecast - by Platform
- 9.2.1. Land
- 9.2.2. Airborne
- 9.2.3. Naval
- 9.1. Market Analysis, Insights and Forecast - by Type
- 10. Middle East and Africa Automatic Weapons Industry Analysis, Insights and Forecast, 2019-2031
- 10.1. Market Analysis, Insights and Forecast - by Type
- 10.1.1. Automatic Rifle
- 10.1.2. Machine Gun
- 10.1.3. Automatic launchers
- 10.1.4. Automatic Cannon
- 10.1.5. Gatling Gun
- 10.2. Market Analysis, Insights and Forecast - by Platform
- 10.2.1. Land
- 10.2.2. Airborne
- 10.2.3. Naval
- 10.1. Market Analysis, Insights and Forecast - by Type
- 11. North America Automatic Weapons Industry Analysis, Insights and Forecast, 2019-2031
- 11.1. Market Analysis, Insights and Forecast - By Country/Sub-region
- 11.1.1 United States
- 11.1.2 Canada
- 12. Europe Automatic Weapons Industry Analysis, Insights and Forecast, 2019-2031
- 12.1. Market Analysis, Insights and Forecast - By Country/Sub-region
- 12.1.1 United Kingdom
- 12.1.2 Germany
- 12.1.3 France
- 12.1.4 Russia
- 12.1.5 Rest of Europe
- 13. Asia Pacific Automatic Weapons Industry Analysis, Insights and Forecast, 2019-2031
- 13.1. Market Analysis, Insights and Forecast - By Country/Sub-region
- 13.1.1 China
- 13.1.2 India
- 13.1.3 Japan
- 13.1.4 South Korea
- 13.1.5 Rest of Asia Pacific
- 14. Latin America Automatic Weapons Industry Analysis, Insights and Forecast, 2019-2031
- 14.1. Market Analysis, Insights and Forecast - By Country/Sub-region
- 14.1.1 Brazil
- 14.1.2 Rest of Latin America
- 15. Middle East and Africa Automatic Weapons Industry Analysis, Insights and Forecast, 2019-2031
- 15.1. Market Analysis, Insights and Forecast - By Country/Sub-region
- 15.1.1 United Arab Emirates
- 15.1.2 Saudi Arabia
- 15.1.3 South Africa
- 15.1.4 Rest of Middle East and Africa
- 16. Competitive Analysis
- 16.1. Global Market Share Analysis 2024
- 16.2. Company Profiles
- 16.2.1 Heckler & Koch GmbH
- 16.2.1.1. Overview
- 16.2.1.2. Products
- 16.2.1.3. SWOT Analysis
- 16.2.1.4. Recent Developments
- 16.2.1.5. Financials (Based on Availability)
- 16.2.2 Denel Land Systems
- 16.2.2.1. Overview
- 16.2.2.2. Products
- 16.2.2.3. SWOT Analysis
- 16.2.2.4. Recent Developments
- 16.2.2.5. Financials (Based on Availability)
- 16.2.3 General Dynamics Corporation
- 16.2.3.1. Overview
- 16.2.3.2. Products
- 16.2.3.3. SWOT Analysis
- 16.2.3.4. Recent Developments
- 16.2.3.5. Financials (Based on Availability)
- 16.2.4 Rheinmetall AG
- 16.2.4.1. Overview
- 16.2.4.2. Products
- 16.2.4.3. SWOT Analysis
- 16.2.4.4. Recent Developments
- 16.2.4.5. Financials (Based on Availability)
- 16.2.5 Colt's Manufacturing Company LLC
- 16.2.5.1. Overview
- 16.2.5.2. Products
- 16.2.5.3. SWOT Analysis
- 16.2.5.4. Recent Developments
- 16.2.5.5. Financials (Based on Availability)
- 16.2.6 UkrOboronProm
- 16.2.6.1. Overview
- 16.2.6.2. Products
- 16.2.6.3. SWOT Analysis
- 16.2.6.4. Recent Developments
- 16.2.6.5. Financials (Based on Availability)
- 16.2.7 Sig Sauer Inc
- 16.2.7.1. Overview
- 16.2.7.2. Products
- 16.2.7.3. SWOT Analysis
- 16.2.7.4. Recent Developments
- 16.2.7.5. Financials (Based on Availability)
- 16.2.8 Israel Weapon Industries (IWI) Ltd
- 16.2.8.1. Overview
- 16.2.8.2. Products
- 16.2.8.3. SWOT Analysis
- 16.2.8.4. Recent Developments
- 16.2.8.5. Financials (Based on Availability)
- 16.2.9 Singapore Technologies Engineering Ltd
- 16.2.9.1. Overview
- 16.2.9.2. Products
- 16.2.9.3. SWOT Analysis
- 16.2.9.4. Recent Developments
- 16.2.9.5. Financials (Based on Availability)
- 16.2.10 BAE Systems plc
- 16.2.10.1. Overview
- 16.2.10.2. Products
- 16.2.10.3. SWOT Analysis
- 16.2.10.4. Recent Developments
- 16.2.10.5. Financials (Based on Availability)
- 16.2.11 Northrop Grumman Corporation
- 16.2.11.1. Overview
- 16.2.11.2. Products
- 16.2.11.3. SWOT Analysis
- 16.2.11.4. Recent Developments
- 16.2.11.5. Financials (Based on Availability)
- 16.2.12 FN HERSTAL (Herstal Group)
- 16.2.12.1. Overview
- 16.2.12.2. Products
- 16.2.12.3. SWOT Analysis
- 16.2.12.4. Recent Developments
- 16.2.12.5. Financials (Based on Availability)
- 16.2.1 Heckler & Koch GmbH
List of Figures
- Figure 1: Global Automatic Weapons Industry Revenue Breakdown (Million, %) by Region 2024 & 2032
- Figure 2: North America Automatic Weapons Industry Revenue (Million), by Country 2024 & 2032
- Figure 3: North America Automatic Weapons Industry Revenue Share (%), by Country 2024 & 2032
- Figure 4: Europe Automatic Weapons Industry Revenue (Million), by Country 2024 & 2032
- Figure 5: Europe Automatic Weapons Industry Revenue Share (%), by Country 2024 & 2032
- Figure 6: Asia Pacific Automatic Weapons Industry Revenue (Million), by Country 2024 & 2032
- Figure 7: Asia Pacific Automatic Weapons Industry Revenue Share (%), by Country 2024 & 2032
- Figure 8: Latin America Automatic Weapons Industry Revenue (Million), by Country 2024 & 2032
- Figure 9: Latin America Automatic Weapons Industry Revenue Share (%), by Country 2024 & 2032
- Figure 10: Middle East and Africa Automatic Weapons Industry Revenue (Million), by Country 2024 & 2032
- Figure 11: Middle East and Africa Automatic Weapons Industry Revenue Share (%), by Country 2024 & 2032
- Figure 12: North America Automatic Weapons Industry Revenue (Million), by Type 2024 & 2032
- Figure 13: North America Automatic Weapons Industry Revenue Share (%), by Type 2024 & 2032
- Figure 14: North America Automatic Weapons Industry Revenue (Million), by Platform 2024 & 2032
- Figure 15: North America Automatic Weapons Industry Revenue Share (%), by Platform 2024 & 2032
- Figure 16: North America Automatic Weapons Industry Revenue (Million), by Country 2024 & 2032
- Figure 17: North America Automatic Weapons Industry Revenue Share (%), by Country 2024 & 2032
- Figure 18: Europe Automatic Weapons Industry Revenue (Million), by Type 2024 & 2032
- Figure 19: Europe Automatic Weapons Industry Revenue Share (%), by Type 2024 & 2032
- Figure 20: Europe Automatic Weapons Industry Revenue (Million), by Platform 2024 & 2032
- Figure 21: Europe Automatic Weapons Industry Revenue Share (%), by Platform 2024 & 2032
- Figure 22: Europe Automatic Weapons Industry Revenue (Million), by Country 2024 & 2032
- Figure 23: Europe Automatic Weapons Industry Revenue Share (%), by Country 2024 & 2032
- Figure 24: Asia Pacific Automatic Weapons Industry Revenue (Million), by Type 2024 & 2032
- Figure 25: Asia Pacific Automatic Weapons Industry Revenue Share (%), by Type 2024 & 2032
- Figure 26: Asia Pacific Automatic Weapons Industry Revenue (Million), by Platform 2024 & 2032
- Figure 27: Asia Pacific Automatic Weapons Industry Revenue Share (%), by Platform 2024 & 2032
- Figure 28: Asia Pacific Automatic Weapons Industry Revenue (Million), by Country 2024 & 2032
- Figure 29: Asia Pacific Automatic Weapons Industry Revenue Share (%), by Country 2024 & 2032
- Figure 30: Latin America Automatic Weapons Industry Revenue (Million), by Type 2024 & 2032
- Figure 31: Latin America Automatic Weapons Industry Revenue Share (%), by Type 2024 & 2032
- Figure 32: Latin America Automatic Weapons Industry Revenue (Million), by Platform 2024 & 2032
- Figure 33: Latin America Automatic Weapons Industry Revenue Share (%), by Platform 2024 & 2032
- Figure 34: Latin America Automatic Weapons Industry Revenue (Million), by Country 2024 & 2032
- Figure 35: Latin America Automatic Weapons Industry Revenue Share (%), by Country 2024 & 2032
- Figure 36: Middle East and Africa Automatic Weapons Industry Revenue (Million), by Type 2024 & 2032
- Figure 37: Middle East and Africa Automatic Weapons Industry Revenue Share (%), by Type 2024 & 2032
- Figure 38: Middle East and Africa Automatic Weapons Industry Revenue (Million), by Platform 2024 & 2032
- Figure 39: Middle East and Africa Automatic Weapons Industry Revenue Share (%), by Platform 2024 & 2032
- Figure 40: Middle East and Africa Automatic Weapons Industry Revenue (Million), by Country 2024 & 2032
- Figure 41: Middle East and Africa Automatic Weapons Industry Revenue Share (%), by Country 2024 & 2032
List of Tables
- Table 1: Global Automatic Weapons Industry Revenue Million Forecast, by Region 2019 & 2032
- Table 2: Global Automatic Weapons Industry Revenue Million Forecast, by Type 2019 & 2032
- Table 3: Global Automatic Weapons Industry Revenue Million Forecast, by Platform 2019 & 2032
- Table 4: Global Automatic Weapons Industry Revenue Million Forecast, by Region 2019 & 2032
- Table 5: Global Automatic Weapons Industry Revenue Million Forecast, by Country 2019 & 2032
- Table 6: United States Automatic Weapons Industry Revenue (Million) Forecast, by Application 2019 & 2032
- Table 7: Canada Automatic Weapons Industry Revenue (Million) Forecast, by Application 2019 & 2032
- Table 8: Global Automatic Weapons Industry Revenue Million Forecast, by Country 2019 & 2032
- Table 9: United Kingdom Automatic Weapons Industry Revenue (Million) Forecast, by Application 2019 & 2032
- Table 10: Germany Automatic Weapons Industry Revenue (Million) Forecast, by Application 2019 & 2032
- Table 11: France Automatic Weapons Industry Revenue (Million) Forecast, by Application 2019 & 2032
- Table 12: Russia Automatic Weapons Industry Revenue (Million) Forecast, by Application 2019 & 2032
- Table 13: Rest of Europe Automatic Weapons Industry Revenue (Million) Forecast, by Application 2019 & 2032
- Table 14: Global Automatic Weapons Industry Revenue Million Forecast, by Country 2019 & 2032
- Table 15: China Automatic Weapons Industry Revenue (Million) Forecast, by Application 2019 & 2032
- Table 16: India Automatic Weapons Industry Revenue (Million) Forecast, by Application 2019 & 2032
- Table 17: Japan Automatic Weapons Industry Revenue (Million) Forecast, by Application 2019 & 2032
- Table 18: South Korea Automatic Weapons Industry Revenue (Million) Forecast, by Application 2019 & 2032
- Table 19: Rest of Asia Pacific Automatic Weapons Industry Revenue (Million) Forecast, by Application 2019 & 2032
- Table 20: Global Automatic Weapons Industry Revenue Million Forecast, by Country 2019 & 2032
- Table 21: Brazil Automatic Weapons Industry Revenue (Million) Forecast, by Application 2019 & 2032
- Table 22: Rest of Latin America Automatic Weapons Industry Revenue (Million) Forecast, by Application 2019 & 2032
- Table 23: Global Automatic Weapons Industry Revenue Million Forecast, by Country 2019 & 2032
- Table 24: United Arab Emirates Automatic Weapons Industry Revenue (Million) Forecast, by Application 2019 & 2032
- Table 25: Saudi Arabia Automatic Weapons Industry Revenue (Million) Forecast, by Application 2019 & 2032
- Table 26: South Africa Automatic Weapons Industry Revenue (Million) Forecast, by Application 2019 & 2032
- Table 27: Rest of Middle East and Africa Automatic Weapons Industry Revenue (Million) Forecast, by Application 2019 & 2032
- Table 28: Global Automatic Weapons Industry Revenue Million Forecast, by Type 2019 & 2032
- Table 29: Global Automatic Weapons Industry Revenue Million Forecast, by Platform 2019 & 2032
- Table 30: Global Automatic Weapons Industry Revenue Million Forecast, by Country 2019 & 2032
- Table 31: United States Automatic Weapons Industry Revenue (Million) Forecast, by Application 2019 & 2032
- Table 32: Canada Automatic Weapons Industry Revenue (Million) Forecast, by Application 2019 & 2032
- Table 33: Global Automatic Weapons Industry Revenue Million Forecast, by Type 2019 & 2032
- Table 34: Global Automatic Weapons Industry Revenue Million Forecast, by Platform 2019 & 2032
- Table 35: Global Automatic Weapons Industry Revenue Million Forecast, by Country 2019 & 2032
- Table 36: United Kingdom Automatic Weapons Industry Revenue (Million) Forecast, by Application 2019 & 2032
- Table 37: Germany Automatic Weapons Industry Revenue (Million) Forecast, by Application 2019 & 2032
- Table 38: France Automatic Weapons Industry Revenue (Million) Forecast, by Application 2019 & 2032
- Table 39: Russia Automatic Weapons Industry Revenue (Million) Forecast, by Application 2019 & 2032
- Table 40: Rest of Europe Automatic Weapons Industry Revenue (Million) Forecast, by Application 2019 & 2032
- Table 41: Global Automatic Weapons Industry Revenue Million Forecast, by Type 2019 & 2032
- Table 42: Global Automatic Weapons Industry Revenue Million Forecast, by Platform 2019 & 2032
- Table 43: Global Automatic Weapons Industry Revenue Million Forecast, by Country 2019 & 2032
- Table 44: China Automatic Weapons Industry Revenue (Million) Forecast, by Application 2019 & 2032
- Table 45: India Automatic Weapons Industry Revenue (Million) Forecast, by Application 2019 & 2032
- Table 46: Japan Automatic Weapons Industry Revenue (Million) Forecast, by Application 2019 & 2032
- Table 47: South Korea Automatic Weapons Industry Revenue (Million) Forecast, by Application 2019 & 2032
- Table 48: Rest of Asia Pacific Automatic Weapons Industry Revenue (Million) Forecast, by Application 2019 & 2032
- Table 49: Global Automatic Weapons Industry Revenue Million Forecast, by Type 2019 & 2032
- Table 50: Global Automatic Weapons Industry Revenue Million Forecast, by Platform 2019 & 2032
- Table 51: Global Automatic Weapons Industry Revenue Million Forecast, by Country 2019 & 2032
- Table 52: Brazil Automatic Weapons Industry Revenue (Million) Forecast, by Application 2019 & 2032
- Table 53: Rest of Latin America Automatic Weapons Industry Revenue (Million) Forecast, by Application 2019 & 2032
- Table 54: Global Automatic Weapons Industry Revenue Million Forecast, by Type 2019 & 2032
- Table 55: Global Automatic Weapons Industry Revenue Million Forecast, by Platform 2019 & 2032
- Table 56: Global Automatic Weapons Industry Revenue Million Forecast, by Country 2019 & 2032
- Table 57: United Arab Emirates Automatic Weapons Industry Revenue (Million) Forecast, by Application 2019 & 2032
- Table 58: Saudi Arabia Automatic Weapons Industry Revenue (Million) Forecast, by Application 2019 & 2032
- Table 59: South Africa Automatic Weapons Industry Revenue (Million) Forecast, by Application 2019 & 2032
- Table 60: Rest of Middle East and Africa Automatic Weapons Industry Revenue (Million) Forecast, by Application 2019 & 2032
Frequently Asked Questions
1. What is the projected Compound Annual Growth Rate (CAGR) of the Automatic Weapons Industry?
The projected CAGR is approximately 7.50%.
2. Which companies are prominent players in the Automatic Weapons Industry?
Key companies in the market include Heckler & Koch GmbH, Denel Land Systems, General Dynamics Corporation, Rheinmetall AG, Colt's Manufacturing Company LLC, UkrOboronProm, Sig Sauer Inc, Israel Weapon Industries (IWI) Ltd, Singapore Technologies Engineering Ltd, BAE Systems plc, Northrop Grumman Corporation, FN HERSTAL (Herstal Group).
3. What are the main segments of the Automatic Weapons Industry?
The market segments include Type, Platform.
4. Can you provide details about the market size?
The market size is estimated to be USD 9.47 Million as of 2022.
5. What are some drivers contributing to market growth?
N/A
6. What are the notable trends driving market growth?
Land Segment to Witness Highest Growth During the Forecast Period.
7. Are there any restraints impacting market growth?
N/A
8. Can you provide examples of recent developments in the market?
March 2023: the Estonian Defense Investment Centre awarded an order to Israel's IWI for the supply of 1,000 NG7 "Negev" light machine weapon systems to the Estonian Army. The "Negevv" machine guns, which are expected to be delivered towards the end of 2023, will take over from MG3 and KSP-58 machines that are already in use. NEGEV 7.62 LMG is a NATO 7.62x51mm Light machine gun, which is used by many countries worldwide.
9. What pricing options are available for accessing the report?
Pricing options include single-user, multi-user, and enterprise licenses priced at USD 4750, USD 5250, and USD 8750 respectively.
10. Is the market size provided in terms of value or volume?
The market size is provided in terms of value, measured in Million.
11. Are there any specific market keywords associated with the report?
Yes, the market keyword associated with the report is "Automatic Weapons Industry," which aids in identifying and referencing the specific market segment covered.
12. How do I determine which pricing option suits my needs best?
The pricing options vary based on user requirements and access needs. Individual users may opt for single-user licenses, while businesses requiring broader access may choose multi-user or enterprise licenses for cost-effective access to the report.
13. Are there any additional resources or data provided in the Automatic Weapons Industry report?
While the report offers comprehensive insights, it's advisable to review the specific contents or supplementary materials provided to ascertain if additional resources or data are available.
14. How can I stay updated on further developments or reports in the Automatic Weapons Industry?
To stay informed about further developments, trends, and reports in the Automatic Weapons Industry, consider subscribing to industry newsletters, following relevant companies and organizations, or regularly checking reputable industry news sources and publications.
Methodology
Step 1 - Identification of Relevant Samples Size from Population Database


Step 2 - Approaches for Defining Global Market Size (Value, Volume* & Price*)

Note*: In applicable scenarios
Step 3 - Data Sources
Primary Research
- Web Analytics
- Survey Reports
- Research Institute
- Latest Research Reports
- Opinion Leaders
Secondary Research
- Annual Reports
- White Paper
- Latest Press Release
- Industry Association
- Paid Database
- Investor Presentations

Step 4 - Data Triangulation
Involves using different sources of information in order to increase the validity of a study
These sources are likely to be stakeholders in a program - participants, other researchers, program staff, other community members, and so on.
Then we put all data in single framework & apply various statistical tools to find out the dynamic on the market.
During the analysis stage, feedback from the stakeholder groups would be compared to determine areas of agreement as well as areas of divergence
