

Key Insights
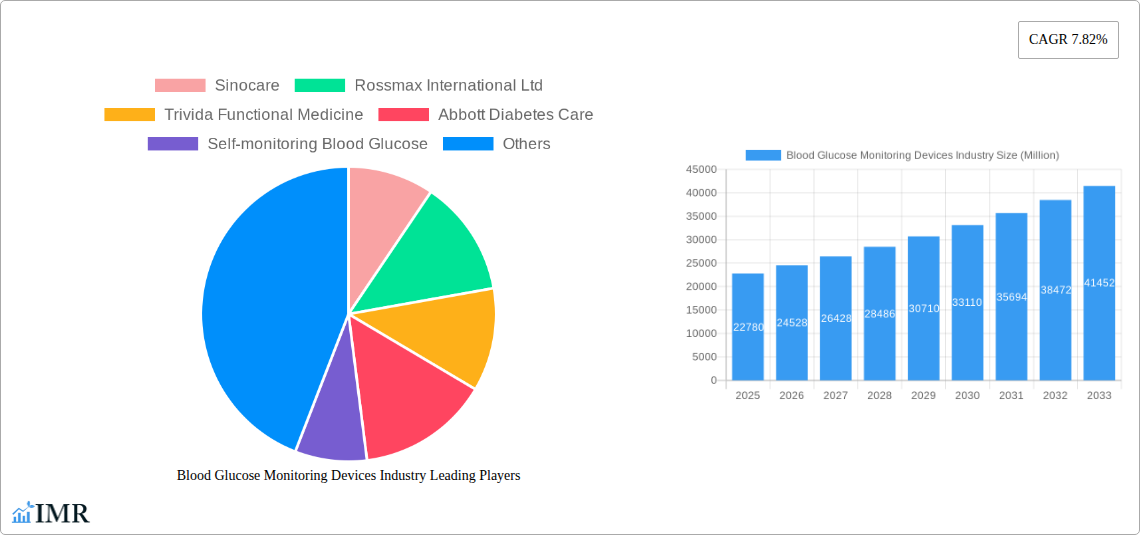
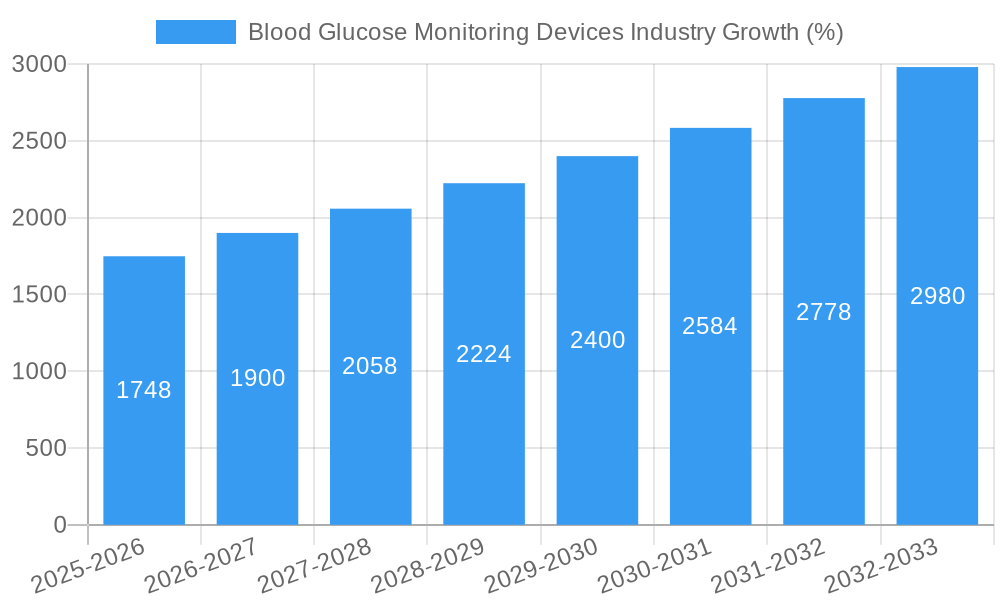
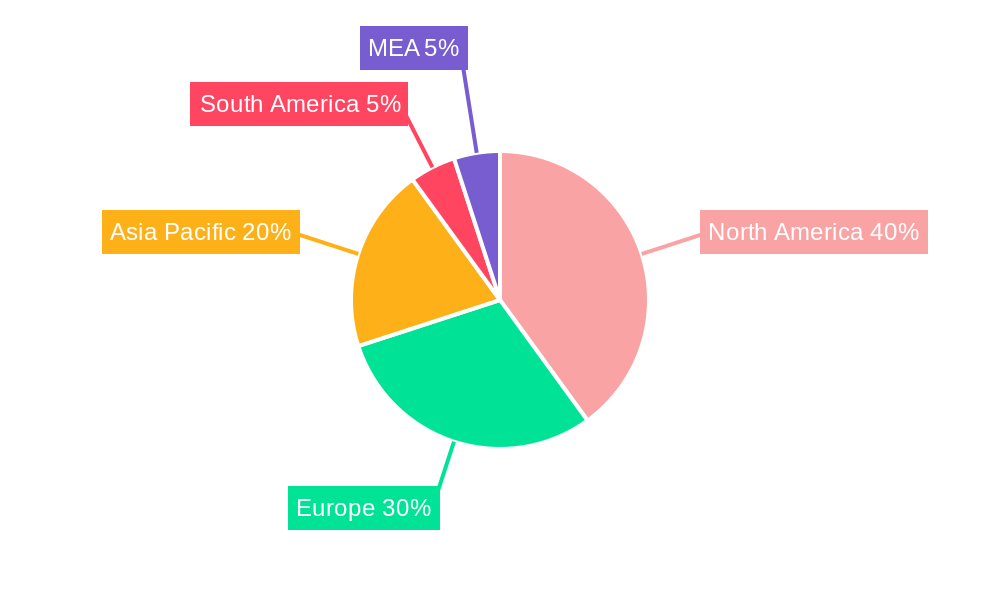
The global blood glucose monitoring devices market, valued at $22.78 billion in 2025, is projected to experience robust growth, driven by a rising prevalence of diabetes worldwide, particularly type 2 diabetes. The market's Compound Annual Growth Rate (CAGR) of 7.82% from 2025 to 2033 signifies significant expansion opportunities. Key growth drivers include technological advancements in continuous glucose monitoring (CGM) systems, increasing demand for convenient and accurate self-monitoring blood glucose (SMBG) devices, and growing awareness of proactive diabetes management. The rising adoption of CGM, offering real-time glucose data, is significantly impacting the market, shifting preference from traditional SMBG methods. However, high costs associated with CGM devices, particularly for continuous use, and the need for regular calibration remain significant restraints. The market is segmented by device type (SMBG, CGM, and lancets) and end-user (hospitals/clinics and home use). The home-use segment is anticipated to dominate due to the increasing number of individuals managing their diabetes independently. Furthermore, geographic variations exist, with North America and Europe currently holding significant market shares due to higher diabetes prevalence and advanced healthcare infrastructure; however, the Asia-Pacific region is projected to witness the fastest growth due to a rapidly increasing diabetic population and rising healthcare spending. Major players like Abbott Diabetes Care, Dexcom Inc., and Roche Holding AG are driving innovation and competition within the market.
The market's future growth trajectory will depend on several factors. Successful integration of CGM data with other health monitoring systems and the development of more affordable CGM technology are crucial for wider adoption. Furthermore, government initiatives aimed at improving diabetes management and patient education will play a vital role. The market’s competitive landscape is characterized by both established players and emerging companies focusing on technological innovation and improved patient outcomes. Continued investment in research and development will be critical to address unmet needs and further enhance the accuracy, convenience, and affordability of blood glucose monitoring solutions, thereby driving market expansion. The focus will likely shift towards personalized diabetes management solutions, incorporating artificial intelligence and data analytics to optimize treatment plans.
Blood Glucose Monitoring Devices Industry Market Report: 2019-2033
This comprehensive report provides an in-depth analysis of the Blood Glucose Monitoring Devices industry, covering the period 2019-2033. It segments the market by device type (Self-Monitoring Blood Glucose, Continuous Glucose Monitoring Devices, Lancets), end-user (Hospital/Clinics Usage, Self/Home Usage), and key indicators (Type-1 and Type-2 Diabetes populations), offering granular insights into revenue (in million units) and volume trends. The report features detailed company profiles of key players including Abbott Diabetes Care, Dexcom Inc, Medtronic PLC, and more, analyzing their market strategies and competitive landscape. This report is essential for industry professionals, investors, and strategic decision-makers seeking a thorough understanding of this dynamic market.
Blood Glucose Monitoring Devices Industry Market Dynamics & Structure
The blood glucose monitoring devices market is characterized by a moderately consolidated structure with a few major players holding significant market share. Technological innovation, particularly in Continuous Glucose Monitoring (CGM) devices, is a key driver, while regulatory frameworks and reimbursement policies significantly influence market access and adoption rates. The market also faces competition from substitute technologies and evolving end-user demographics, necessitating continuous innovation and adaptation. M&A activity has been moderate, with strategic acquisitions driving consolidation and expanding product portfolios.
- Market Concentration: The top 5 players account for approximately xx% of the global market (2024).
- Technological Innovation: Focus on miniaturization, improved accuracy, and integration with mobile health (mHealth) technologies.
- Regulatory Landscape: Stringent regulatory approvals and reimbursement policies impact market entry and product adoption.
- Competitive Substitutes: Alternative diabetes management techniques and emerging technologies pose a competitive threat.
- End-User Demographics: The aging global population and rising prevalence of diabetes are key drivers of market growth.
- M&A Trends: A moderate number of strategic acquisitions aimed at expanding product lines and geographic reach have been observed in the past 5 years, totaling approximately xx deals.
Blood Glucose Monitoring Devices Industry Growth Trends & Insights
The global blood glucose monitoring devices market experienced robust growth from 2019 to 2024, driven primarily by the increasing prevalence of diabetes worldwide and technological advancements in CGM systems. The market size, estimated at xx million units in 2025, is projected to expand at a CAGR of xx% during the forecast period (2025-2033), reaching xx million units by 2033. This growth is fueled by several factors including increased awareness of diabetes management, rising healthcare expenditure, and the adoption of advanced technologies. The shift towards CGM devices from self-monitoring blood glucose (SMBG) systems is a key trend, reflecting the preference for continuous data and improved convenience. Consumer behavior is shifting towards preference for non-invasive, integrated, and user-friendly devices. Improved accuracy, integration with mobile applications for data management and remote monitoring, and user-friendly interfaces are driving adoption rates.
Dominant Regions, Countries, or Segments in Blood Glucose Monitoring Devices Industry
North America currently holds the largest market share in the blood glucose monitoring devices industry, driven by high diabetes prevalence, advanced healthcare infrastructure, and high disposable incomes. However, the Asia-Pacific region is expected to experience the fastest growth due to rising diabetes prevalence, expanding healthcare access, and increasing adoption of advanced technologies. Within the segments:
- Device: Continuous Glucose Monitoring (CGM) devices are experiencing the highest growth rate, surpassing SMBG due to improved accuracy, convenience, and continuous monitoring capabilities.
- End-User: The self/home usage segment constitutes the largest market share, driven by a growing preference for self-management of diabetes.
- Indicators: The type-2 diabetes population represents a significant driver of market growth, given its much larger size than type-1.
Key Drivers for North America: Strong regulatory support, established healthcare infrastructure, high per capita income, and extensive research & development efforts in the region.
Key Drivers for Asia-Pacific: Rapidly growing diabetic population, increasing healthcare spending, improving access to healthcare services, and growing awareness about diabetes management.
Blood Glucose Monitoring Devices Industry Product Landscape
The blood glucose monitoring devices market showcases a range of products catering to diverse user needs and preferences. Innovations include smaller, more accurate devices with extended wear times, enhanced data connectivity features, and improved ease of use. Continuous glucose monitoring (CGM) systems are becoming increasingly sophisticated, offering features like predictive alerts for hypo- and hyperglycemia, helping users to proactively manage their condition. Key advancements include improved sensor technology for more accurate readings and longer wear times, along with sophisticated algorithms and advanced analytics for data interpretation. The development of non-invasive methods for blood glucose monitoring is also gathering pace.
Key Drivers, Barriers & Challenges in Blood Glucose Monitoring Devices Industry
Key Drivers:
- Rising prevalence of diabetes globally.
- Technological advancements in CGM systems.
- Increased awareness of diabetes management.
- Government initiatives and regulatory support for diabetes care.
Challenges & Restraints:
- High cost of CGM devices can limit accessibility for certain demographics.
- Accuracy limitations of certain technologies may lead to user hesitancy.
- Regulatory approvals and reimbursement policies vary across regions.
- The need for calibration may pose inconvenience to users.
Emerging Opportunities in Blood Glucose Monitoring Devices Industry
- Expansion into untapped markets in developing countries.
- Integration with wearable technology and telemedicine platforms for remote monitoring.
- Development of artificial intelligence-driven diagnostics and personalized diabetes management solutions.
- Focus on user-friendly, non-invasive, and convenient monitoring systems.
Growth Accelerators in the Blood Glucose Monitoring Devices Industry
Technological advancements, particularly in the area of CGM, will continue to be major drivers of growth. Strategic partnerships between device manufacturers, pharmaceutical companies, and healthcare providers will facilitate market expansion. Government initiatives and healthcare policies supporting the adoption of advanced diabetes management technologies also contribute. Focus on enhancing data analytics, integration with digital health platforms, and the development of non-invasive monitoring techniques are crucial for sustaining growth.
Key Players Shaping the Blood Glucose Monitoring Devices Market
- Sinocare
- Rossmax International Ltd
- Trivida Functional Medicine
- Abbott Diabetes Care
- Self-monitoring Blood Glucose
- Dexcom Inc
- Continuous Glucose Monitoring Devices
- Acon Laboratories Inc
- Medtronic PLC
- Agamatrix Inc
- Medisana AG
- Bionime Corporation
- LifeScan
- Roche Holding AG
- Arkray Inc
- Ascensia Diabetes Care
Notable Milestones in Blood Glucose Monitoring Devices Industry Sector
- October 2023: The Canadian government approved Dexcom's next-generation Dexcom G7 Continuous Glucose Monitoring System for Canadian type-1 diabetes patients. This significantly expands market access for Dexcom in Canada.
- June 2023: The South Korean Ministry of Food and Drug Safety approved the CareSens Air CGM device, manufactured by I-SENS. This marks a significant development for the local CGM market in South Korea, offering a compact and user-friendly option.
In-Depth Blood Glucose Monitoring Devices Industry Market Outlook
The blood glucose monitoring devices market is poised for continued strong growth, driven by technological advancements, expanding diabetes prevalence, and increasing healthcare investments. Strategic partnerships, particularly in data analytics and telehealth, offer significant opportunities for market expansion. The development of non-invasive and user-friendly technologies will play a key role in shaping the future of this market, promising greater accessibility and improved patient outcomes.
Blood Glucose Monitoring Devices Industry Segmentation
-
1. Device (Revenue and Volume)
-
1.1. Self-Monitoring Blood Glucose
- 1.1.1. Glucometer Devices
- 1.1.2. Test Strips
- 1.1.3. Lancets
-
1.2. Continuous Glucose Monitoring
- 1.2.1. Sensors
- 1.2.2. Durables (Receivers and Transmitters)
-
1.1. Self-Monitoring Blood Glucose
-
2. End User (Revenue and Volume)
- 2.1. Hospital/Clinics Usage
- 2.2. Self/Home Usage
-
3. Indicators (Revenue and Volume)
- 3.1. Type-1 Diabetes Population
- 3.2. Type-2 Diabetes Population
Blood Glucose Monitoring Devices Industry Segmentation By Geography
-
1. North America
- 1.1. By Device
- 2. By Country
- 3. United States
- 4. Canada
- 5. Rest of North America
-
6. Europe
- 6.1. By Device
- 7. By Country
- 8. France
- 9. Germany
- 10. Italy
- 11. Spain
- 12. United Kingdom
- 13. Russia
- 14. Rest of Europe
-
15. Latin America
- 15.1. By Device
- 16. By Country
- 17. Mexico
- 18. Brazil
- 19. Rest of Latin America
-
20. Asia Pacific
- 20.1. By Device
- 21. By Country
- 22. Japan
- 23. South Korea
- 24. China
- 25. India
- 26. Australia
- 27. Vietnam
- 28. Malaysia
- 29. Indonesia
- 30. Philippines
- 31. Thailand
- 32. Rest of Asia Pacific
-
33. Middle East and Africa
- 33.1. By Device
- 34. By Country
- 35. Saudi Arabia
- 36. Iran
- 37. Egypt
- 38. Oman
- 39. South Africa
- 40. Rest of Middle East and Africa
Blood Glucose Monitoring Devices Industry REPORT HIGHLIGHTS
| Aspects | Details |
|---|---|
| Study Period | 2019-2033 |
| Base Year | 2024 |
| Estimated Year | 2025 |
| Forecast Period | 2025-2033 |
| Historical Period | 2019-2024 |
| Growth Rate | CAGR of 7.82% from 2019-2033 |
| Segmentation |
|
Table of Contents
- 1. Introduction
- 1.1. Research Scope
- 1.2. Market Segmentation
- 1.3. Research Methodology
- 1.4. Definitions and Assumptions
- 2. Executive Summary
- 2.1. Introduction
- 3. Market Dynamics
- 3.1. Introduction
- 3.2. Market Drivers
- 3.2.1. Rising Prevalence of Cancer Worldwide; Technological Advancements in Diagnostic Testing; Increasing Demand for Point-of-care Treatment
- 3.3. Market Restrains
- 3.3.1. High Cost of Molecular Diagnostic Tests; Lack of Skilled Workforce and Stringent Regulatory Framework
- 3.4. Market Trends
- 3.4.1. The Self-blood Glucose Monitoring Segment held the Highest Market Share in the Current Year
- 4. Market Factor Analysis
- 4.1. Porters Five Forces
- 4.2. Supply/Value Chain
- 4.3. PESTEL analysis
- 4.4. Market Entropy
- 4.5. Patent/Trademark Analysis
- 5. Global Blood Glucose Monitoring Devices Industry Analysis, Insights and Forecast, 2019-2031
- 5.1. Market Analysis, Insights and Forecast - by Device (Revenue and Volume)
- 5.1.1. Self-Monitoring Blood Glucose
- 5.1.1.1. Glucometer Devices
- 5.1.1.2. Test Strips
- 5.1.1.3. Lancets
- 5.1.2. Continuous Glucose Monitoring
- 5.1.2.1. Sensors
- 5.1.2.2. Durables (Receivers and Transmitters)
- 5.1.1. Self-Monitoring Blood Glucose
- 5.2. Market Analysis, Insights and Forecast - by End User (Revenue and Volume)
- 5.2.1. Hospital/Clinics Usage
- 5.2.2. Self/Home Usage
- 5.3. Market Analysis, Insights and Forecast - by Indicators (Revenue and Volume)
- 5.3.1. Type-1 Diabetes Population
- 5.3.2. Type-2 Diabetes Population
- 5.4. Market Analysis, Insights and Forecast - by Region
- 5.4.1. North America
- 5.4.2. By Country
- 5.4.3. United States
- 5.4.4. Canada
- 5.4.5. Rest of North America
- 5.4.6. Europe
- 5.4.7. By Country
- 5.4.8. France
- 5.4.9. Germany
- 5.4.10. Italy
- 5.4.11. Spain
- 5.4.12. United Kingdom
- 5.4.13. Russia
- 5.4.14. Rest of Europe
- 5.4.15. Latin America
- 5.4.16. By Country
- 5.4.17. Mexico
- 5.4.18. Brazil
- 5.4.19. Rest of Latin America
- 5.4.20. Asia Pacific
- 5.4.21. By Country
- 5.4.22. Japan
- 5.4.23. South Korea
- 5.4.24. China
- 5.4.25. India
- 5.4.26. Australia
- 5.4.27. Vietnam
- 5.4.28. Malaysia
- 5.4.29. Indonesia
- 5.4.30. Philippines
- 5.4.31. Thailand
- 5.4.32. Rest of Asia Pacific
- 5.4.33. Middle East and Africa
- 5.4.34. By Country
- 5.4.35. Saudi Arabia
- 5.4.36. Iran
- 5.4.37. Egypt
- 5.4.38. Oman
- 5.4.39. South Africa
- 5.4.40. Rest of Middle East and Africa
- 5.1. Market Analysis, Insights and Forecast - by Device (Revenue and Volume)
- 6. North America Blood Glucose Monitoring Devices Industry Analysis, Insights and Forecast, 2019-2031
- 6.1. Market Analysis, Insights and Forecast - by Device (Revenue and Volume)
- 6.1.1. Self-Monitoring Blood Glucose
- 6.1.1.1. Glucometer Devices
- 6.1.1.2. Test Strips
- 6.1.1.3. Lancets
- 6.1.2. Continuous Glucose Monitoring
- 6.1.2.1. Sensors
- 6.1.2.2. Durables (Receivers and Transmitters)
- 6.1.1. Self-Monitoring Blood Glucose
- 6.2. Market Analysis, Insights and Forecast - by End User (Revenue and Volume)
- 6.2.1. Hospital/Clinics Usage
- 6.2.2. Self/Home Usage
- 6.3. Market Analysis, Insights and Forecast - by Indicators (Revenue and Volume)
- 6.3.1. Type-1 Diabetes Population
- 6.3.2. Type-2 Diabetes Population
- 6.1. Market Analysis, Insights and Forecast - by Device (Revenue and Volume)
- 7. By Country Blood Glucose Monitoring Devices Industry Analysis, Insights and Forecast, 2019-2031
- 7.1. Market Analysis, Insights and Forecast - by Device (Revenue and Volume)
- 7.1.1. Self-Monitoring Blood Glucose
- 7.1.1.1. Glucometer Devices
- 7.1.1.2. Test Strips
- 7.1.1.3. Lancets
- 7.1.2. Continuous Glucose Monitoring
- 7.1.2.1. Sensors
- 7.1.2.2. Durables (Receivers and Transmitters)
- 7.1.1. Self-Monitoring Blood Glucose
- 7.2. Market Analysis, Insights and Forecast - by End User (Revenue and Volume)
- 7.2.1. Hospital/Clinics Usage
- 7.2.2. Self/Home Usage
- 7.3. Market Analysis, Insights and Forecast - by Indicators (Revenue and Volume)
- 7.3.1. Type-1 Diabetes Population
- 7.3.2. Type-2 Diabetes Population
- 7.1. Market Analysis, Insights and Forecast - by Device (Revenue and Volume)
- 8. United States Blood Glucose Monitoring Devices Industry Analysis, Insights and Forecast, 2019-2031
- 8.1. Market Analysis, Insights and Forecast - by Device (Revenue and Volume)
- 8.1.1. Self-Monitoring Blood Glucose
- 8.1.1.1. Glucometer Devices
- 8.1.1.2. Test Strips
- 8.1.1.3. Lancets
- 8.1.2. Continuous Glucose Monitoring
- 8.1.2.1. Sensors
- 8.1.2.2. Durables (Receivers and Transmitters)
- 8.1.1. Self-Monitoring Blood Glucose
- 8.2. Market Analysis, Insights and Forecast - by End User (Revenue and Volume)
- 8.2.1. Hospital/Clinics Usage
- 8.2.2. Self/Home Usage
- 8.3. Market Analysis, Insights and Forecast - by Indicators (Revenue and Volume)
- 8.3.1. Type-1 Diabetes Population
- 8.3.2. Type-2 Diabetes Population
- 8.1. Market Analysis, Insights and Forecast - by Device (Revenue and Volume)
- 9. Canada Blood Glucose Monitoring Devices Industry Analysis, Insights and Forecast, 2019-2031
- 9.1. Market Analysis, Insights and Forecast - by Device (Revenue and Volume)
- 9.1.1. Self-Monitoring Blood Glucose
- 9.1.1.1. Glucometer Devices
- 9.1.1.2. Test Strips
- 9.1.1.3. Lancets
- 9.1.2. Continuous Glucose Monitoring
- 9.1.2.1. Sensors
- 9.1.2.2. Durables (Receivers and Transmitters)
- 9.1.1. Self-Monitoring Blood Glucose
- 9.2. Market Analysis, Insights and Forecast - by End User (Revenue and Volume)
- 9.2.1. Hospital/Clinics Usage
- 9.2.2. Self/Home Usage
- 9.3. Market Analysis, Insights and Forecast - by Indicators (Revenue and Volume)
- 9.3.1. Type-1 Diabetes Population
- 9.3.2. Type-2 Diabetes Population
- 9.1. Market Analysis, Insights and Forecast - by Device (Revenue and Volume)
- 10. Rest of North America Blood Glucose Monitoring Devices Industry Analysis, Insights and Forecast, 2019-2031
- 10.1. Market Analysis, Insights and Forecast - by Device (Revenue and Volume)
- 10.1.1. Self-Monitoring Blood Glucose
- 10.1.1.1. Glucometer Devices
- 10.1.1.2. Test Strips
- 10.1.1.3. Lancets
- 10.1.2. Continuous Glucose Monitoring
- 10.1.2.1. Sensors
- 10.1.2.2. Durables (Receivers and Transmitters)
- 10.1.1. Self-Monitoring Blood Glucose
- 10.2. Market Analysis, Insights and Forecast - by End User (Revenue and Volume)
- 10.2.1. Hospital/Clinics Usage
- 10.2.2. Self/Home Usage
- 10.3. Market Analysis, Insights and Forecast - by Indicators (Revenue and Volume)
- 10.3.1. Type-1 Diabetes Population
- 10.3.2. Type-2 Diabetes Population
- 10.1. Market Analysis, Insights and Forecast - by Device (Revenue and Volume)
- 11. Europe Blood Glucose Monitoring Devices Industry Analysis, Insights and Forecast, 2019-2031
- 11.1. Market Analysis, Insights and Forecast - by Device (Revenue and Volume)
- 11.1.1. Self-Monitoring Blood Glucose
- 11.1.1.1. Glucometer Devices
- 11.1.1.2. Test Strips
- 11.1.1.3. Lancets
- 11.1.2. Continuous Glucose Monitoring
- 11.1.2.1. Sensors
- 11.1.2.2. Durables (Receivers and Transmitters)
- 11.1.1. Self-Monitoring Blood Glucose
- 11.2. Market Analysis, Insights and Forecast - by End User (Revenue and Volume)
- 11.2.1. Hospital/Clinics Usage
- 11.2.2. Self/Home Usage
- 11.3. Market Analysis, Insights and Forecast - by Indicators (Revenue and Volume)
- 11.3.1. Type-1 Diabetes Population
- 11.3.2. Type-2 Diabetes Population
- 11.1. Market Analysis, Insights and Forecast - by Device (Revenue and Volume)
- 12. By Country Blood Glucose Monitoring Devices Industry Analysis, Insights and Forecast, 2019-2031
- 12.1. Market Analysis, Insights and Forecast - by Device (Revenue and Volume)
- 12.1.1. Self-Monitoring Blood Glucose
- 12.1.1.1. Glucometer Devices
- 12.1.1.2. Test Strips
- 12.1.1.3. Lancets
- 12.1.2. Continuous Glucose Monitoring
- 12.1.2.1. Sensors
- 12.1.2.2. Durables (Receivers and Transmitters)
- 12.1.1. Self-Monitoring Blood Glucose
- 12.2. Market Analysis, Insights and Forecast - by End User (Revenue and Volume)
- 12.2.1. Hospital/Clinics Usage
- 12.2.2. Self/Home Usage
- 12.3. Market Analysis, Insights and Forecast - by Indicators (Revenue and Volume)
- 12.3.1. Type-1 Diabetes Population
- 12.3.2. Type-2 Diabetes Population
- 12.1. Market Analysis, Insights and Forecast - by Device (Revenue and Volume)
- 13. France Blood Glucose Monitoring Devices Industry Analysis, Insights and Forecast, 2019-2031
- 13.1. Market Analysis, Insights and Forecast - by Device (Revenue and Volume)
- 13.1.1. Self-Monitoring Blood Glucose
- 13.1.1.1. Glucometer Devices
- 13.1.1.2. Test Strips
- 13.1.1.3. Lancets
- 13.1.2. Continuous Glucose Monitoring
- 13.1.2.1. Sensors
- 13.1.2.2. Durables (Receivers and Transmitters)
- 13.1.1. Self-Monitoring Blood Glucose
- 13.2. Market Analysis, Insights and Forecast - by End User (Revenue and Volume)
- 13.2.1. Hospital/Clinics Usage
- 13.2.2. Self/Home Usage
- 13.3. Market Analysis, Insights and Forecast - by Indicators (Revenue and Volume)
- 13.3.1. Type-1 Diabetes Population
- 13.3.2. Type-2 Diabetes Population
- 13.1. Market Analysis, Insights and Forecast - by Device (Revenue and Volume)
- 14. Germany Blood Glucose Monitoring Devices Industry Analysis, Insights and Forecast, 2019-2031
- 14.1. Market Analysis, Insights and Forecast - by Device (Revenue and Volume)
- 14.1.1. Self-Monitoring Blood Glucose
- 14.1.1.1. Glucometer Devices
- 14.1.1.2. Test Strips
- 14.1.1.3. Lancets
- 14.1.2. Continuous Glucose Monitoring
- 14.1.2.1. Sensors
- 14.1.2.2. Durables (Receivers and Transmitters)
- 14.1.1. Self-Monitoring Blood Glucose
- 14.2. Market Analysis, Insights and Forecast - by End User (Revenue and Volume)
- 14.2.1. Hospital/Clinics Usage
- 14.2.2. Self/Home Usage
- 14.3. Market Analysis, Insights and Forecast - by Indicators (Revenue and Volume)
- 14.3.1. Type-1 Diabetes Population
- 14.3.2. Type-2 Diabetes Population
- 14.1. Market Analysis, Insights and Forecast - by Device (Revenue and Volume)
- 15. Italy Blood Glucose Monitoring Devices Industry Analysis, Insights and Forecast, 2019-2031
- 15.1. Market Analysis, Insights and Forecast - by Device (Revenue and Volume)
- 15.1.1. Self-Monitoring Blood Glucose
- 15.1.1.1. Glucometer Devices
- 15.1.1.2. Test Strips
- 15.1.1.3. Lancets
- 15.1.2. Continuous Glucose Monitoring
- 15.1.2.1. Sensors
- 15.1.2.2. Durables (Receivers and Transmitters)
- 15.1.1. Self-Monitoring Blood Glucose
- 15.2. Market Analysis, Insights and Forecast - by End User (Revenue and Volume)
- 15.2.1. Hospital/Clinics Usage
- 15.2.2. Self/Home Usage
- 15.3. Market Analysis, Insights and Forecast - by Indicators (Revenue and Volume)
- 15.3.1. Type-1 Diabetes Population
- 15.3.2. Type-2 Diabetes Population
- 15.1. Market Analysis, Insights and Forecast - by Device (Revenue and Volume)
- 16. Spain Blood Glucose Monitoring Devices Industry Analysis, Insights and Forecast, 2019-2031
- 16.1. Market Analysis, Insights and Forecast - by Device (Revenue and Volume)
- 16.1.1. Self-Monitoring Blood Glucose
- 16.1.1.1. Glucometer Devices
- 16.1.1.2. Test Strips
- 16.1.1.3. Lancets
- 16.1.2. Continuous Glucose Monitoring
- 16.1.2.1. Sensors
- 16.1.2.2. Durables (Receivers and Transmitters)
- 16.1.1. Self-Monitoring Blood Glucose
- 16.2. Market Analysis, Insights and Forecast - by End User (Revenue and Volume)
- 16.2.1. Hospital/Clinics Usage
- 16.2.2. Self/Home Usage
- 16.3. Market Analysis, Insights and Forecast - by Indicators (Revenue and Volume)
- 16.3.1. Type-1 Diabetes Population
- 16.3.2. Type-2 Diabetes Population
- 16.1. Market Analysis, Insights and Forecast - by Device (Revenue and Volume)
- 17. United Kingdom Blood Glucose Monitoring Devices Industry Analysis, Insights and Forecast, 2019-2031
- 17.1. Market Analysis, Insights and Forecast - by Device (Revenue and Volume)
- 17.1.1. Self-Monitoring Blood Glucose
- 17.1.1.1. Glucometer Devices
- 17.1.1.2. Test Strips
- 17.1.1.3. Lancets
- 17.1.2. Continuous Glucose Monitoring
- 17.1.2.1. Sensors
- 17.1.2.2. Durables (Receivers and Transmitters)
- 17.1.1. Self-Monitoring Blood Glucose
- 17.2. Market Analysis, Insights and Forecast - by End User (Revenue and Volume)
- 17.2.1. Hospital/Clinics Usage
- 17.2.2. Self/Home Usage
- 17.3. Market Analysis, Insights and Forecast - by Indicators (Revenue and Volume)
- 17.3.1. Type-1 Diabetes Population
- 17.3.2. Type-2 Diabetes Population
- 17.1. Market Analysis, Insights and Forecast - by Device (Revenue and Volume)
- 18. Russia Blood Glucose Monitoring Devices Industry Analysis, Insights and Forecast, 2019-2031
- 18.1. Market Analysis, Insights and Forecast - by Device (Revenue and Volume)
- 18.1.1. Self-Monitoring Blood Glucose
- 18.1.1.1. Glucometer Devices
- 18.1.1.2. Test Strips
- 18.1.1.3. Lancets
- 18.1.2. Continuous Glucose Monitoring
- 18.1.2.1. Sensors
- 18.1.2.2. Durables (Receivers and Transmitters)
- 18.1.1. Self-Monitoring Blood Glucose
- 18.2. Market Analysis, Insights and Forecast - by End User (Revenue and Volume)
- 18.2.1. Hospital/Clinics Usage
- 18.2.2. Self/Home Usage
- 18.3. Market Analysis, Insights and Forecast - by Indicators (Revenue and Volume)
- 18.3.1. Type-1 Diabetes Population
- 18.3.2. Type-2 Diabetes Population
- 18.1. Market Analysis, Insights and Forecast - by Device (Revenue and Volume)
- 19. Rest of Europe Blood Glucose Monitoring Devices Industry Analysis, Insights and Forecast, 2019-2031
- 19.1. Market Analysis, Insights and Forecast - by Device (Revenue and Volume)
- 19.1.1. Self-Monitoring Blood Glucose
- 19.1.1.1. Glucometer Devices
- 19.1.1.2. Test Strips
- 19.1.1.3. Lancets
- 19.1.2. Continuous Glucose Monitoring
- 19.1.2.1. Sensors
- 19.1.2.2. Durables (Receivers and Transmitters)
- 19.1.1. Self-Monitoring Blood Glucose
- 19.2. Market Analysis, Insights and Forecast - by End User (Revenue and Volume)
- 19.2.1. Hospital/Clinics Usage
- 19.2.2. Self/Home Usage
- 19.3. Market Analysis, Insights and Forecast - by Indicators (Revenue and Volume)
- 19.3.1. Type-1 Diabetes Population
- 19.3.2. Type-2 Diabetes Population
- 19.1. Market Analysis, Insights and Forecast - by Device (Revenue and Volume)
- 20. Latin America Blood Glucose Monitoring Devices Industry Analysis, Insights and Forecast, 2019-2031
- 20.1. Market Analysis, Insights and Forecast - by Device (Revenue and Volume)
- 20.1.1. Self-Monitoring Blood Glucose
- 20.1.1.1. Glucometer Devices
- 20.1.1.2. Test Strips
- 20.1.1.3. Lancets
- 20.1.2. Continuous Glucose Monitoring
- 20.1.2.1. Sensors
- 20.1.2.2. Durables (Receivers and Transmitters)
- 20.1.1. Self-Monitoring Blood Glucose
- 20.2. Market Analysis, Insights and Forecast - by End User (Revenue and Volume)
- 20.2.1. Hospital/Clinics Usage
- 20.2.2. Self/Home Usage
- 20.3. Market Analysis, Insights and Forecast - by Indicators (Revenue and Volume)
- 20.3.1. Type-1 Diabetes Population
- 20.3.2. Type-2 Diabetes Population
- 20.1. Market Analysis, Insights and Forecast - by Device (Revenue and Volume)
- 21. By Country Blood Glucose Monitoring Devices Industry Analysis, Insights and Forecast, 2019-2031
- 21.1. Market Analysis, Insights and Forecast - by Device (Revenue and Volume)
- 21.1.1. Self-Monitoring Blood Glucose
- 21.1.1.1. Glucometer Devices
- 21.1.1.2. Test Strips
- 21.1.1.3. Lancets
- 21.1.2. Continuous Glucose Monitoring
- 21.1.2.1. Sensors
- 21.1.2.2. Durables (Receivers and Transmitters)
- 21.1.1. Self-Monitoring Blood Glucose
- 21.2. Market Analysis, Insights and Forecast - by End User (Revenue and Volume)
- 21.2.1. Hospital/Clinics Usage
- 21.2.2. Self/Home Usage
- 21.3. Market Analysis, Insights and Forecast - by Indicators (Revenue and Volume)
- 21.3.1. Type-1 Diabetes Population
- 21.3.2. Type-2 Diabetes Population
- 21.1. Market Analysis, Insights and Forecast - by Device (Revenue and Volume)
- 22. Mexico Blood Glucose Monitoring Devices Industry Analysis, Insights and Forecast, 2019-2031
- 22.1. Market Analysis, Insights and Forecast - by Device (Revenue and Volume)
- 22.1.1. Self-Monitoring Blood Glucose
- 22.1.1.1. Glucometer Devices
- 22.1.1.2. Test Strips
- 22.1.1.3. Lancets
- 22.1.2. Continuous Glucose Monitoring
- 22.1.2.1. Sensors
- 22.1.2.2. Durables (Receivers and Transmitters)
- 22.1.1. Self-Monitoring Blood Glucose
- 22.2. Market Analysis, Insights and Forecast - by End User (Revenue and Volume)
- 22.2.1. Hospital/Clinics Usage
- 22.2.2. Self/Home Usage
- 22.3. Market Analysis, Insights and Forecast - by Indicators (Revenue and Volume)
- 22.3.1. Type-1 Diabetes Population
- 22.3.2. Type-2 Diabetes Population
- 22.1. Market Analysis, Insights and Forecast - by Device (Revenue and Volume)
- 23. Brazil Blood Glucose Monitoring Devices Industry Analysis, Insights and Forecast, 2019-2031
- 23.1. Market Analysis, Insights and Forecast - by Device (Revenue and Volume)
- 23.1.1. Self-Monitoring Blood Glucose
- 23.1.1.1. Glucometer Devices
- 23.1.1.2. Test Strips
- 23.1.1.3. Lancets
- 23.1.2. Continuous Glucose Monitoring
- 23.1.2.1. Sensors
- 23.1.2.2. Durables (Receivers and Transmitters)
- 23.1.1. Self-Monitoring Blood Glucose
- 23.2. Market Analysis, Insights and Forecast - by End User (Revenue and Volume)
- 23.2.1. Hospital/Clinics Usage
- 23.2.2. Self/Home Usage
- 23.3. Market Analysis, Insights and Forecast - by Indicators (Revenue and Volume)
- 23.3.1. Type-1 Diabetes Population
- 23.3.2. Type-2 Diabetes Population
- 23.1. Market Analysis, Insights and Forecast - by Device (Revenue and Volume)
- 24. Rest of Latin America Blood Glucose Monitoring Devices Industry Analysis, Insights and Forecast, 2019-2031
- 24.1. Market Analysis, Insights and Forecast - by Device (Revenue and Volume)
- 24.1.1. Self-Monitoring Blood Glucose
- 24.1.1.1. Glucometer Devices
- 24.1.1.2. Test Strips
- 24.1.1.3. Lancets
- 24.1.2. Continuous Glucose Monitoring
- 24.1.2.1. Sensors
- 24.1.2.2. Durables (Receivers and Transmitters)
- 24.1.1. Self-Monitoring Blood Glucose
- 24.2. Market Analysis, Insights and Forecast - by End User (Revenue and Volume)
- 24.2.1. Hospital/Clinics Usage
- 24.2.2. Self/Home Usage
- 24.3. Market Analysis, Insights and Forecast - by Indicators (Revenue and Volume)
- 24.3.1. Type-1 Diabetes Population
- 24.3.2. Type-2 Diabetes Population
- 24.1. Market Analysis, Insights and Forecast - by Device (Revenue and Volume)
- 25. Asia Pacific Blood Glucose Monitoring Devices Industry Analysis, Insights and Forecast, 2019-2031
- 25.1. Market Analysis, Insights and Forecast - by Device (Revenue and Volume)
- 25.1.1. Self-Monitoring Blood Glucose
- 25.1.1.1. Glucometer Devices
- 25.1.1.2. Test Strips
- 25.1.1.3. Lancets
- 25.1.2. Continuous Glucose Monitoring
- 25.1.2.1. Sensors
- 25.1.2.2. Durables (Receivers and Transmitters)
- 25.1.1. Self-Monitoring Blood Glucose
- 25.2. Market Analysis, Insights and Forecast - by End User (Revenue and Volume)
- 25.2.1. Hospital/Clinics Usage
- 25.2.2. Self/Home Usage
- 25.3. Market Analysis, Insights and Forecast - by Indicators (Revenue and Volume)
- 25.3.1. Type-1 Diabetes Population
- 25.3.2. Type-2 Diabetes Population
- 25.1. Market Analysis, Insights and Forecast - by Device (Revenue and Volume)
- 26. By Country Blood Glucose Monitoring Devices Industry Analysis, Insights and Forecast, 2019-2031
- 26.1. Market Analysis, Insights and Forecast - by Device (Revenue and Volume)
- 26.1.1. Self-Monitoring Blood Glucose
- 26.1.1.1. Glucometer Devices
- 26.1.1.2. Test Strips
- 26.1.1.3. Lancets
- 26.1.2. Continuous Glucose Monitoring
- 26.1.2.1. Sensors
- 26.1.2.2. Durables (Receivers and Transmitters)
- 26.1.1. Self-Monitoring Blood Glucose
- 26.2. Market Analysis, Insights and Forecast - by End User (Revenue and Volume)
- 26.2.1. Hospital/Clinics Usage
- 26.2.2. Self/Home Usage
- 26.3. Market Analysis, Insights and Forecast - by Indicators (Revenue and Volume)
- 26.3.1. Type-1 Diabetes Population
- 26.3.2. Type-2 Diabetes Population
- 26.1. Market Analysis, Insights and Forecast - by Device (Revenue and Volume)
- 27. Japan Blood Glucose Monitoring Devices Industry Analysis, Insights and Forecast, 2019-2031
- 27.1. Market Analysis, Insights and Forecast - by Device (Revenue and Volume)
- 27.1.1. Self-Monitoring Blood Glucose
- 27.1.1.1. Glucometer Devices
- 27.1.1.2. Test Strips
- 27.1.1.3. Lancets
- 27.1.2. Continuous Glucose Monitoring
- 27.1.2.1. Sensors
- 27.1.2.2. Durables (Receivers and Transmitters)
- 27.1.1. Self-Monitoring Blood Glucose
- 27.2. Market Analysis, Insights and Forecast - by End User (Revenue and Volume)
- 27.2.1. Hospital/Clinics Usage
- 27.2.2. Self/Home Usage
- 27.3. Market Analysis, Insights and Forecast - by Indicators (Revenue and Volume)
- 27.3.1. Type-1 Diabetes Population
- 27.3.2. Type-2 Diabetes Population
- 27.1. Market Analysis, Insights and Forecast - by Device (Revenue and Volume)
- 28. South Korea Blood Glucose Monitoring Devices Industry Analysis, Insights and Forecast, 2019-2031
- 28.1. Market Analysis, Insights and Forecast - by Device (Revenue and Volume)
- 28.1.1. Self-Monitoring Blood Glucose
- 28.1.1.1. Glucometer Devices
- 28.1.1.2. Test Strips
- 28.1.1.3. Lancets
- 28.1.2. Continuous Glucose Monitoring
- 28.1.2.1. Sensors
- 28.1.2.2. Durables (Receivers and Transmitters)
- 28.1.1. Self-Monitoring Blood Glucose
- 28.2. Market Analysis, Insights and Forecast - by End User (Revenue and Volume)
- 28.2.1. Hospital/Clinics Usage
- 28.2.2. Self/Home Usage
- 28.3. Market Analysis, Insights and Forecast - by Indicators (Revenue and Volume)
- 28.3.1. Type-1 Diabetes Population
- 28.3.2. Type-2 Diabetes Population
- 28.1. Market Analysis, Insights and Forecast - by Device (Revenue and Volume)
- 29. China Blood Glucose Monitoring Devices Industry Analysis, Insights and Forecast, 2019-2031
- 29.1. Market Analysis, Insights and Forecast - by Device (Revenue and Volume)
- 29.1.1. Self-Monitoring Blood Glucose
- 29.1.1.1. Glucometer Devices
- 29.1.1.2. Test Strips
- 29.1.1.3. Lancets
- 29.1.2. Continuous Glucose Monitoring
- 29.1.2.1. Sensors
- 29.1.2.2. Durables (Receivers and Transmitters)
- 29.1.1. Self-Monitoring Blood Glucose
- 29.2. Market Analysis, Insights and Forecast - by End User (Revenue and Volume)
- 29.2.1. Hospital/Clinics Usage
- 29.2.2. Self/Home Usage
- 29.3. Market Analysis, Insights and Forecast - by Indicators (Revenue and Volume)
- 29.3.1. Type-1 Diabetes Population
- 29.3.2. Type-2 Diabetes Population
- 29.1. Market Analysis, Insights and Forecast - by Device (Revenue and Volume)
- 30. India Blood Glucose Monitoring Devices Industry Analysis, Insights and Forecast, 2019-2031
- 30.1. Market Analysis, Insights and Forecast - by Device (Revenue and Volume)
- 30.1.1. Self-Monitoring Blood Glucose
- 30.1.1.1. Glucometer Devices
- 30.1.1.2. Test Strips
- 30.1.1.3. Lancets
- 30.1.2. Continuous Glucose Monitoring
- 30.1.2.1. Sensors
- 30.1.2.2. Durables (Receivers and Transmitters)
- 30.1.1. Self-Monitoring Blood Glucose
- 30.2. Market Analysis, Insights and Forecast - by End User (Revenue and Volume)
- 30.2.1. Hospital/Clinics Usage
- 30.2.2. Self/Home Usage
- 30.3. Market Analysis, Insights and Forecast - by Indicators (Revenue and Volume)
- 30.3.1. Type-1 Diabetes Population
- 30.3.2. Type-2 Diabetes Population
- 30.1. Market Analysis, Insights and Forecast - by Device (Revenue and Volume)
- 31. Australia Blood Glucose Monitoring Devices Industry Analysis, Insights and Forecast, 2019-2031
- 31.1. Market Analysis, Insights and Forecast - by Device (Revenue and Volume)
- 31.1.1. Self-Monitoring Blood Glucose
- 31.1.1.1. Glucometer Devices
- 31.1.1.2. Test Strips
- 31.1.1.3. Lancets
- 31.1.2. Continuous Glucose Monitoring
- 31.1.2.1. Sensors
- 31.1.2.2. Durables (Receivers and Transmitters)
- 31.1.1. Self-Monitoring Blood Glucose
- 31.2. Market Analysis, Insights and Forecast - by End User (Revenue and Volume)
- 31.2.1. Hospital/Clinics Usage
- 31.2.2. Self/Home Usage
- 31.3. Market Analysis, Insights and Forecast - by Indicators (Revenue and Volume)
- 31.3.1. Type-1 Diabetes Population
- 31.3.2. Type-2 Diabetes Population
- 31.1. Market Analysis, Insights and Forecast - by Device (Revenue and Volume)
- 32. Vietnam Blood Glucose Monitoring Devices Industry Analysis, Insights and Forecast, 2019-2031
- 32.1. Market Analysis, Insights and Forecast - by Device (Revenue and Volume)
- 32.1.1. Self-Monitoring Blood Glucose
- 32.1.1.1. Glucometer Devices
- 32.1.1.2. Test Strips
- 32.1.1.3. Lancets
- 32.1.2. Continuous Glucose Monitoring
- 32.1.2.1. Sensors
- 32.1.2.2. Durables (Receivers and Transmitters)
- 32.1.1. Self-Monitoring Blood Glucose
- 32.2. Market Analysis, Insights and Forecast - by End User (Revenue and Volume)
- 32.2.1. Hospital/Clinics Usage
- 32.2.2. Self/Home Usage
- 32.3. Market Analysis, Insights and Forecast - by Indicators (Revenue and Volume)
- 32.3.1. Type-1 Diabetes Population
- 32.3.2. Type-2 Diabetes Population
- 32.1. Market Analysis, Insights and Forecast - by Device (Revenue and Volume)
- 33. Malaysia Blood Glucose Monitoring Devices Industry Analysis, Insights and Forecast, 2019-2031
- 33.1. Market Analysis, Insights and Forecast - by Device (Revenue and Volume)
- 33.1.1. Self-Monitoring Blood Glucose
- 33.1.1.1. Glucometer Devices
- 33.1.1.2. Test Strips
- 33.1.1.3. Lancets
- 33.1.2. Continuous Glucose Monitoring
- 33.1.2.1. Sensors
- 33.1.2.2. Durables (Receivers and Transmitters)
- 33.1.1. Self-Monitoring Blood Glucose
- 33.2. Market Analysis, Insights and Forecast - by End User (Revenue and Volume)
- 33.2.1. Hospital/Clinics Usage
- 33.2.2. Self/Home Usage
- 33.3. Market Analysis, Insights and Forecast - by Indicators (Revenue and Volume)
- 33.3.1. Type-1 Diabetes Population
- 33.3.2. Type-2 Diabetes Population
- 33.1. Market Analysis, Insights and Forecast - by Device (Revenue and Volume)
- 34. Indonesia Blood Glucose Monitoring Devices Industry Analysis, Insights and Forecast, 2019-2031
- 34.1. Market Analysis, Insights and Forecast - by Device (Revenue and Volume)
- 34.1.1. Self-Monitoring Blood Glucose
- 34.1.1.1. Glucometer Devices
- 34.1.1.2. Test Strips
- 34.1.1.3. Lancets
- 34.1.2. Continuous Glucose Monitoring
- 34.1.2.1. Sensors
- 34.1.2.2. Durables (Receivers and Transmitters)
- 34.1.1. Self-Monitoring Blood Glucose
- 34.2. Market Analysis, Insights and Forecast - by End User (Revenue and Volume)
- 34.2.1. Hospital/Clinics Usage
- 34.2.2. Self/Home Usage
- 34.3. Market Analysis, Insights and Forecast - by Indicators (Revenue and Volume)
- 34.3.1. Type-1 Diabetes Population
- 34.3.2. Type-2 Diabetes Population
- 34.1. Market Analysis, Insights and Forecast - by Device (Revenue and Volume)
- 35. Philippines Blood Glucose Monitoring Devices Industry Analysis, Insights and Forecast, 2019-2031
- 35.1. Market Analysis, Insights and Forecast - by Device (Revenue and Volume)
- 35.1.1. Self-Monitoring Blood Glucose
- 35.1.1.1. Glucometer Devices
- 35.1.1.2. Test Strips
- 35.1.1.3. Lancets
- 35.1.2. Continuous Glucose Monitoring
- 35.1.2.1. Sensors
- 35.1.2.2. Durables (Receivers and Transmitters)
- 35.1.1. Self-Monitoring Blood Glucose
- 35.2. Market Analysis, Insights and Forecast - by End User (Revenue and Volume)
- 35.2.1. Hospital/Clinics Usage
- 35.2.2. Self/Home Usage
- 35.3. Market Analysis, Insights and Forecast - by Indicators (Revenue and Volume)
- 35.3.1. Type-1 Diabetes Population
- 35.3.2. Type-2 Diabetes Population
- 35.1. Market Analysis, Insights and Forecast - by Device (Revenue and Volume)
- 36. Thailand Blood Glucose Monitoring Devices Industry Analysis, Insights and Forecast, 2019-2031
- 36.1. Market Analysis, Insights and Forecast - by Device (Revenue and Volume)
- 36.1.1. Self-Monitoring Blood Glucose
- 36.1.1.1. Glucometer Devices
- 36.1.1.2. Test Strips
- 36.1.1.3. Lancets
- 36.1.2. Continuous Glucose Monitoring
- 36.1.2.1. Sensors
- 36.1.2.2. Durables (Receivers and Transmitters)
- 36.1.1. Self-Monitoring Blood Glucose
- 36.2. Market Analysis, Insights and Forecast - by End User (Revenue and Volume)
- 36.2.1. Hospital/Clinics Usage
- 36.2.2. Self/Home Usage
- 36.3. Market Analysis, Insights and Forecast - by Indicators (Revenue and Volume)
- 36.3.1. Type-1 Diabetes Population
- 36.3.2. Type-2 Diabetes Population
- 36.1. Market Analysis, Insights and Forecast - by Device (Revenue and Volume)
- 37. Rest of Asia Pacific Blood Glucose Monitoring Devices Industry Analysis, Insights and Forecast, 2019-2031
- 37.1. Market Analysis, Insights and Forecast - by Device (Revenue and Volume)
- 37.1.1. Self-Monitoring Blood Glucose
- 37.1.1.1. Glucometer Devices
- 37.1.1.2. Test Strips
- 37.1.1.3. Lancets
- 37.1.2. Continuous Glucose Monitoring
- 37.1.2.1. Sensors
- 37.1.2.2. Durables (Receivers and Transmitters)
- 37.1.1. Self-Monitoring Blood Glucose
- 37.2. Market Analysis, Insights and Forecast - by End User (Revenue and Volume)
- 37.2.1. Hospital/Clinics Usage
- 37.2.2. Self/Home Usage
- 37.3. Market Analysis, Insights and Forecast - by Indicators (Revenue and Volume)
- 37.3.1. Type-1 Diabetes Population
- 37.3.2. Type-2 Diabetes Population
- 37.1. Market Analysis, Insights and Forecast - by Device (Revenue and Volume)
- 38. Middle East and Africa Blood Glucose Monitoring Devices Industry Analysis, Insights and Forecast, 2019-2031
- 38.1. Market Analysis, Insights and Forecast - by Device (Revenue and Volume)
- 38.1.1. Self-Monitoring Blood Glucose
- 38.1.1.1. Glucometer Devices
- 38.1.1.2. Test Strips
- 38.1.1.3. Lancets
- 38.1.2. Continuous Glucose Monitoring
- 38.1.2.1. Sensors
- 38.1.2.2. Durables (Receivers and Transmitters)
- 38.1.1. Self-Monitoring Blood Glucose
- 38.2. Market Analysis, Insights and Forecast - by End User (Revenue and Volume)
- 38.2.1. Hospital/Clinics Usage
- 38.2.2. Self/Home Usage
- 38.3. Market Analysis, Insights and Forecast - by Indicators (Revenue and Volume)
- 38.3.1. Type-1 Diabetes Population
- 38.3.2. Type-2 Diabetes Population
- 38.1. Market Analysis, Insights and Forecast - by Device (Revenue and Volume)
- 39. By Country Blood Glucose Monitoring Devices Industry Analysis, Insights and Forecast, 2019-2031
- 39.1. Market Analysis, Insights and Forecast - by Device (Revenue and Volume)
- 39.1.1. Self-Monitoring Blood Glucose
- 39.1.1.1. Glucometer Devices
- 39.1.1.2. Test Strips
- 39.1.1.3. Lancets
- 39.1.2. Continuous Glucose Monitoring
- 39.1.2.1. Sensors
- 39.1.2.2. Durables (Receivers and Transmitters)
- 39.1.1. Self-Monitoring Blood Glucose
- 39.2. Market Analysis, Insights and Forecast - by End User (Revenue and Volume)
- 39.2.1. Hospital/Clinics Usage
- 39.2.2. Self/Home Usage
- 39.3. Market Analysis, Insights and Forecast - by Indicators (Revenue and Volume)
- 39.3.1. Type-1 Diabetes Population
- 39.3.2. Type-2 Diabetes Population
- 39.1. Market Analysis, Insights and Forecast - by Device (Revenue and Volume)
- 40. Saudi Arabia Blood Glucose Monitoring Devices Industry Analysis, Insights and Forecast, 2019-2031
- 40.1. Market Analysis, Insights and Forecast - by Device (Revenue and Volume)
- 40.1.1. Self-Monitoring Blood Glucose
- 40.1.1.1. Glucometer Devices
- 40.1.1.2. Test Strips
- 40.1.1.3. Lancets
- 40.1.2. Continuous Glucose Monitoring
- 40.1.2.1. Sensors
- 40.1.2.2. Durables (Receivers and Transmitters)
- 40.1.1. Self-Monitoring Blood Glucose
- 40.2. Market Analysis, Insights and Forecast - by End User (Revenue and Volume)
- 40.2.1. Hospital/Clinics Usage
- 40.2.2. Self/Home Usage
- 40.3. Market Analysis, Insights and Forecast - by Indicators (Revenue and Volume)
- 40.3.1. Type-1 Diabetes Population
- 40.3.2. Type-2 Diabetes Population
- 40.1. Market Analysis, Insights and Forecast - by Device (Revenue and Volume)
- 41. Iran Blood Glucose Monitoring Devices Industry Analysis, Insights and Forecast, 2019-2031
- 41.1. Market Analysis, Insights and Forecast - by Device (Revenue and Volume)
- 41.1.1. Self-Monitoring Blood Glucose
- 41.1.1.1. Glucometer Devices
- 41.1.1.2. Test Strips
- 41.1.1.3. Lancets
- 41.1.2. Continuous Glucose Monitoring
- 41.1.2.1. Sensors
- 41.1.2.2. Durables (Receivers and Transmitters)
- 41.1.1. Self-Monitoring Blood Glucose
- 41.2. Market Analysis, Insights and Forecast - by End User (Revenue and Volume)
- 41.2.1. Hospital/Clinics Usage
- 41.2.2. Self/Home Usage
- 41.3. Market Analysis, Insights and Forecast - by Indicators (Revenue and Volume)
- 41.3.1. Type-1 Diabetes Population
- 41.3.2. Type-2 Diabetes Population
- 41.1. Market Analysis, Insights and Forecast - by Device (Revenue and Volume)
- 42. Egypt Blood Glucose Monitoring Devices Industry Analysis, Insights and Forecast, 2019-2031
- 42.1. Market Analysis, Insights and Forecast - by Device (Revenue and Volume)
- 42.1.1. Self-Monitoring Blood Glucose
- 42.1.1.1. Glucometer Devices
- 42.1.1.2. Test Strips
- 42.1.1.3. Lancets
- 42.1.2. Continuous Glucose Monitoring
- 42.1.2.1. Sensors
- 42.1.2.2. Durables (Receivers and Transmitters)
- 42.1.1. Self-Monitoring Blood Glucose
- 42.2. Market Analysis, Insights and Forecast - by End User (Revenue and Volume)
- 42.2.1. Hospital/Clinics Usage
- 42.2.2. Self/Home Usage
- 42.3. Market Analysis, Insights and Forecast - by Indicators (Revenue and Volume)
- 42.3.1. Type-1 Diabetes Population
- 42.3.2. Type-2 Diabetes Population
- 42.1. Market Analysis, Insights and Forecast - by Device (Revenue and Volume)
- 43. Oman Blood Glucose Monitoring Devices Industry Analysis, Insights and Forecast, 2019-2031
- 43.1. Market Analysis, Insights and Forecast - by Device (Revenue and Volume)
- 43.1.1. Self-Monitoring Blood Glucose
- 43.1.1.1. Glucometer Devices
- 43.1.1.2. Test Strips
- 43.1.1.3. Lancets
- 43.1.2. Continuous Glucose Monitoring
- 43.1.2.1. Sensors
- 43.1.2.2. Durables (Receivers and Transmitters)
- 43.1.1. Self-Monitoring Blood Glucose
- 43.2. Market Analysis, Insights and Forecast - by End User (Revenue and Volume)
- 43.2.1. Hospital/Clinics Usage
- 43.2.2. Self/Home Usage
- 43.3. Market Analysis, Insights and Forecast - by Indicators (Revenue and Volume)
- 43.3.1. Type-1 Diabetes Population
- 43.3.2. Type-2 Diabetes Population
- 43.1. Market Analysis, Insights and Forecast - by Device (Revenue and Volume)
- 44. South Africa Blood Glucose Monitoring Devices Industry Analysis, Insights and Forecast, 2019-2031
- 44.1. Market Analysis, Insights and Forecast - by Device (Revenue and Volume)
- 44.1.1. Self-Monitoring Blood Glucose
- 44.1.1.1. Glucometer Devices
- 44.1.1.2. Test Strips
- 44.1.1.3. Lancets
- 44.1.2. Continuous Glucose Monitoring
- 44.1.2.1. Sensors
- 44.1.2.2. Durables (Receivers and Transmitters)
- 44.1.1. Self-Monitoring Blood Glucose
- 44.2. Market Analysis, Insights and Forecast - by End User (Revenue and Volume)
- 44.2.1. Hospital/Clinics Usage
- 44.2.2. Self/Home Usage
- 44.3. Market Analysis, Insights and Forecast - by Indicators (Revenue and Volume)
- 44.3.1. Type-1 Diabetes Population
- 44.3.2. Type-2 Diabetes Population
- 44.1. Market Analysis, Insights and Forecast - by Device (Revenue and Volume)
- 45. Rest of Middle East and Africa Blood Glucose Monitoring Devices Industry Analysis, Insights and Forecast, 2019-2031
- 45.1. Market Analysis, Insights and Forecast - by Device (Revenue and Volume)
- 45.1.1. Self-Monitoring Blood Glucose
- 45.1.1.1. Glucometer Devices
- 45.1.1.2. Test Strips
- 45.1.1.3. Lancets
- 45.1.2. Continuous Glucose Monitoring
- 45.1.2.1. Sensors
- 45.1.2.2. Durables (Receivers and Transmitters)
- 45.1.1. Self-Monitoring Blood Glucose
- 45.2. Market Analysis, Insights and Forecast - by End User (Revenue and Volume)
- 45.2.1. Hospital/Clinics Usage
- 45.2.2. Self/Home Usage
- 45.3. Market Analysis, Insights and Forecast - by Indicators (Revenue and Volume)
- 45.3.1. Type-1 Diabetes Population
- 45.3.2. Type-2 Diabetes Population
- 45.1. Market Analysis, Insights and Forecast - by Device (Revenue and Volume)
- 46. North America Blood Glucose Monitoring Devices Industry Analysis, Insights and Forecast, 2019-2031
- 46.1. Market Analysis, Insights and Forecast - By Country/Sub-region
- 46.1.1 United States
- 46.1.2 Canada
- 46.1.3 Mexico
- 47. Europe Blood Glucose Monitoring Devices Industry Analysis, Insights and Forecast, 2019-2031
- 47.1. Market Analysis, Insights and Forecast - By Country/Sub-region
- 47.1.1 Germany
- 47.1.2 United Kingdom
- 47.1.3 France
- 47.1.4 Spain
- 47.1.5 Italy
- 47.1.6 Spain
- 47.1.7 Belgium
- 47.1.8 Netherland
- 47.1.9 Nordics
- 47.1.10 Rest of Europe
- 48. Asia Pacific Blood Glucose Monitoring Devices Industry Analysis, Insights and Forecast, 2019-2031
- 48.1. Market Analysis, Insights and Forecast - By Country/Sub-region
- 48.1.1 China
- 48.1.2 Japan
- 48.1.3 India
- 48.1.4 South Korea
- 48.1.5 Southeast Asia
- 48.1.6 Australia
- 48.1.7 Indonesia
- 48.1.8 Phillipes
- 48.1.9 Singapore
- 48.1.10 Thailandc
- 48.1.11 Rest of Asia Pacific
- 49. South America Blood Glucose Monitoring Devices Industry Analysis, Insights and Forecast, 2019-2031
- 49.1. Market Analysis, Insights and Forecast - By Country/Sub-region
- 49.1.1 Brazil
- 49.1.2 Argentina
- 49.1.3 Peru
- 49.1.4 Chile
- 49.1.5 Colombia
- 49.1.6 Ecuador
- 49.1.7 Venezuela
- 49.1.8 Rest of South America
- 50. North America Blood Glucose Monitoring Devices Industry Analysis, Insights and Forecast, 2019-2031
- 50.1. Market Analysis, Insights and Forecast - By Country/Sub-region
- 50.1.1 United States
- 50.1.2 Canada
- 50.1.3 Mexico
- 51. MEA Blood Glucose Monitoring Devices Industry Analysis, Insights and Forecast, 2019-2031
- 51.1. Market Analysis, Insights and Forecast - By Country/Sub-region
- 51.1.1 United Arab Emirates
- 51.1.2 Saudi Arabia
- 51.1.3 South Africa
- 51.1.4 Rest of Middle East and Africa
- 52. Competitive Analysis
- 52.1. Global Market Share Analysis 2024
- 52.2. Company Profiles
- 52.2.1 Sinocare
- 52.2.1.1. Overview
- 52.2.1.2. Products
- 52.2.1.3. SWOT Analysis
- 52.2.1.4. Recent Developments
- 52.2.1.5. Financials (Based on Availability)
- 52.2.2 Rossmax International Ltd
- 52.2.2.1. Overview
- 52.2.2.2. Products
- 52.2.2.3. SWOT Analysis
- 52.2.2.4. Recent Developments
- 52.2.2.5. Financials (Based on Availability)
- 52.2.3 Trivida Functional Medicine
- 52.2.3.1. Overview
- 52.2.3.2. Products
- 52.2.3.3. SWOT Analysis
- 52.2.3.4. Recent Developments
- 52.2.3.5. Financials (Based on Availability)
- 52.2.4 Abbott Diabetes Care
- 52.2.4.1. Overview
- 52.2.4.2. Products
- 52.2.4.3. SWOT Analysis
- 52.2.4.4. Recent Developments
- 52.2.4.5. Financials (Based on Availability)
- 52.2.5 Self-monitoring Blood Glucose
- 52.2.5.1. Overview
- 52.2.5.2. Products
- 52.2.5.3. SWOT Analysis
- 52.2.5.4. Recent Developments
- 52.2.5.5. Financials (Based on Availability)
- 52.2.6 Dexcom Inc
- 52.2.6.1. Overview
- 52.2.6.2. Products
- 52.2.6.3. SWOT Analysis
- 52.2.6.4. Recent Developments
- 52.2.6.5. Financials (Based on Availability)
- 52.2.7 Continuous Glucose Monitoring Devices
- 52.2.7.1. Overview
- 52.2.7.2. Products
- 52.2.7.3. SWOT Analysis
- 52.2.7.4. Recent Developments
- 52.2.7.5. Financials (Based on Availability)
- 52.2.8 Acon Laboratories Inc
- 52.2.8.1. Overview
- 52.2.8.2. Products
- 52.2.8.3. SWOT Analysis
- 52.2.8.4. Recent Developments
- 52.2.8.5. Financials (Based on Availability)
- 52.2.9 Medtronic PLC
- 52.2.9.1. Overview
- 52.2.9.2. Products
- 52.2.9.3. SWOT Analysis
- 52.2.9.4. Recent Developments
- 52.2.9.5. Financials (Based on Availability)
- 52.2.10 Agamatrix Inc
- 52.2.10.1. Overview
- 52.2.10.2. Products
- 52.2.10.3. SWOT Analysis
- 52.2.10.4. Recent Developments
- 52.2.10.5. Financials (Based on Availability)
- 52.2.11 Medisana AG
- 52.2.11.1. Overview
- 52.2.11.2. Products
- 52.2.11.3. SWOT Analysis
- 52.2.11.4. Recent Developments
- 52.2.11.5. Financials (Based on Availability)
- 52.2.12 Bionime Corporation
- 52.2.12.1. Overview
- 52.2.12.2. Products
- 52.2.12.3. SWOT Analysis
- 52.2.12.4. Recent Developments
- 52.2.12.5. Financials (Based on Availability)
- 52.2.13 LifeScan
- 52.2.13.1. Overview
- 52.2.13.2. Products
- 52.2.13.3. SWOT Analysis
- 52.2.13.4. Recent Developments
- 52.2.13.5. Financials (Based on Availability)
- 52.2.14 Roche Holding AG
- 52.2.14.1. Overview
- 52.2.14.2. Products
- 52.2.14.3. SWOT Analysis
- 52.2.14.4. Recent Developments
- 52.2.14.5. Financials (Based on Availability)
- 52.2.15 Arkray Inc
- 52.2.15.1. Overview
- 52.2.15.2. Products
- 52.2.15.3. SWOT Analysis
- 52.2.15.4. Recent Developments
- 52.2.15.5. Financials (Based on Availability)
- 52.2.16 Ascensia Diabetes Care
- 52.2.16.1. Overview
- 52.2.16.2. Products
- 52.2.16.3. SWOT Analysis
- 52.2.16.4. Recent Developments
- 52.2.16.5. Financials (Based on Availability)
- 52.2.1 Sinocare
List of Figures
- Figure 1: Global Blood Glucose Monitoring Devices Industry Revenue Breakdown (Million, %) by Region 2024 & 2032
- Figure 2: Global Blood Glucose Monitoring Devices Industry Volume Breakdown (K Unit, %) by Region 2024 & 2032
- Figure 3: North America Blood Glucose Monitoring Devices Industry Revenue (Million), by Country 2024 & 2032
- Figure 4: North America Blood Glucose Monitoring Devices Industry Volume (K Unit), by Country 2024 & 2032
- Figure 5: North America Blood Glucose Monitoring Devices Industry Revenue Share (%), by Country 2024 & 2032
- Figure 6: North America Blood Glucose Monitoring Devices Industry Volume Share (%), by Country 2024 & 2032
- Figure 7: Europe Blood Glucose Monitoring Devices Industry Revenue (Million), by Country 2024 & 2032
- Figure 8: Europe Blood Glucose Monitoring Devices Industry Volume (K Unit), by Country 2024 & 2032
- Figure 9: Europe Blood Glucose Monitoring Devices Industry Revenue Share (%), by Country 2024 & 2032
- Figure 10: Europe Blood Glucose Monitoring Devices Industry Volume Share (%), by Country 2024 & 2032
- Figure 11: Asia Pacific Blood Glucose Monitoring Devices Industry Revenue (Million), by Country 2024 & 2032
- Figure 12: Asia Pacific Blood Glucose Monitoring Devices Industry Volume (K Unit), by Country 2024 & 2032
- Figure 13: Asia Pacific Blood Glucose Monitoring Devices Industry Revenue Share (%), by Country 2024 & 2032
- Figure 14: Asia Pacific Blood Glucose Monitoring Devices Industry Volume Share (%), by Country 2024 & 2032
- Figure 15: South America Blood Glucose Monitoring Devices Industry Revenue (Million), by Country 2024 & 2032
- Figure 16: South America Blood Glucose Monitoring Devices Industry Volume (K Unit), by Country 2024 & 2032
- Figure 17: South America Blood Glucose Monitoring Devices Industry Revenue Share (%), by Country 2024 & 2032
- Figure 18: South America Blood Glucose Monitoring Devices Industry Volume Share (%), by Country 2024 & 2032
- Figure 19: North America Blood Glucose Monitoring Devices Industry Revenue (Million), by Country 2024 & 2032
- Figure 20: North America Blood Glucose Monitoring Devices Industry Volume (K Unit), by Country 2024 & 2032
- Figure 21: North America Blood Glucose Monitoring Devices Industry Revenue Share (%), by Country 2024 & 2032
- Figure 22: North America Blood Glucose Monitoring Devices Industry Volume Share (%), by Country 2024 & 2032
- Figure 23: MEA Blood Glucose Monitoring Devices Industry Revenue (Million), by Country 2024 & 2032
- Figure 24: MEA Blood Glucose Monitoring Devices Industry Volume (K Unit), by Country 2024 & 2032
- Figure 25: MEA Blood Glucose Monitoring Devices Industry Revenue Share (%), by Country 2024 & 2032
- Figure 26: MEA Blood Glucose Monitoring Devices Industry Volume Share (%), by Country 2024 & 2032
- Figure 27: North America Blood Glucose Monitoring Devices Industry Revenue (Million), by Device (Revenue and Volume) 2024 & 2032
- Figure 28: North America Blood Glucose Monitoring Devices Industry Volume (K Unit), by Device (Revenue and Volume) 2024 & 2032
- Figure 29: North America Blood Glucose Monitoring Devices Industry Revenue Share (%), by Device (Revenue and Volume) 2024 & 2032
- Figure 30: North America Blood Glucose Monitoring Devices Industry Volume Share (%), by Device (Revenue and Volume) 2024 & 2032
- Figure 31: North America Blood Glucose Monitoring Devices Industry Revenue (Million), by End User (Revenue and Volume) 2024 & 2032
- Figure 32: North America Blood Glucose Monitoring Devices Industry Volume (K Unit), by End User (Revenue and Volume) 2024 & 2032
- Figure 33: North America Blood Glucose Monitoring Devices Industry Revenue Share (%), by End User (Revenue and Volume) 2024 & 2032
- Figure 34: North America Blood Glucose Monitoring Devices Industry Volume Share (%), by End User (Revenue and Volume) 2024 & 2032
- Figure 35: North America Blood Glucose Monitoring Devices Industry Revenue (Million), by Indicators (Revenue and Volume) 2024 & 2032
- Figure 36: North America Blood Glucose Monitoring Devices Industry Volume (K Unit), by Indicators (Revenue and Volume) 2024 & 2032
- Figure 37: North America Blood Glucose Monitoring Devices Industry Revenue Share (%), by Indicators (Revenue and Volume) 2024 & 2032
- Figure 38: North America Blood Glucose Monitoring Devices Industry Volume Share (%), by Indicators (Revenue and Volume) 2024 & 2032
- Figure 39: North America Blood Glucose Monitoring Devices Industry Revenue (Million), by Country 2024 & 2032
- Figure 40: North America Blood Glucose Monitoring Devices Industry Volume (K Unit), by Country 2024 & 2032
- Figure 41: North America Blood Glucose Monitoring Devices Industry Revenue Share (%), by Country 2024 & 2032
- Figure 42: North America Blood Glucose Monitoring Devices Industry Volume Share (%), by Country 2024 & 2032
- Figure 43: By Country Blood Glucose Monitoring Devices Industry Revenue (Million), by Device (Revenue and Volume) 2024 & 2032
- Figure 44: By Country Blood Glucose Monitoring Devices Industry Volume (K Unit), by Device (Revenue and Volume) 2024 & 2032
- Figure 45: By Country Blood Glucose Monitoring Devices Industry Revenue Share (%), by Device (Revenue and Volume) 2024 & 2032
- Figure 46: By Country Blood Glucose Monitoring Devices Industry Volume Share (%), by Device (Revenue and Volume) 2024 & 2032
- Figure 47: By Country Blood Glucose Monitoring Devices Industry Revenue (Million), by End User (Revenue and Volume) 2024 & 2032
- Figure 48: By Country Blood Glucose Monitoring Devices Industry Volume (K Unit), by End User (Revenue and Volume) 2024 & 2032
- Figure 49: By Country Blood Glucose Monitoring Devices Industry Revenue Share (%), by End User (Revenue and Volume) 2024 & 2032
- Figure 50: By Country Blood Glucose Monitoring Devices Industry Volume Share (%), by End User (Revenue and Volume) 2024 & 2032
- Figure 51: By Country Blood Glucose Monitoring Devices Industry Revenue (Million), by Indicators (Revenue and Volume) 2024 & 2032
- Figure 52: By Country Blood Glucose Monitoring Devices Industry Volume (K Unit), by Indicators (Revenue and Volume) 2024 & 2032
- Figure 53: By Country Blood Glucose Monitoring Devices Industry Revenue Share (%), by Indicators (Revenue and Volume) 2024 & 2032
- Figure 54: By Country Blood Glucose Monitoring Devices Industry Volume Share (%), by Indicators (Revenue and Volume) 2024 & 2032
- Figure 55: By Country Blood Glucose Monitoring Devices Industry Revenue (Million), by Country 2024 & 2032
- Figure 56: By Country Blood Glucose Monitoring Devices Industry Volume (K Unit), by Country 2024 & 2032
- Figure 57: By Country Blood Glucose Monitoring Devices Industry Revenue Share (%), by Country 2024 & 2032
- Figure 58: By Country Blood Glucose Monitoring Devices Industry Volume Share (%), by Country 2024 & 2032
- Figure 59: United States Blood Glucose Monitoring Devices Industry Revenue (Million), by Device (Revenue and Volume) 2024 & 2032
- Figure 60: United States Blood Glucose Monitoring Devices Industry Volume (K Unit), by Device (Revenue and Volume) 2024 & 2032
- Figure 61: United States Blood Glucose Monitoring Devices Industry Revenue Share (%), by Device (Revenue and Volume) 2024 & 2032
- Figure 62: United States Blood Glucose Monitoring Devices Industry Volume Share (%), by Device (Revenue and Volume) 2024 & 2032
- Figure 63: United States Blood Glucose Monitoring Devices Industry Revenue (Million), by End User (Revenue and Volume) 2024 & 2032
- Figure 64: United States Blood Glucose Monitoring Devices Industry Volume (K Unit), by End User (Revenue and Volume) 2024 & 2032
- Figure 65: United States Blood Glucose Monitoring Devices Industry Revenue Share (%), by End User (Revenue and Volume) 2024 & 2032
- Figure 66: United States Blood Glucose Monitoring Devices Industry Volume Share (%), by End User (Revenue and Volume) 2024 & 2032
- Figure 67: United States Blood Glucose Monitoring Devices Industry Revenue (Million), by Indicators (Revenue and Volume) 2024 & 2032
- Figure 68: United States Blood Glucose Monitoring Devices Industry Volume (K Unit), by Indicators (Revenue and Volume) 2024 & 2032
- Figure 69: United States Blood Glucose Monitoring Devices Industry Revenue Share (%), by Indicators (Revenue and Volume) 2024 & 2032
- Figure 70: United States Blood Glucose Monitoring Devices Industry Volume Share (%), by Indicators (Revenue and Volume) 2024 & 2032
- Figure 71: United States Blood Glucose Monitoring Devices Industry Revenue (Million), by Country 2024 & 2032
- Figure 72: United States Blood Glucose Monitoring Devices Industry Volume (K Unit), by Country 2024 & 2032
- Figure 73: United States Blood Glucose Monitoring Devices Industry Revenue Share (%), by Country 2024 & 2032
- Figure 74: United States Blood Glucose Monitoring Devices Industry Volume Share (%), by Country 2024 & 2032
- Figure 75: Canada Blood Glucose Monitoring Devices Industry Revenue (Million), by Device (Revenue and Volume) 2024 & 2032
- Figure 76: Canada Blood Glucose Monitoring Devices Industry Volume (K Unit), by Device (Revenue and Volume) 2024 & 2032
- Figure 77: Canada Blood Glucose Monitoring Devices Industry Revenue Share (%), by Device (Revenue and Volume) 2024 & 2032
- Figure 78: Canada Blood Glucose Monitoring Devices Industry Volume Share (%), by Device (Revenue and Volume) 2024 & 2032
- Figure 79: Canada Blood Glucose Monitoring Devices Industry Revenue (Million), by End User (Revenue and Volume) 2024 & 2032
- Figure 80: Canada Blood Glucose Monitoring Devices Industry Volume (K Unit), by End User (Revenue and Volume) 2024 & 2032
- Figure 81: Canada Blood Glucose Monitoring Devices Industry Revenue Share (%), by End User (Revenue and Volume) 2024 & 2032
- Figure 82: Canada Blood Glucose Monitoring Devices Industry Volume Share (%), by End User (Revenue and Volume) 2024 & 2032
- Figure 83: Canada Blood Glucose Monitoring Devices Industry Revenue (Million), by Indicators (Revenue and Volume) 2024 & 2032
- Figure 84: Canada Blood Glucose Monitoring Devices Industry Volume (K Unit), by Indicators (Revenue and Volume) 2024 & 2032
- Figure 85: Canada Blood Glucose Monitoring Devices Industry Revenue Share (%), by Indicators (Revenue and Volume) 2024 & 2032
- Figure 86: Canada Blood Glucose Monitoring Devices Industry Volume Share (%), by Indicators (Revenue and Volume) 2024 & 2032
- Figure 87: Canada Blood Glucose Monitoring Devices Industry Revenue (Million), by Country 2024 & 2032
- Figure 88: Canada Blood Glucose Monitoring Devices Industry Volume (K Unit), by Country 2024 & 2032
- Figure 89: Canada Blood Glucose Monitoring Devices Industry Revenue Share (%), by Country 2024 & 2032
- Figure 90: Canada Blood Glucose Monitoring Devices Industry Volume Share (%), by Country 2024 & 2032
- Figure 91: Rest of North America Blood Glucose Monitoring Devices Industry Revenue (Million), by Device (Revenue and Volume) 2024 & 2032
- Figure 92: Rest of North America Blood Glucose Monitoring Devices Industry Volume (K Unit), by Device (Revenue and Volume) 2024 & 2032
- Figure 93: Rest of North America Blood Glucose Monitoring Devices Industry Revenue Share (%), by Device (Revenue and Volume) 2024 & 2032
- Figure 94: Rest of North America Blood Glucose Monitoring Devices Industry Volume Share (%), by Device (Revenue and Volume) 2024 & 2032
- Figure 95: Rest of North America Blood Glucose Monitoring Devices Industry Revenue (Million), by End User (Revenue and Volume) 2024 & 2032
- Figure 96: Rest of North America Blood Glucose Monitoring Devices Industry Volume (K Unit), by End User (Revenue and Volume) 2024 & 2032
- Figure 97: Rest of North America Blood Glucose Monitoring Devices Industry Revenue Share (%), by End User (Revenue and Volume) 2024 & 2032
- Figure 98: Rest of North America Blood Glucose Monitoring Devices Industry Volume Share (%), by End User (Revenue and Volume) 2024 & 2032
- Figure 99: Rest of North America Blood Glucose Monitoring Devices Industry Revenue (Million), by Indicators (Revenue and Volume) 2024 & 2032
- Figure 100: Rest of North America Blood Glucose Monitoring Devices Industry Volume (K Unit), by Indicators (Revenue and Volume) 2024 & 2032
- Figure 101: Rest of North America Blood Glucose Monitoring Devices Industry Revenue Share (%), by Indicators (Revenue and Volume) 2024 & 2032
- Figure 102: Rest of North America Blood Glucose Monitoring Devices Industry Volume Share (%), by Indicators (Revenue and Volume) 2024 & 2032
- Figure 103: Rest of North America Blood Glucose Monitoring Devices Industry Revenue (Million), by Country 2024 & 2032
- Figure 104: Rest of North America Blood Glucose Monitoring Devices Industry Volume (K Unit), by Country 2024 & 2032
- Figure 105: Rest of North America Blood Glucose Monitoring Devices Industry Revenue Share (%), by Country 2024 & 2032
- Figure 106: Rest of North America Blood Glucose Monitoring Devices Industry Volume Share (%), by Country 2024 & 2032
- Figure 107: Europe Blood Glucose Monitoring Devices Industry Revenue (Million), by Device (Revenue and Volume) 2024 & 2032
- Figure 108: Europe Blood Glucose Monitoring Devices Industry Volume (K Unit), by Device (Revenue and Volume) 2024 & 2032
- Figure 109: Europe Blood Glucose Monitoring Devices Industry Revenue Share (%), by Device (Revenue and Volume) 2024 & 2032
- Figure 110: Europe Blood Glucose Monitoring Devices Industry Volume Share (%), by Device (Revenue and Volume) 2024 & 2032
- Figure 111: Europe Blood Glucose Monitoring Devices Industry Revenue (Million), by End User (Revenue and Volume) 2024 & 2032
- Figure 112: Europe Blood Glucose Monitoring Devices Industry Volume (K Unit), by End User (Revenue and Volume) 2024 & 2032
- Figure 113: Europe Blood Glucose Monitoring Devices Industry Revenue Share (%), by End User (Revenue and Volume) 2024 & 2032
- Figure 114: Europe Blood Glucose Monitoring Devices Industry Volume Share (%), by End User (Revenue and Volume) 2024 & 2032
- Figure 115: Europe Blood Glucose Monitoring Devices Industry Revenue (Million), by Indicators (Revenue and Volume) 2024 & 2032
- Figure 116: Europe Blood Glucose Monitoring Devices Industry Volume (K Unit), by Indicators (Revenue and Volume) 2024 & 2032
- Figure 117: Europe Blood Glucose Monitoring Devices Industry Revenue Share (%), by Indicators (Revenue and Volume) 2024 & 2032
- Figure 118: Europe Blood Glucose Monitoring Devices Industry Volume Share (%), by Indicators (Revenue and Volume) 2024 & 2032
- Figure 119: Europe Blood Glucose Monitoring Devices Industry Revenue (Million), by Country 2024 & 2032
- Figure 120: Europe Blood Glucose Monitoring Devices Industry Volume (K Unit), by Country 2024 & 2032
- Figure 121: Europe Blood Glucose Monitoring Devices Industry Revenue Share (%), by Country 2024 & 2032
- Figure 122: Europe Blood Glucose Monitoring Devices Industry Volume Share (%), by Country 2024 & 2032
- Figure 123: By Country Blood Glucose Monitoring Devices Industry Revenue (Million), by Device (Revenue and Volume) 2024 & 2032
- Figure 124: By Country Blood Glucose Monitoring Devices Industry Volume (K Unit), by Device (Revenue and Volume) 2024 & 2032
- Figure 125: By Country Blood Glucose Monitoring Devices Industry Revenue Share (%), by Device (Revenue and Volume) 2024 & 2032
- Figure 126: By Country Blood Glucose Monitoring Devices Industry Volume Share (%), by Device (Revenue and Volume) 2024 & 2032
- Figure 127: By Country Blood Glucose Monitoring Devices Industry Revenue (Million), by End User (Revenue and Volume) 2024 & 2032
- Figure 128: By Country Blood Glucose Monitoring Devices Industry Volume (K Unit), by End User (Revenue and Volume) 2024 & 2032
- Figure 129: By Country Blood Glucose Monitoring Devices Industry Revenue Share (%), by End User (Revenue and Volume) 2024 & 2032
- Figure 130: By Country Blood Glucose Monitoring Devices Industry Volume Share (%), by End User (Revenue and Volume) 2024 & 2032
- Figure 131: By Country Blood Glucose Monitoring Devices Industry Revenue (Million), by Indicators (Revenue and Volume) 2024 & 2032
- Figure 132: By Country Blood Glucose Monitoring Devices Industry Volume (K Unit), by Indicators (Revenue and Volume) 2024 & 2032
- Figure 133: By Country Blood Glucose Monitoring Devices Industry Revenue Share (%), by Indicators (Revenue and Volume) 2024 & 2032
- Figure 134: By Country Blood Glucose Monitoring Devices Industry Volume Share (%), by Indicators (Revenue and Volume) 2024 & 2032
- Figure 135: By Country Blood Glucose Monitoring Devices Industry Revenue (Million), by Country 2024 & 2032
- Figure 136: By Country Blood Glucose Monitoring Devices Industry Volume (K Unit), by Country 2024 & 2032
- Figure 137: By Country Blood Glucose Monitoring Devices Industry Revenue Share (%), by Country 2024 & 2032
- Figure 138: By Country Blood Glucose Monitoring Devices Industry Volume Share (%), by Country 2024 & 2032
- Figure 139: France Blood Glucose Monitoring Devices Industry Revenue (Million), by Device (Revenue and Volume) 2024 & 2032
- Figure 140: France Blood Glucose Monitoring Devices Industry Volume (K Unit), by Device (Revenue and Volume) 2024 & 2032
- Figure 141: France Blood Glucose Monitoring Devices Industry Revenue Share (%), by Device (Revenue and Volume) 2024 & 2032
- Figure 142: France Blood Glucose Monitoring Devices Industry Volume Share (%), by Device (Revenue and Volume) 2024 & 2032
- Figure 143: France Blood Glucose Monitoring Devices Industry Revenue (Million), by End User (Revenue and Volume) 2024 & 2032
- Figure 144: France Blood Glucose Monitoring Devices Industry Volume (K Unit), by End User (Revenue and Volume) 2024 & 2032
- Figure 145: France Blood Glucose Monitoring Devices Industry Revenue Share (%), by End User (Revenue and Volume) 2024 & 2032
- Figure 146: France Blood Glucose Monitoring Devices Industry Volume Share (%), by End User (Revenue and Volume) 2024 & 2032
- Figure 147: France Blood Glucose Monitoring Devices Industry Revenue (Million), by Indicators (Revenue and Volume) 2024 & 2032
- Figure 148: France Blood Glucose Monitoring Devices Industry Volume (K Unit), by Indicators (Revenue and Volume) 2024 & 2032
- Figure 149: France Blood Glucose Monitoring Devices Industry Revenue Share (%), by Indicators (Revenue and Volume) 2024 & 2032
- Figure 150: France Blood Glucose Monitoring Devices Industry Volume Share (%), by Indicators (Revenue and Volume) 2024 & 2032
- Figure 151: France Blood Glucose Monitoring Devices Industry Revenue (Million), by Country 2024 & 2032
- Figure 152: France Blood Glucose Monitoring Devices Industry Volume (K Unit), by Country 2024 & 2032
- Figure 153: France Blood Glucose Monitoring Devices Industry Revenue Share (%), by Country 2024 & 2032
- Figure 154: France Blood Glucose Monitoring Devices Industry Volume Share (%), by Country 2024 & 2032
- Figure 155: Germany Blood Glucose Monitoring Devices Industry Revenue (Million), by Device (Revenue and Volume) 2024 & 2032
- Figure 156: Germany Blood Glucose Monitoring Devices Industry Volume (K Unit), by Device (Revenue and Volume) 2024 & 2032
- Figure 157: Germany Blood Glucose Monitoring Devices Industry Revenue Share (%), by Device (Revenue and Volume) 2024 & 2032
- Figure 158: Germany Blood Glucose Monitoring Devices Industry Volume Share (%), by Device (Revenue and Volume) 2024 & 2032
- Figure 159: Germany Blood Glucose Monitoring Devices Industry Revenue (Million), by End User (Revenue and Volume) 2024 & 2032
- Figure 160: Germany Blood Glucose Monitoring Devices Industry Volume (K Unit), by End User (Revenue and Volume) 2024 & 2032
- Figure 161: Germany Blood Glucose Monitoring Devices Industry Revenue Share (%), by End User (Revenue and Volume) 2024 & 2032
- Figure 162: Germany Blood Glucose Monitoring Devices Industry Volume Share (%), by End User (Revenue and Volume) 2024 & 2032
- Figure 163: Germany Blood Glucose Monitoring Devices Industry Revenue (Million), by Indicators (Revenue and Volume) 2024 & 2032
- Figure 164: Germany Blood Glucose Monitoring Devices Industry Volume (K Unit), by Indicators (Revenue and Volume) 2024 & 2032
- Figure 165: Germany Blood Glucose Monitoring Devices Industry Revenue Share (%), by Indicators (Revenue and Volume) 2024 & 2032
- Figure 166: Germany Blood Glucose Monitoring Devices Industry Volume Share (%), by Indicators (Revenue and Volume) 2024 & 2032
- Figure 167: Germany Blood Glucose Monitoring Devices Industry Revenue (Million), by Country 2024 & 2032
- Figure 168: Germany Blood Glucose Monitoring Devices Industry Volume (K Unit), by Country 2024 & 2032
- Figure 169: Germany Blood Glucose Monitoring Devices Industry Revenue Share (%), by Country 2024 & 2032
- Figure 170: Germany Blood Glucose Monitoring Devices Industry Volume Share (%), by Country 2024 & 2032
- Figure 171: Italy Blood Glucose Monitoring Devices Industry Revenue (Million), by Device (Revenue and Volume) 2024 & 2032
- Figure 172: Italy Blood Glucose Monitoring Devices Industry Volume (K Unit), by Device (Revenue and Volume) 2024 & 2032
- Figure 173: Italy Blood Glucose Monitoring Devices Industry Revenue Share (%), by Device (Revenue and Volume) 2024 & 2032
- Figure 174: Italy Blood Glucose Monitoring Devices Industry Volume Share (%), by Device (Revenue and Volume) 2024 & 2032
- Figure 175: Italy Blood Glucose Monitoring Devices Industry Revenue (Million), by End User (Revenue and Volume) 2024 & 2032
- Figure 176: Italy Blood Glucose Monitoring Devices Industry Volume (K Unit), by End User (Revenue and Volume) 2024 & 2032
- Figure 177: Italy Blood Glucose Monitoring Devices Industry Revenue Share (%), by End User (Revenue and Volume) 2024 & 2032
- Figure 178: Italy Blood Glucose Monitoring Devices Industry Volume Share (%), by End User (Revenue and Volume) 2024 & 2032
- Figure 179: Italy Blood Glucose Monitoring Devices Industry Revenue (Million), by Indicators (Revenue and Volume) 2024 & 2032
- Figure 180: Italy Blood Glucose Monitoring Devices Industry Volume (K Unit), by Indicators (Revenue and Volume) 2024 & 2032
- Figure 181: Italy Blood Glucose Monitoring Devices Industry Revenue Share (%), by Indicators (Revenue and Volume) 2024 & 2032
- Figure 182: Italy Blood Glucose Monitoring Devices Industry Volume Share (%), by Indicators (Revenue and Volume) 2024 & 2032
- Figure 183: Italy Blood Glucose Monitoring Devices Industry Revenue (Million), by Country 2024 & 2032
- Figure 184: Italy Blood Glucose Monitoring Devices Industry Volume (K Unit), by Country 2024 & 2032
- Figure 185: Italy Blood Glucose Monitoring Devices Industry Revenue Share (%), by Country 2024 & 2032
- Figure 186: Italy Blood Glucose Monitoring Devices Industry Volume Share (%), by Country 2024 & 2032
- Figure 187: Spain Blood Glucose Monitoring Devices Industry Revenue (Million), by Device (Revenue and Volume) 2024 & 2032
- Figure 188: Spain Blood Glucose Monitoring Devices Industry Volume (K Unit), by Device (Revenue and Volume) 2024 & 2032
- Figure 189: Spain Blood Glucose Monitoring Devices Industry Revenue Share (%), by Device (Revenue and Volume) 2024 & 2032
- Figure 190: Spain Blood Glucose Monitoring Devices Industry Volume Share (%), by Device (Revenue and Volume) 2024 & 2032
- Figure 191: Spain Blood Glucose Monitoring Devices Industry Revenue (Million), by End User (Revenue and Volume) 2024 & 2032
- Figure 192: Spain Blood Glucose Monitoring Devices Industry Volume (K Unit), by End User (Revenue and Volume) 2024 & 2032
- Figure 193: Spain Blood Glucose Monitoring Devices Industry Revenue Share (%), by End User (Revenue and Volume) 2024 & 2032
- Figure 194: Spain Blood Glucose Monitoring Devices Industry Volume Share (%), by End User (Revenue and Volume) 2024 & 2032
- Figure 195: Spain Blood Glucose Monitoring Devices Industry Revenue (Million), by Indicators (Revenue and Volume) 2024 & 2032
- Figure 196: Spain Blood Glucose Monitoring Devices Industry Volume (K Unit), by Indicators (Revenue and Volume) 2024 & 2032
- Figure 197: Spain Blood Glucose Monitoring Devices Industry Revenue Share (%), by Indicators (Revenue and Volume) 2024 & 2032
- Figure 198: Spain Blood Glucose Monitoring Devices Industry Volume Share (%), by Indicators (Revenue and Volume) 2024 & 2032
- Figure 199: Spain Blood Glucose Monitoring Devices Industry Revenue (Million), by Country 2024 & 2032
- Figure 200: Spain Blood Glucose Monitoring Devices Industry Volume (K Unit), by Country 2024 & 2032
- Figure 201: Spain Blood Glucose Monitoring Devices Industry Revenue Share (%), by Country 2024 & 2032
- Figure 202: Spain Blood Glucose Monitoring Devices Industry Volume Share (%), by Country 2024 & 2032
- Figure 203: United Kingdom Blood Glucose Monitoring Devices Industry Revenue (Million), by Device (Revenue and Volume) 2024 & 2032
- Figure 204: United Kingdom Blood Glucose Monitoring Devices Industry Volume (K Unit), by Device (Revenue and Volume) 2024 & 2032
- Figure 205: United Kingdom Blood Glucose Monitoring Devices Industry Revenue Share (%), by Device (Revenue and Volume) 2024 & 2032
- Figure 206: United Kingdom Blood Glucose Monitoring Devices Industry Volume Share (%), by Device (Revenue and Volume) 2024 & 2032
- Figure 207: United Kingdom Blood Glucose Monitoring Devices Industry Revenue (Million), by End User (Revenue and Volume) 2024 & 2032
- Figure 208: United Kingdom Blood Glucose Monitoring Devices Industry Volume (K Unit), by End User (Revenue and Volume) 2024 & 2032
- Figure 209: United Kingdom Blood Glucose Monitoring Devices Industry Revenue Share (%), by End User (Revenue and Volume) 2024 & 2032
- Figure 210: United Kingdom Blood Glucose Monitoring Devices Industry Volume Share (%), by End User (Revenue and Volume) 2024 & 2032
- Figure 211: United Kingdom Blood Glucose Monitoring Devices Industry Revenue (Million), by Indicators (Revenue and Volume) 2024 & 2032
- Figure 212: United Kingdom Blood Glucose Monitoring Devices Industry Volume (K Unit), by Indicators (Revenue and Volume) 2024 & 2032
- Figure 213: United Kingdom Blood Glucose Monitoring Devices Industry Revenue Share (%), by Indicators (Revenue and Volume) 2024 & 2032
- Figure 214: United Kingdom Blood Glucose Monitoring Devices Industry Volume Share (%), by Indicators (Revenue and Volume) 2024 & 2032
- Figure 215: United Kingdom Blood Glucose Monitoring Devices Industry Revenue (Million), by Country 2024 & 2032
- Figure 216: United Kingdom Blood Glucose Monitoring Devices Industry Volume (K Unit), by Country 2024 & 2032
- Figure 217: United Kingdom Blood Glucose Monitoring Devices Industry Revenue Share (%), by Country 2024 & 2032
- Figure 218: United Kingdom Blood Glucose Monitoring Devices Industry Volume Share (%), by Country 2024 & 2032
- Figure 219: Russia Blood Glucose Monitoring Devices Industry Revenue (Million), by Device (Revenue and Volume) 2024 & 2032
- Figure 220: Russia Blood Glucose Monitoring Devices Industry Volume (K Unit), by Device (Revenue and Volume) 2024 & 2032
- Figure 221: Russia Blood Glucose Monitoring Devices Industry Revenue Share (%), by Device (Revenue and Volume) 2024 & 2032
- Figure 222: Russia Blood Glucose Monitoring Devices Industry Volume Share (%), by Device (Revenue and Volume) 2024 & 2032
- Figure 223: Russia Blood Glucose Monitoring Devices Industry Revenue (Million), by End User (Revenue and Volume) 2024 & 2032
- Figure 224: Russia Blood Glucose Monitoring Devices Industry Volume (K Unit), by End User (Revenue and Volume) 2024 & 2032
- Figure 225: Russia Blood Glucose Monitoring Devices Industry Revenue Share (%), by End User (Revenue and Volume) 2024 & 2032
- Figure 226: Russia Blood Glucose Monitoring Devices Industry Volume Share (%), by End User (Revenue and Volume) 2024 & 2032
- Figure 227: Russia Blood Glucose Monitoring Devices Industry Revenue (Million), by Indicators (Revenue and Volume) 2024 & 2032
- Figure 228: Russia Blood Glucose Monitoring Devices Industry Volume (K Unit), by Indicators (Revenue and Volume) 2024 & 2032
- Figure 229: Russia Blood Glucose Monitoring Devices Industry Revenue Share (%), by Indicators (Revenue and Volume) 2024 & 2032
- Figure 230: Russia Blood Glucose Monitoring Devices Industry Volume Share (%), by Indicators (Revenue and Volume) 2024 & 2032
- Figure 231: Russia Blood Glucose Monitoring Devices Industry Revenue (Million), by Country 2024 & 2032
- Figure 232: Russia Blood Glucose Monitoring Devices Industry Volume (K Unit), by Country 2024 & 2032
- Figure 233: Russia Blood Glucose Monitoring Devices Industry Revenue Share (%), by Country 2024 & 2032
- Figure 234: Russia Blood Glucose Monitoring Devices Industry Volume Share (%), by Country 2024 & 2032
- Figure 235: Rest of Europe Blood Glucose Monitoring Devices Industry Revenue (Million), by Device (Revenue and Volume) 2024 & 2032
- Figure 236: Rest of Europe Blood Glucose Monitoring Devices Industry Volume (K Unit), by Device (Revenue and Volume) 2024 & 2032
- Figure 237: Rest of Europe Blood Glucose Monitoring Devices Industry Revenue Share (%), by Device (Revenue and Volume) 2024 & 2032
- Figure 238: Rest of Europe Blood Glucose Monitoring Devices Industry Volume Share (%), by Device (Revenue and Volume) 2024 & 2032
- Figure 239: Rest of Europe Blood Glucose Monitoring Devices Industry Revenue (Million), by End User (Revenue and Volume) 2024 & 2032
- Figure 240: Rest of Europe Blood Glucose Monitoring Devices Industry Volume (K Unit), by End User (Revenue and Volume) 2024 & 2032
- Figure 241: Rest of Europe Blood Glucose Monitoring Devices Industry Revenue Share (%), by End User (Revenue and Volume) 2024 & 2032
- Figure 242: Rest of Europe Blood Glucose Monitoring Devices Industry Volume Share (%), by End User (Revenue and Volume) 2024 & 2032
- Figure 243: Rest of Europe Blood Glucose Monitoring Devices Industry Revenue (Million), by Indicators (Revenue and Volume) 2024 & 2032
- Figure 244: Rest of Europe Blood Glucose Monitoring Devices Industry Volume (K Unit), by Indicators (Revenue and Volume) 2024 & 2032
- Figure 245: Rest of Europe Blood Glucose Monitoring Devices Industry Revenue Share (%), by Indicators (Revenue and Volume) 2024 & 2032
- Figure 246: Rest of Europe Blood Glucose Monitoring Devices Industry Volume Share (%), by Indicators (Revenue and Volume) 2024 & 2032
- Figure 247: Rest of Europe Blood Glucose Monitoring Devices Industry Revenue (Million), by Country 2024 & 2032
- Figure 248: Rest of Europe Blood Glucose Monitoring Devices Industry Volume (K Unit), by Country 2024 & 2032
- Figure 249: Rest of Europe Blood Glucose Monitoring Devices Industry Revenue Share (%), by Country 2024 & 2032
- Figure 250: Rest of Europe Blood Glucose Monitoring Devices Industry Volume Share (%), by Country 2024 & 2032
- Figure 251: Latin America Blood Glucose Monitoring Devices Industry Revenue (Million), by Device (Revenue and Volume) 2024 & 2032
- Figure 252: Latin America Blood Glucose Monitoring Devices Industry Volume (K Unit), by Device (Revenue and Volume) 2024 & 2032
- Figure 253: Latin America Blood Glucose Monitoring Devices Industry Revenue Share (%), by Device (Revenue and Volume) 2024 & 2032
- Figure 254: Latin America Blood Glucose Monitoring Devices Industry Volume Share (%), by Device (Revenue and Volume) 2024 & 2032
- Figure 255: Latin America Blood Glucose Monitoring Devices Industry Revenue (Million), by End User (Revenue and Volume) 2024 & 2032
- Figure 256: Latin America Blood Glucose Monitoring Devices Industry Volume (K Unit), by End User (Revenue and Volume) 2024 & 2032
- Figure 257: Latin America Blood Glucose Monitoring Devices Industry Revenue Share (%), by End User (Revenue and Volume) 2024 & 2032
- Figure 258: Latin America Blood Glucose Monitoring Devices Industry Volume Share (%), by End User (Revenue and Volume) 2024 & 2032
- Figure 259: Latin America Blood Glucose Monitoring Devices Industry Revenue (Million), by Indicators (Revenue and Volume) 2024 & 2032
- Figure 260: Latin America Blood Glucose Monitoring Devices Industry Volume (K Unit), by Indicators (Revenue and Volume) 2024 & 2032
- Figure 261: Latin America Blood Glucose Monitoring Devices Industry Revenue Share (%), by Indicators (Revenue and Volume) 2024 & 2032
- Figure 262: Latin America Blood Glucose Monitoring Devices Industry Volume Share (%), by Indicators (Revenue and Volume) 2024 & 2032
- Figure 263: Latin America Blood Glucose Monitoring Devices Industry Revenue (Million), by Country 2024 & 2032
- Figure 264: Latin America Blood Glucose Monitoring Devices Industry Volume (K Unit), by Country 2024 & 2032
- Figure 265: Latin America Blood Glucose Monitoring Devices Industry Revenue Share (%), by Country 2024 & 2032
- Figure 266: Latin America Blood Glucose Monitoring Devices Industry Volume Share (%), by Country 2024 & 2032
- Figure 267: By Country Blood Glucose Monitoring Devices Industry Revenue (Million), by Device (Revenue and Volume) 2024 & 2032
- Figure 268: By Country Blood Glucose Monitoring Devices Industry Volume (K Unit), by Device (Revenue and Volume) 2024 & 2032
- Figure 269: By Country Blood Glucose Monitoring Devices Industry Revenue Share (%), by Device (Revenue and Volume) 2024 & 2032
- Figure 270: By Country Blood Glucose Monitoring Devices Industry Volume Share (%), by Device (Revenue and Volume) 2024 & 2032
- Figure 271: By Country Blood Glucose Monitoring Devices Industry Revenue (Million), by End User (Revenue and Volume) 2024 & 2032
- Figure 272: By Country Blood Glucose Monitoring Devices Industry Volume (K Unit), by End User (Revenue and Volume) 2024 & 2032
- Figure 273: By Country Blood Glucose Monitoring Devices Industry Revenue Share (%), by End User (Revenue and Volume) 2024 & 2032
- Figure 274: By Country Blood Glucose Monitoring Devices Industry Volume Share (%), by End User (Revenue and Volume) 2024 & 2032
- Figure 275: By Country Blood Glucose Monitoring Devices Industry Revenue (Million), by Indicators (Revenue and Volume) 2024 & 2032
- Figure 276: By Country Blood Glucose Monitoring Devices Industry Volume (K Unit), by Indicators (Revenue and Volume) 2024 & 2032
- Figure 277: By Country Blood Glucose Monitoring Devices Industry Revenue Share (%), by Indicators (Revenue and Volume) 2024 & 2032
- Figure 278: By Country Blood Glucose Monitoring Devices Industry Volume Share (%), by Indicators (Revenue and Volume) 2024 & 2032
- Figure 279: By Country Blood Glucose Monitoring Devices Industry Revenue (Million), by Country 2024 & 2032
- Figure 280: By Country Blood Glucose Monitoring Devices Industry Volume (K Unit), by Country 2024 & 2032
- Figure 281: By Country Blood Glucose Monitoring Devices Industry Revenue Share (%), by Country 2024 & 2032
- Figure 282: By Country Blood Glucose Monitoring Devices Industry Volume Share (%), by Country 2024 & 2032
- Figure 283: Mexico Blood Glucose Monitoring Devices Industry Revenue (Million), by Device (Revenue and Volume) 2024 & 2032
- Figure 284: Mexico Blood Glucose Monitoring Devices Industry Volume (K Unit), by Device (Revenue and Volume) 2024 & 2032
- Figure 285: Mexico Blood Glucose Monitoring Devices Industry Revenue Share (%), by Device (Revenue and Volume) 2024 & 2032
- Figure 286: Mexico Blood Glucose Monitoring Devices Industry Volume Share (%), by Device (Revenue and Volume) 2024 & 2032
- Figure 287: Mexico Blood Glucose Monitoring Devices Industry Revenue (Million), by End User (Revenue and Volume) 2024 & 2032
- Figure 288: Mexico Blood Glucose Monitoring Devices Industry Volume (K Unit), by End User (Revenue and Volume) 2024 & 2032
- Figure 289: Mexico Blood Glucose Monitoring Devices Industry Revenue Share (%), by End User (Revenue and Volume) 2024 & 2032
- Figure 290: Mexico Blood Glucose Monitoring Devices Industry Volume Share (%), by End User (Revenue and Volume) 2024 & 2032
- Figure 291: Mexico Blood Glucose Monitoring Devices Industry Revenue (Million), by Indicators (Revenue and Volume) 2024 & 2032
- Figure 292: Mexico Blood Glucose Monitoring Devices Industry Volume (K Unit), by Indicators (Revenue and Volume) 2024 & 2032
- Figure 293: Mexico Blood Glucose Monitoring Devices Industry Revenue Share (%), by Indicators (Revenue and Volume) 2024 & 2032
- Figure 294: Mexico Blood Glucose Monitoring Devices Industry Volume Share (%), by Indicators (Revenue and Volume) 2024 & 2032
- Figure 295: Mexico Blood Glucose Monitoring Devices Industry Revenue (Million), by Country 2024 & 2032
- Figure 296: Mexico Blood Glucose Monitoring Devices Industry Volume (K Unit), by Country 2024 & 2032
- Figure 297: Mexico Blood Glucose Monitoring Devices Industry Revenue Share (%), by Country 2024 & 2032
- Figure 298: Mexico Blood Glucose Monitoring Devices Industry Volume Share (%), by Country 2024 & 2032
- Figure 299: Brazil Blood Glucose Monitoring Devices Industry Revenue (Million), by Device (Revenue and Volume) 2024 & 2032
- Figure 300: Brazil Blood Glucose Monitoring Devices Industry Volume (K Unit), by Device (Revenue and Volume) 2024 & 2032
- Figure 301: Brazil Blood Glucose Monitoring Devices Industry Revenue Share (%), by Device (Revenue and Volume) 2024 & 2032
- Figure 302: Brazil Blood Glucose Monitoring Devices Industry Volume Share (%), by Device (Revenue and Volume) 2024 & 2032
- Figure 303: Brazil Blood Glucose Monitoring Devices Industry Revenue (Million), by End User (Revenue and Volume) 2024 & 2032
- Figure 304: Brazil Blood Glucose Monitoring Devices Industry Volume (K Unit), by End User (Revenue and Volume) 2024 & 2032
- Figure 305: Brazil Blood Glucose Monitoring Devices Industry Revenue Share (%), by End User (Revenue and Volume) 2024 & 2032
- Figure 306: Brazil Blood Glucose Monitoring Devices Industry Volume Share (%), by End User (Revenue and Volume) 2024 & 2032
- Figure 307: Brazil Blood Glucose Monitoring Devices Industry Revenue (Million), by Indicators (Revenue and Volume) 2024 & 2032
- Figure 308: Brazil Blood Glucose Monitoring Devices Industry Volume (K Unit), by Indicators (Revenue and Volume) 2024 & 2032
- Figure 309: Brazil Blood Glucose Monitoring Devices Industry Revenue Share (%), by Indicators (Revenue and Volume) 2024 & 2032
- Figure 310: Brazil Blood Glucose Monitoring Devices Industry Volume Share (%), by Indicators (Revenue and Volume) 2024 & 2032
- Figure 311: Brazil Blood Glucose Monitoring Devices Industry Revenue (Million), by Country 2024 & 2032
- Figure 312: Brazil Blood Glucose Monitoring Devices Industry Volume (K Unit), by Country 2024 & 2032
- Figure 313: Brazil Blood Glucose Monitoring Devices Industry Revenue Share (%), by Country 2024 & 2032
- Figure 314: Brazil Blood Glucose Monitoring Devices Industry Volume Share (%), by Country 2024 & 2032
- Figure 315: Rest of Latin America Blood Glucose Monitoring Devices Industry Revenue (Million), by Device (Revenue and Volume) 2024 & 2032
- Figure 316: Rest of Latin America Blood Glucose Monitoring Devices Industry Volume (K Unit), by Device (Revenue and Volume) 2024 & 2032
- Figure 317: Rest of Latin America Blood Glucose Monitoring Devices Industry Revenue Share (%), by Device (Revenue and Volume) 2024 & 2032
- Figure 318: Rest of Latin America Blood Glucose Monitoring Devices Industry Volume Share (%), by Device (Revenue and Volume) 2024 & 2032
- Figure 319: Rest of Latin America Blood Glucose Monitoring Devices Industry Revenue (Million), by End User (Revenue and Volume) 2024 & 2032
- Figure 320: Rest of Latin America Blood Glucose Monitoring Devices Industry Volume (K Unit), by End User (Revenue and Volume) 2024 & 2032
- Figure 321: Rest of Latin America Blood Glucose Monitoring Devices Industry Revenue Share (%), by End User (Revenue and Volume) 2024 & 2032
- Figure 322: Rest of Latin America Blood Glucose Monitoring Devices Industry Volume Share (%), by End User (Revenue and Volume) 2024 & 2032
- Figure 323: Rest of Latin America Blood Glucose Monitoring Devices Industry Revenue (Million), by Indicators (Revenue and Volume) 2024 & 2032
- Figure 324: Rest of Latin America Blood Glucose Monitoring Devices Industry Volume (K Unit), by Indicators (Revenue and Volume) 2024 & 2032
- Figure 325: Rest of Latin America Blood Glucose Monitoring Devices Industry Revenue Share (%), by Indicators (Revenue and Volume) 2024 & 2032
- Figure 326: Rest of Latin America Blood Glucose Monitoring Devices Industry Volume Share (%), by Indicators (Revenue and Volume) 2024 & 2032
- Figure 327: Rest of Latin America Blood Glucose Monitoring Devices Industry Revenue (Million), by Country 2024 & 2032
- Figure 328: Rest of Latin America Blood Glucose Monitoring Devices Industry Volume (K Unit), by Country 2024 & 2032
- Figure 329: Rest of Latin America Blood Glucose Monitoring Devices Industry Revenue Share (%), by Country 2024 & 2032
- Figure 330: Rest of Latin America Blood Glucose Monitoring Devices Industry Volume Share (%), by Country 2024 & 2032
- Figure 331: Asia Pacific Blood Glucose Monitoring Devices Industry Revenue (Million), by Device (Revenue and Volume) 2024 & 2032
- Figure 332: Asia Pacific Blood Glucose Monitoring Devices Industry Volume (K Unit), by Device (Revenue and Volume) 2024 & 2032
- Figure 333: Asia Pacific Blood Glucose Monitoring Devices Industry Revenue Share (%), by Device (Revenue and Volume) 2024 & 2032
- Figure 334: Asia Pacific Blood Glucose Monitoring Devices Industry Volume Share (%), by Device (Revenue and Volume) 2024 & 2032
- Figure 335: Asia Pacific Blood Glucose Monitoring Devices Industry Revenue (Million), by End User (Revenue and Volume) 2024 & 2032
- Figure 336: Asia Pacific Blood Glucose Monitoring Devices Industry Volume (K Unit), by End User (Revenue and Volume) 2024 & 2032
- Figure 337: Asia Pacific Blood Glucose Monitoring Devices Industry Revenue Share (%), by End User (Revenue and Volume) 2024 & 2032
- Figure 338: Asia Pacific Blood Glucose Monitoring Devices Industry Volume Share (%), by End User (Revenue and Volume) 2024 & 2032
- Figure 339: Asia Pacific Blood Glucose Monitoring Devices Industry Revenue (Million), by Indicators (Revenue and Volume) 2024 & 2032
- Figure 340: Asia Pacific Blood Glucose Monitoring Devices Industry Volume (K Unit), by Indicators (Revenue and Volume) 2024 & 2032
- Figure 341: Asia Pacific Blood Glucose Monitoring Devices Industry Revenue Share (%), by Indicators (Revenue and Volume) 2024 & 2032
- Figure 342: Asia Pacific Blood Glucose Monitoring Devices Industry Volume Share (%), by Indicators (Revenue and Volume) 2024 & 2032
- Figure 343: Asia Pacific Blood Glucose Monitoring Devices Industry Revenue (Million), by Country 2024 & 2032
- Figure 344: Asia Pacific Blood Glucose Monitoring Devices Industry Volume (K Unit), by Country 2024 & 2032
- Figure 345: Asia Pacific Blood Glucose Monitoring Devices Industry Revenue Share (%), by Country 2024 & 2032
- Figure 346: Asia Pacific Blood Glucose Monitoring Devices Industry Volume Share (%), by Country 2024 & 2032
- Figure 347: By Country Blood Glucose Monitoring Devices Industry Revenue (Million), by Device (Revenue and Volume) 2024 & 2032
- Figure 348: By Country Blood Glucose Monitoring Devices Industry Volume (K Unit), by Device (Revenue and Volume) 2024 & 2032
- Figure 349: By Country Blood Glucose Monitoring Devices Industry Revenue Share (%), by Device (Revenue and Volume) 2024 & 2032
- Figure 350: By Country Blood Glucose Monitoring Devices Industry Volume Share (%), by Device (Revenue and Volume) 2024 & 2032
- Figure 351: By Country Blood Glucose Monitoring Devices Industry Revenue (Million), by End User (Revenue and Volume) 2024 & 2032
- Figure 352: By Country Blood Glucose Monitoring Devices Industry Volume (K Unit), by End User (Revenue and Volume) 2024 & 2032
- Figure 353: By Country Blood Glucose Monitoring Devices Industry Revenue Share (%), by End User (Revenue and Volume) 2024 & 2032
- Figure 354: By Country Blood Glucose Monitoring Devices Industry Volume Share (%), by End User (Revenue and Volume) 2024 & 2032
- Figure 355: By Country Blood Glucose Monitoring Devices Industry Revenue (Million), by Indicators (Revenue and Volume) 2024 & 2032
- Figure 356: By Country Blood Glucose Monitoring Devices Industry Volume (K Unit), by Indicators (Revenue and Volume) 2024 & 2032
- Figure 357: By Country Blood Glucose Monitoring Devices Industry Revenue Share (%), by Indicators (Revenue and Volume) 2024 & 2032
- Figure 358: By Country Blood Glucose Monitoring Devices Industry Volume Share (%), by Indicators (Revenue and Volume) 2024 & 2032
- Figure 359: By Country Blood Glucose Monitoring Devices Industry Revenue (Million), by Country 2024 & 2032
- Figure 360: By Country Blood Glucose Monitoring Devices Industry Volume (K Unit), by Country 2024 & 2032
- Figure 361: By Country Blood Glucose Monitoring Devices Industry Revenue Share (%), by Country 2024 & 2032
- Figure 362: By Country Blood Glucose Monitoring Devices Industry Volume Share (%), by Country 2024 & 2032
- Figure 363: Japan Blood Glucose Monitoring Devices Industry Revenue (Million), by Device (Revenue and Volume) 2024 & 2032
- Figure 364: Japan Blood Glucose Monitoring Devices Industry Volume (K Unit), by Device (Revenue and Volume) 2024 & 2032
- Figure 365: Japan Blood Glucose Monitoring Devices Industry Revenue Share (%), by Device (Revenue and Volume) 2024 & 2032
- Figure 366: Japan Blood Glucose Monitoring Devices Industry Volume Share (%), by Device (Revenue and Volume) 2024 & 2032
- Figure 367: Japan Blood Glucose Monitoring Devices Industry Revenue (Million), by End User (Revenue and Volume) 2024 & 2032
- Figure 368: Japan Blood Glucose Monitoring Devices Industry Volume (K Unit), by End User (Revenue and Volume) 2024 & 2032
- Figure 369: Japan Blood Glucose Monitoring Devices Industry Revenue Share (%), by End User (Revenue and Volume) 2024 & 2032
- Figure 370: Japan Blood Glucose Monitoring Devices Industry Volume Share (%), by End User (Revenue and Volume) 2024 & 2032
- Figure 371: Japan Blood Glucose Monitoring Devices Industry Revenue (Million), by Indicators (Revenue and Volume) 2024 & 2032
- Figure 372: Japan Blood Glucose Monitoring Devices Industry Volume (K Unit), by Indicators (Revenue and Volume) 2024 & 2032
- Figure 373: Japan Blood Glucose Monitoring Devices Industry Revenue Share (%), by Indicators (Revenue and Volume) 2024 & 2032
- Figure 374: Japan Blood Glucose Monitoring Devices Industry Volume Share (%), by Indicators (Revenue and Volume) 2024 & 2032
- Figure 375: Japan Blood Glucose Monitoring Devices Industry Revenue (Million), by Country 2024 & 2032
- Figure 376: Japan Blood Glucose Monitoring Devices Industry Volume (K Unit), by Country 2024 & 2032
- Figure 377: Japan Blood Glucose Monitoring Devices Industry Revenue Share (%), by Country 2024 & 2032
- Figure 378: Japan Blood Glucose Monitoring Devices Industry Volume Share (%), by Country 2024 & 2032
- Figure 379: South Korea Blood Glucose Monitoring Devices Industry Revenue (Million), by Device (Revenue and Volume) 2024 & 2032
- Figure 380: South Korea Blood Glucose Monitoring Devices Industry Volume (K Unit), by Device (Revenue and Volume) 2024 & 2032
- Figure 381: South Korea Blood Glucose Monitoring Devices Industry Revenue Share (%), by Device (Revenue and Volume) 2024 & 2032
- Figure 382: South Korea Blood Glucose Monitoring Devices Industry Volume Share (%), by Device (Revenue and Volume) 2024 & 2032
- Figure 383: South Korea Blood Glucose Monitoring Devices Industry Revenue (Million), by End User (Revenue and Volume) 2024 & 2032
- Figure 384: South Korea Blood Glucose Monitoring Devices Industry Volume (K Unit), by End User (Revenue and Volume) 2024 & 2032
- Figure 385: South Korea Blood Glucose Monitoring Devices Industry Revenue Share (%), by End User (Revenue and Volume) 2024 & 2032
- Figure 386: South Korea Blood Glucose Monitoring Devices Industry Volume Share (%), by End User (Revenue and Volume) 2024 & 2032
- Figure 387: South Korea Blood Glucose Monitoring Devices Industry Revenue (Million), by Indicators (Revenue and Volume) 2024 & 2032
- Figure 388: South Korea Blood Glucose Monitoring Devices Industry Volume (K Unit), by Indicators (Revenue and Volume) 2024 & 2032
- Figure 389: South Korea Blood Glucose Monitoring Devices Industry Revenue Share (%), by Indicators (Revenue and Volume) 2024 & 2032
- Figure 390: South Korea Blood Glucose Monitoring Devices Industry Volume Share (%), by Indicators (Revenue and Volume) 2024 & 2032
- Figure 391: South Korea Blood Glucose Monitoring Devices Industry Revenue (Million), by Country 2024 & 2032
- Figure 392: South Korea Blood Glucose Monitoring Devices Industry Volume (K Unit), by Country 2024 & 2032
- Figure 393: South Korea Blood Glucose Monitoring Devices Industry Revenue Share (%), by Country 2024 & 2032
- Figure 394: South Korea Blood Glucose Monitoring Devices Industry Volume Share (%), by Country 2024 & 2032
- Figure 395: China Blood Glucose Monitoring Devices Industry Revenue (Million), by Device (Revenue and Volume) 2024 & 2032
- Figure 396: China Blood Glucose Monitoring Devices Industry Volume (K Unit), by Device (Revenue and Volume) 2024 & 2032
- Figure 397: China Blood Glucose Monitoring Devices Industry Revenue Share (%), by Device (Revenue and Volume) 2024 & 2032
- Figure 398: China Blood Glucose Monitoring Devices Industry Volume Share (%), by Device (Revenue and Volume) 2024 & 2032
- Figure 399: China Blood Glucose Monitoring Devices Industry Revenue (Million), by End User (Revenue and Volume) 2024 & 2032
- Figure 400: China Blood Glucose Monitoring Devices Industry Volume (K Unit), by End User (Revenue and Volume) 2024 & 2032
- Figure 401: China Blood Glucose Monitoring Devices Industry Revenue Share (%), by End User (Revenue and Volume) 2024 & 2032
- Figure 402: China Blood Glucose Monitoring Devices Industry Volume Share (%), by End User (Revenue and Volume) 2024 & 2032
- Figure 403: China Blood Glucose Monitoring Devices Industry Revenue (Million), by Indicators (Revenue and Volume) 2024 & 2032
- Figure 404: China Blood Glucose Monitoring Devices Industry Volume (K Unit), by Indicators (Revenue and Volume) 2024 & 2032
- Figure 405: China Blood Glucose Monitoring Devices Industry Revenue Share (%), by Indicators (Revenue and Volume) 2024 & 2032
- Figure 406: China Blood Glucose Monitoring Devices Industry Volume Share (%), by Indicators (Revenue and Volume) 2024 & 2032
- Figure 407: China Blood Glucose Monitoring Devices Industry Revenue (Million), by Country 2024 & 2032
- Figure 408: China Blood Glucose Monitoring Devices Industry Volume (K Unit), by Country 2024 & 2032
- Figure 409: China Blood Glucose Monitoring Devices Industry Revenue Share (%), by Country 2024 & 2032
- Figure 410: China Blood Glucose Monitoring Devices Industry Volume Share (%), by Country 2024 & 2032
- Figure 411: India Blood Glucose Monitoring Devices Industry Revenue (Million), by Device (Revenue and Volume) 2024 & 2032
- Figure 412: India Blood Glucose Monitoring Devices Industry Volume (K Unit), by Device (Revenue and Volume) 2024 & 2032
- Figure 413: India Blood Glucose Monitoring Devices Industry Revenue Share (%), by Device (Revenue and Volume) 2024 & 2032
- Figure 414: India Blood Glucose Monitoring Devices Industry Volume Share (%), by Device (Revenue and Volume) 2024 & 2032
- Figure 415: India Blood Glucose Monitoring Devices Industry Revenue (Million), by End User (Revenue and Volume) 2024 & 2032
- Figure 416: India Blood Glucose Monitoring Devices Industry Volume (K Unit), by End User (Revenue and Volume) 2024 & 2032
- Figure 417: India Blood Glucose Monitoring Devices Industry Revenue Share (%), by End User (Revenue and Volume) 2024 & 2032
- Figure 418: India Blood Glucose Monitoring Devices Industry Volume Share (%), by End User (Revenue and Volume) 2024 & 2032
- Figure 419: India Blood Glucose Monitoring Devices Industry Revenue (Million), by Indicators (Revenue and Volume) 2024 & 2032
- Figure 420: India Blood Glucose Monitoring Devices Industry Volume (K Unit), by Indicators (Revenue and Volume) 2024 & 2032
- Figure 421: India Blood Glucose Monitoring Devices Industry Revenue Share (%), by Indicators (Revenue and Volume) 2024 & 2032
- Figure 422: India Blood Glucose Monitoring Devices Industry Volume Share (%), by Indicators (Revenue and Volume) 2024 & 2032
- Figure 423: India Blood Glucose Monitoring Devices Industry Revenue (Million), by Country 2024 & 2032
- Figure 424: India Blood Glucose Monitoring Devices Industry Volume (K Unit), by Country 2024 & 2032
- Figure 425: India Blood Glucose Monitoring Devices Industry Revenue Share (%), by Country 2024 & 2032
- Figure 426: India Blood Glucose Monitoring Devices Industry Volume Share (%), by Country 2024 & 2032
- Figure 427: Australia Blood Glucose Monitoring Devices Industry Revenue (Million), by Device (Revenue and Volume) 2024 & 2032
- Figure 428: Australia Blood Glucose Monitoring Devices Industry Volume (K Unit), by Device (Revenue and Volume) 2024 & 2032
- Figure 429: Australia Blood Glucose Monitoring Devices Industry Revenue Share (%), by Device (Revenue and Volume) 2024 & 2032
- Figure 430: Australia Blood Glucose Monitoring Devices Industry Volume Share (%), by Device (Revenue and Volume) 2024 & 2032
- Figure 431: Australia Blood Glucose Monitoring Devices Industry Revenue (Million), by End User (Revenue and Volume) 2024 & 2032
- Figure 432: Australia Blood Glucose Monitoring Devices Industry Volume (K Unit), by End User (Revenue and Volume) 2024 & 2032
- Figure 433: Australia Blood Glucose Monitoring Devices Industry Revenue Share (%), by End User (Revenue and Volume) 2024 & 2032
- Figure 434: Australia Blood Glucose Monitoring Devices Industry Volume Share (%), by End User (Revenue and Volume) 2024 & 2032
- Figure 435: Australia Blood Glucose Monitoring Devices Industry Revenue (Million), by Indicators (Revenue and Volume) 2024 & 2032
- Figure 436: Australia Blood Glucose Monitoring Devices Industry Volume (K Unit), by Indicators (Revenue and Volume) 2024 & 2032
- Figure 437: Australia Blood Glucose Monitoring Devices Industry Revenue Share (%), by Indicators (Revenue and Volume) 2024 & 2032
- Figure 438: Australia Blood Glucose Monitoring Devices Industry Volume Share (%), by Indicators (Revenue and Volume) 2024 & 2032
- Figure 439: Australia Blood Glucose Monitoring Devices Industry Revenue (Million), by Country 2024 & 2032
- Figure 440: Australia Blood Glucose Monitoring Devices Industry Volume (K Unit), by Country 2024 & 2032
- Figure 441: Australia Blood Glucose Monitoring Devices Industry Revenue Share (%), by Country 2024 & 2032
- Figure 442: Australia Blood Glucose Monitoring Devices Industry Volume Share (%), by Country 2024 & 2032
- Figure 443: Vietnam Blood Glucose Monitoring Devices Industry Revenue (Million), by Device (Revenue and Volume) 2024 & 2032
- Figure 444: Vietnam Blood Glucose Monitoring Devices Industry Volume (K Unit), by Device (Revenue and Volume) 2024 & 2032
- Figure 445: Vietnam Blood Glucose Monitoring Devices Industry Revenue Share (%), by Device (Revenue and Volume) 2024 & 2032
- Figure 446: Vietnam Blood Glucose Monitoring Devices Industry Volume Share (%), by Device (Revenue and Volume) 2024 & 2032
- Figure 447: Vietnam Blood Glucose Monitoring Devices Industry Revenue (Million), by End User (Revenue and Volume) 2024 & 2032
- Figure 448: Vietnam Blood Glucose Monitoring Devices Industry Volume (K Unit), by End User (Revenue and Volume) 2024 & 2032
- Figure 449: Vietnam Blood Glucose Monitoring Devices Industry Revenue Share (%), by End User (Revenue and Volume) 2024 & 2032
- Figure 450: Vietnam Blood Glucose Monitoring Devices Industry Volume Share (%), by End User (Revenue and Volume) 2024 & 2032
- Figure 451: Vietnam Blood Glucose Monitoring Devices Industry Revenue (Million), by Indicators (Revenue and Volume) 2024 & 2032
- Figure 452: Vietnam Blood Glucose Monitoring Devices Industry Volume (K Unit), by Indicators (Revenue and Volume) 2024 & 2032
- Figure 453: Vietnam Blood Glucose Monitoring Devices Industry Revenue Share (%), by Indicators (Revenue and Volume) 2024 & 2032
- Figure 454: Vietnam Blood Glucose Monitoring Devices Industry Volume Share (%), by Indicators (Revenue and Volume) 2024 & 2032
- Figure 455: Vietnam Blood Glucose Monitoring Devices Industry Revenue (Million), by Country 2024 & 2032
- Figure 456: Vietnam Blood Glucose Monitoring Devices Industry Volume (K Unit), by Country 2024 & 2032
- Figure 457: Vietnam Blood Glucose Monitoring Devices Industry Revenue Share (%), by Country 2024 & 2032
- Figure 458: Vietnam Blood Glucose Monitoring Devices Industry Volume Share (%), by Country 2024 & 2032
- Figure 459: Malaysia Blood Glucose Monitoring Devices Industry Revenue (Million), by Device (Revenue and Volume) 2024 & 2032
- Figure 460: Malaysia Blood Glucose Monitoring Devices Industry Volume (K Unit), by Device (Revenue and Volume) 2024 & 2032
- Figure 461: Malaysia Blood Glucose Monitoring Devices Industry Revenue Share (%), by Device (Revenue and Volume) 2024 & 2032
- Figure 462: Malaysia Blood Glucose Monitoring Devices Industry Volume Share (%), by Device (Revenue and Volume) 2024 & 2032
- Figure 463: Malaysia Blood Glucose Monitoring Devices Industry Revenue (Million), by End User (Revenue and Volume) 2024 & 2032
- Figure 464: Malaysia Blood Glucose Monitoring Devices Industry Volume (K Unit), by End User (Revenue and Volume) 2024 & 2032
- Figure 465: Malaysia Blood Glucose Monitoring Devices Industry Revenue Share (%), by End User (Revenue and Volume) 2024 & 2032
- Figure 466: Malaysia Blood Glucose Monitoring Devices Industry Volume Share (%), by End User (Revenue and Volume) 2024 & 2032
- Figure 467: Malaysia Blood Glucose Monitoring Devices Industry Revenue (Million), by Indicators (Revenue and Volume) 2024 & 2032
- Figure 468: Malaysia Blood Glucose Monitoring Devices Industry Volume (K Unit), by Indicators (Revenue and Volume) 2024 & 2032
- Figure 469: Malaysia Blood Glucose Monitoring Devices Industry Revenue Share (%), by Indicators (Revenue and Volume) 2024 & 2032
- Figure 470: Malaysia Blood Glucose Monitoring Devices Industry Volume Share (%), by Indicators (Revenue and Volume) 2024 & 2032
- Figure 471: Malaysia Blood Glucose Monitoring Devices Industry Revenue (Million), by Country 2024 & 2032
- Figure 472: Malaysia Blood Glucose Monitoring Devices Industry Volume (K Unit), by Country 2024 & 2032
- Figure 473: Malaysia Blood Glucose Monitoring Devices Industry Revenue Share (%), by Country 2024 & 2032
- Figure 474: Malaysia Blood Glucose Monitoring Devices Industry Volume Share (%), by Country 2024 & 2032
- Figure 475: Indonesia Blood Glucose Monitoring Devices Industry Revenue (Million), by Device (Revenue and Volume) 2024 & 2032
- Figure 476: Indonesia Blood Glucose Monitoring Devices Industry Volume (K Unit), by Device (Revenue and Volume) 2024 & 2032
- Figure 477: Indonesia Blood Glucose Monitoring Devices Industry Revenue Share (%), by Device (Revenue and Volume) 2024 & 2032
- Figure 478: Indonesia Blood Glucose Monitoring Devices Industry Volume Share (%), by Device (Revenue and Volume) 2024 & 2032
- Figure 479: Indonesia Blood Glucose Monitoring Devices Industry Revenue (Million), by End User (Revenue and Volume) 2024 & 2032
- Figure 480: Indonesia Blood Glucose Monitoring Devices Industry Volume (K Unit), by End User (Revenue and Volume) 2024 & 2032
- Figure 481: Indonesia Blood Glucose Monitoring Devices Industry Revenue Share (%), by End User (Revenue and Volume) 2024 & 2032
- Figure 482: Indonesia Blood Glucose Monitoring Devices Industry Volume Share (%), by End User (Revenue and Volume) 2024 & 2032
- Figure 483: Indonesia Blood Glucose Monitoring Devices Industry Revenue (Million), by Indicators (Revenue and Volume) 2024 & 2032
- Figure 484: Indonesia Blood Glucose Monitoring Devices Industry Volume (K Unit), by Indicators (Revenue and Volume) 2024 & 2032
- Figure 485: Indonesia Blood Glucose Monitoring Devices Industry Revenue Share (%), by Indicators (Revenue and Volume) 2024 & 2032
- Figure 486: Indonesia Blood Glucose Monitoring Devices Industry Volume Share (%), by Indicators (Revenue and Volume) 2024 & 2032
- Figure 487: Indonesia Blood Glucose Monitoring Devices Industry Revenue (Million), by Country 2024 & 2032
- Figure 488: Indonesia Blood Glucose Monitoring Devices Industry Volume (K Unit), by Country 2024 & 2032
- Figure 489: Indonesia Blood Glucose Monitoring Devices Industry Revenue Share (%), by Country 2024 & 2032
- Figure 490: Indonesia Blood Glucose Monitoring Devices Industry Volume Share (%), by Country 2024 & 2032
- Figure 491: Philippines Blood Glucose Monitoring Devices Industry Revenue (Million), by Device (Revenue and Volume) 2024 & 2032
- Figure 492: Philippines Blood Glucose Monitoring Devices Industry Volume (K Unit), by Device (Revenue and Volume) 2024 & 2032
- Figure 493: Philippines Blood Glucose Monitoring Devices Industry Revenue Share (%), by Device (Revenue and Volume) 2024 & 2032
- Figure 494: Philippines Blood Glucose Monitoring Devices Industry Volume Share (%), by Device (Revenue and Volume) 2024 & 2032
- Figure 495: Philippines Blood Glucose Monitoring Devices Industry Revenue (Million), by End User (Revenue and Volume) 2024 & 2032
- Figure 496: Philippines Blood Glucose Monitoring Devices Industry Volume (K Unit), by End User (Revenue and Volume) 2024 & 2032
- Figure 497: Philippines Blood Glucose Monitoring Devices Industry Revenue Share (%), by End User (Revenue and Volume) 2024 & 2032
- Figure 498: Philippines Blood Glucose Monitoring Devices Industry Volume Share (%), by End User (Revenue and Volume) 2024 & 2032
- Figure 499: Philippines Blood Glucose Monitoring Devices Industry Revenue (Million), by Indicators (Revenue and Volume) 2024 & 2032
- Figure 500: Philippines Blood Glucose Monitoring Devices Industry Volume (K Unit), by Indicators (Revenue and Volume) 2024 & 2032
- Figure 501: Philippines Blood Glucose Monitoring Devices Industry Revenue Share (%), by Indicators (Revenue and Volume) 2024 & 2032
- Figure 502: Philippines Blood Glucose Monitoring Devices Industry Volume Share (%), by Indicators (Revenue and Volume) 2024 & 2032
- Figure 503: Philippines Blood Glucose Monitoring Devices Industry Revenue (Million), by Country 2024 & 2032
- Figure 504: Philippines Blood Glucose Monitoring Devices Industry Volume (K Unit), by Country 2024 & 2032
- Figure 505: Philippines Blood Glucose Monitoring Devices Industry Revenue Share (%), by Country 2024 & 2032
- Figure 506: Philippines Blood Glucose Monitoring Devices Industry Volume Share (%), by Country 2024 & 2032
- Figure 507: Thailand Blood Glucose Monitoring Devices Industry Revenue (Million), by Device (Revenue and Volume) 2024 & 2032
- Figure 508: Thailand Blood Glucose Monitoring Devices Industry Volume (K Unit), by Device (Revenue and Volume) 2024 & 2032
- Figure 509: Thailand Blood Glucose Monitoring Devices Industry Revenue Share (%), by Device (Revenue and Volume) 2024 & 2032
- Figure 510: Thailand Blood Glucose Monitoring Devices Industry Volume Share (%), by Device (Revenue and Volume) 2024 & 2032
- Figure 511: Thailand Blood Glucose Monitoring Devices Industry Revenue (Million), by End User (Revenue and Volume) 2024 & 2032
- Figure 512: Thailand Blood Glucose Monitoring Devices Industry Volume (K Unit), by End User (Revenue and Volume) 2024 & 2032
- Figure 513: Thailand Blood Glucose Monitoring Devices Industry Revenue Share (%), by End User (Revenue and Volume) 2024 & 2032
- Figure 514: Thailand Blood Glucose Monitoring Devices Industry Volume Share (%), by End User (Revenue and Volume) 2024 & 2032
- Figure 515: Thailand Blood Glucose Monitoring Devices Industry Revenue (Million), by Indicators (Revenue and Volume) 2024 & 2032
- Figure 516: Thailand Blood Glucose Monitoring Devices Industry Volume (K Unit), by Indicators (Revenue and Volume) 2024 & 2032
- Figure 517: Thailand Blood Glucose Monitoring Devices Industry Revenue Share (%), by Indicators (Revenue and Volume) 2024 & 2032
- Figure 518: Thailand Blood Glucose Monitoring Devices Industry Volume Share (%), by Indicators (Revenue and Volume) 2024 & 2032
- Figure 519: Thailand Blood Glucose Monitoring Devices Industry Revenue (Million), by Country 2024 & 2032
- Figure 520: Thailand Blood Glucose Monitoring Devices Industry Volume (K Unit), by Country 2024 & 2032
- Figure 521: Thailand Blood Glucose Monitoring Devices Industry Revenue Share (%), by Country 2024 & 2032
- Figure 522: Thailand Blood Glucose Monitoring Devices Industry Volume Share (%), by Country 2024 & 2032
- Figure 523: Rest of Asia Pacific Blood Glucose Monitoring Devices Industry Revenue (Million), by Device (Revenue and Volume) 2024 & 2032
- Figure 524: Rest of Asia Pacific Blood Glucose Monitoring Devices Industry Volume (K Unit), by Device (Revenue and Volume) 2024 & 2032
- Figure 525: Rest of Asia Pacific Blood Glucose Monitoring Devices Industry Revenue Share (%), by Device (Revenue and Volume) 2024 & 2032
- Figure 526: Rest of Asia Pacific Blood Glucose Monitoring Devices Industry Volume Share (%), by Device (Revenue and Volume) 2024 & 2032
- Figure 527: Rest of Asia Pacific Blood Glucose Monitoring Devices Industry Revenue (Million), by End User (Revenue and Volume) 2024 & 2032
- Figure 528: Rest of Asia Pacific Blood Glucose Monitoring Devices Industry Volume (K Unit), by End User (Revenue and Volume) 2024 & 2032
- Figure 529: Rest of Asia Pacific Blood Glucose Monitoring Devices Industry Revenue Share (%), by End User (Revenue and Volume) 2024 & 2032
- Figure 530: Rest of Asia Pacific Blood Glucose Monitoring Devices Industry Volume Share (%), by End User (Revenue and Volume) 2024 & 2032
- Figure 531: Rest of Asia Pacific Blood Glucose Monitoring Devices Industry Revenue (Million), by Indicators (Revenue and Volume) 2024 & 2032
- Figure 532: Rest of Asia Pacific Blood Glucose Monitoring Devices Industry Volume (K Unit), by Indicators (Revenue and Volume) 2024 & 2032
- Figure 533: Rest of Asia Pacific Blood Glucose Monitoring Devices Industry Revenue Share (%), by Indicators (Revenue and Volume) 2024 & 2032
- Figure 534: Rest of Asia Pacific Blood Glucose Monitoring Devices Industry Volume Share (%), by Indicators (Revenue and Volume) 2024 & 2032
- Figure 535: Rest of Asia Pacific Blood Glucose Monitoring Devices Industry Revenue (Million), by Country 2024 & 2032
- Figure 536: Rest of Asia Pacific Blood Glucose Monitoring Devices Industry Volume (K Unit), by Country 2024 & 2032
- Figure 537: Rest of Asia Pacific Blood Glucose Monitoring Devices Industry Revenue Share (%), by Country 2024 & 2032
- Figure 538: Rest of Asia Pacific Blood Glucose Monitoring Devices Industry Volume Share (%), by Country 2024 & 2032
- Figure 539: Middle East and Africa Blood Glucose Monitoring Devices Industry Revenue (Million), by Device (Revenue and Volume) 2024 & 2032
- Figure 540: Middle East and Africa Blood Glucose Monitoring Devices Industry Volume (K Unit), by Device (Revenue and Volume) 2024 & 2032
- Figure 541: Middle East and Africa Blood Glucose Monitoring Devices Industry Revenue Share (%), by Device (Revenue and Volume) 2024 & 2032
- Figure 542: Middle East and Africa Blood Glucose Monitoring Devices Industry Volume Share (%), by Device (Revenue and Volume) 2024 & 2032
- Figure 543: Middle East and Africa Blood Glucose Monitoring Devices Industry Revenue (Million), by End User (Revenue and Volume) 2024 & 2032
- Figure 544: Middle East and Africa Blood Glucose Monitoring Devices Industry Volume (K Unit), by End User (Revenue and Volume) 2024 & 2032
- Figure 545: Middle East and Africa Blood Glucose Monitoring Devices Industry Revenue Share (%), by End User (Revenue and Volume) 2024 & 2032
- Figure 546: Middle East and Africa Blood Glucose Monitoring Devices Industry Volume Share (%), by End User (Revenue and Volume) 2024 & 2032
- Figure 547: Middle East and Africa Blood Glucose Monitoring Devices Industry Revenue (Million), by Indicators (Revenue and Volume) 2024 & 2032
- Figure 548: Middle East and Africa Blood Glucose Monitoring Devices Industry Volume (K Unit), by Indicators (Revenue and Volume) 2024 & 2032
- Figure 549: Middle East and Africa Blood Glucose Monitoring Devices Industry Revenue Share (%), by Indicators (Revenue and Volume) 2024 & 2032
- Figure 550: Middle East and Africa Blood Glucose Monitoring Devices Industry Volume Share (%), by Indicators (Revenue and Volume) 2024 & 2032
- Figure 551: Middle East and Africa Blood Glucose Monitoring Devices Industry Revenue (Million), by Country 2024 & 2032
- Figure 552: Middle East and Africa Blood Glucose Monitoring Devices Industry Volume (K Unit), by Country 2024 & 2032
- Figure 553: Middle East and Africa Blood Glucose Monitoring Devices Industry Revenue Share (%), by Country 2024 & 2032
- Figure 554: Middle East and Africa Blood Glucose Monitoring Devices Industry Volume Share (%), by Country 2024 & 2032
- Figure 555: By Country Blood Glucose Monitoring Devices Industry Revenue (Million), by Device (Revenue and Volume) 2024 & 2032
- Figure 556: By Country Blood Glucose Monitoring Devices Industry Volume (K Unit), by Device (Revenue and Volume) 2024 & 2032
- Figure 557: By Country Blood Glucose Monitoring Devices Industry Revenue Share (%), by Device (Revenue and Volume) 2024 & 2032
- Figure 558: By Country Blood Glucose Monitoring Devices Industry Volume Share (%), by Device (Revenue and Volume) 2024 & 2032
- Figure 559: By Country Blood Glucose Monitoring Devices Industry Revenue (Million), by End User (Revenue and Volume) 2024 & 2032
- Figure 560: By Country Blood Glucose Monitoring Devices Industry Volume (K Unit), by End User (Revenue and Volume) 2024 & 2032
- Figure 561: By Country Blood Glucose Monitoring Devices Industry Revenue Share (%), by End User (Revenue and Volume) 2024 & 2032
- Figure 562: By Country Blood Glucose Monitoring Devices Industry Volume Share (%), by End User (Revenue and Volume) 2024 & 2032
- Figure 563: By Country Blood Glucose Monitoring Devices Industry Revenue (Million), by Indicators (Revenue and Volume) 2024 & 2032
- Figure 564: By Country Blood Glucose Monitoring Devices Industry Volume (K Unit), by Indicators (Revenue and Volume) 2024 & 2032
- Figure 565: By Country Blood Glucose Monitoring Devices Industry Revenue Share (%), by Indicators (Revenue and Volume) 2024 & 2032
- Figure 566: By Country Blood Glucose Monitoring Devices Industry Volume Share (%), by Indicators (Revenue and Volume) 2024 & 2032
- Figure 567: By Country Blood Glucose Monitoring Devices Industry Revenue (Million), by Country 2024 & 2032
- Figure 568: By Country Blood Glucose Monitoring Devices Industry Volume (K Unit), by Country 2024 & 2032
- Figure 569: By Country Blood Glucose Monitoring Devices Industry Revenue Share (%), by Country 2024 & 2032
- Figure 570: By Country Blood Glucose Monitoring Devices Industry Volume Share (%), by Country 2024 & 2032
- Figure 571: Saudi Arabia Blood Glucose Monitoring Devices Industry Revenue (Million), by Device (Revenue and Volume) 2024 & 2032
- Figure 572: Saudi Arabia Blood Glucose Monitoring Devices Industry Volume (K Unit), by Device (Revenue and Volume) 2024 & 2032
- Figure 573: Saudi Arabia Blood Glucose Monitoring Devices Industry Revenue Share (%), by Device (Revenue and Volume) 2024 & 2032
- Figure 574: Saudi Arabia Blood Glucose Monitoring Devices Industry Volume Share (%), by Device (Revenue and Volume) 2024 & 2032
- Figure 575: Saudi Arabia Blood Glucose Monitoring Devices Industry Revenue (Million), by End User (Revenue and Volume) 2024 & 2032
- Figure 576: Saudi Arabia Blood Glucose Monitoring Devices Industry Volume (K Unit), by End User (Revenue and Volume) 2024 & 2032
- Figure 577: Saudi Arabia Blood Glucose Monitoring Devices Industry Revenue Share (%), by End User (Revenue and Volume) 2024 & 2032
- Figure 578: Saudi Arabia Blood Glucose Monitoring Devices Industry Volume Share (%), by End User (Revenue and Volume) 2024 & 2032
- Figure 579: Saudi Arabia Blood Glucose Monitoring Devices Industry Revenue (Million), by Indicators (Revenue and Volume) 2024 & 2032
- Figure 580: Saudi Arabia Blood Glucose Monitoring Devices Industry Volume (K Unit), by Indicators (Revenue and Volume) 2024 & 2032
- Figure 581: Saudi Arabia Blood Glucose Monitoring Devices Industry Revenue Share (%), by Indicators (Revenue and Volume) 2024 & 2032
- Figure 582: Saudi Arabia Blood Glucose Monitoring Devices Industry Volume Share (%), by Indicators (Revenue and Volume) 2024 & 2032
- Figure 583: Saudi Arabia Blood Glucose Monitoring Devices Industry Revenue (Million), by Country 2024 & 2032
- Figure 584: Saudi Arabia Blood Glucose Monitoring Devices Industry Volume (K Unit), by Country 2024 & 2032
- Figure 585: Saudi Arabia Blood Glucose Monitoring Devices Industry Revenue Share (%), by Country 2024 & 2032
- Figure 586: Saudi Arabia Blood Glucose Monitoring Devices Industry Volume Share (%), by Country 2024 & 2032
- Figure 587: Iran Blood Glucose Monitoring Devices Industry Revenue (Million), by Device (Revenue and Volume) 2024 & 2032
- Figure 588: Iran Blood Glucose Monitoring Devices Industry Volume (K Unit), by Device (Revenue and Volume) 2024 & 2032
- Figure 589: Iran Blood Glucose Monitoring Devices Industry Revenue Share (%), by Device (Revenue and Volume) 2024 & 2032
- Figure 590: Iran Blood Glucose Monitoring Devices Industry Volume Share (%), by Device (Revenue and Volume) 2024 & 2032
- Figure 591: Iran Blood Glucose Monitoring Devices Industry Revenue (Million), by End User (Revenue and Volume) 2024 & 2032
- Figure 592: Iran Blood Glucose Monitoring Devices Industry Volume (K Unit), by End User (Revenue and Volume) 2024 & 2032
- Figure 593: Iran Blood Glucose Monitoring Devices Industry Revenue Share (%), by End User (Revenue and Volume) 2024 & 2032
- Figure 594: Iran Blood Glucose Monitoring Devices Industry Volume Share (%), by End User (Revenue and Volume) 2024 & 2032
- Figure 595: Iran Blood Glucose Monitoring Devices Industry Revenue (Million), by Indicators (Revenue and Volume) 2024 & 2032
- Figure 596: Iran Blood Glucose Monitoring Devices Industry Volume (K Unit), by Indicators (Revenue and Volume) 2024 & 2032
- Figure 597: Iran Blood Glucose Monitoring Devices Industry Revenue Share (%), by Indicators (Revenue and Volume) 2024 & 2032
- Figure 598: Iran Blood Glucose Monitoring Devices Industry Volume Share (%), by Indicators (Revenue and Volume) 2024 & 2032
- Figure 599: Iran Blood Glucose Monitoring Devices Industry Revenue (Million), by Country 2024 & 2032
- Figure 600: Iran Blood Glucose Monitoring Devices Industry Volume (K Unit), by Country 2024 & 2032
- Figure 601: Iran Blood Glucose Monitoring Devices Industry Revenue Share (%), by Country 2024 & 2032
- Figure 602: Iran Blood Glucose Monitoring Devices Industry Volume Share (%), by Country 2024 & 2032
- Figure 603: Egypt Blood Glucose Monitoring Devices Industry Revenue (Million), by Device (Revenue and Volume) 2024 & 2032
- Figure 604: Egypt Blood Glucose Monitoring Devices Industry Volume (K Unit), by Device (Revenue and Volume) 2024 & 2032
- Figure 605: Egypt Blood Glucose Monitoring Devices Industry Revenue Share (%), by Device (Revenue and Volume) 2024 & 2032
- Figure 606: Egypt Blood Glucose Monitoring Devices Industry Volume Share (%), by Device (Revenue and Volume) 2024 & 2032
- Figure 607: Egypt Blood Glucose Monitoring Devices Industry Revenue (Million), by End User (Revenue and Volume) 2024 & 2032
- Figure 608: Egypt Blood Glucose Monitoring Devices Industry Volume (K Unit), by End User (Revenue and Volume) 2024 & 2032
- Figure 609: Egypt Blood Glucose Monitoring Devices Industry Revenue Share (%), by End User (Revenue and Volume) 2024 & 2032
- Figure 610: Egypt Blood Glucose Monitoring Devices Industry Volume Share (%), by End User (Revenue and Volume) 2024 & 2032
- Figure 611: Egypt Blood Glucose Monitoring Devices Industry Revenue (Million), by Indicators (Revenue and Volume) 2024 & 2032
- Figure 612: Egypt Blood Glucose Monitoring Devices Industry Volume (K Unit), by Indicators (Revenue and Volume) 2024 & 2032
- Figure 613: Egypt Blood Glucose Monitoring Devices Industry Revenue Share (%), by Indicators (Revenue and Volume) 2024 & 2032
- Figure 614: Egypt Blood Glucose Monitoring Devices Industry Volume Share (%), by Indicators (Revenue and Volume) 2024 & 2032
- Figure 615: Egypt Blood Glucose Monitoring Devices Industry Revenue (Million), by Country 2024 & 2032
- Figure 616: Egypt Blood Glucose Monitoring Devices Industry Volume (K Unit), by Country 2024 & 2032
- Figure 617: Egypt Blood Glucose Monitoring Devices Industry Revenue Share (%), by Country 2024 & 2032
- Figure 618: Egypt Blood Glucose Monitoring Devices Industry Volume Share (%), by Country 2024 & 2032
- Figure 619: Oman Blood Glucose Monitoring Devices Industry Revenue (Million), by Device (Revenue and Volume) 2024 & 2032
- Figure 620: Oman Blood Glucose Monitoring Devices Industry Volume (K Unit), by Device (Revenue and Volume) 2024 & 2032
- Figure 621: Oman Blood Glucose Monitoring Devices Industry Revenue Share (%), by Device (Revenue and Volume) 2024 & 2032
- Figure 622: Oman Blood Glucose Monitoring Devices Industry Volume Share (%), by Device (Revenue and Volume) 2024 & 2032
- Figure 623: Oman Blood Glucose Monitoring Devices Industry Revenue (Million), by End User (Revenue and Volume) 2024 & 2032
- Figure 624: Oman Blood Glucose Monitoring Devices Industry Volume (K Unit), by End User (Revenue and Volume) 2024 & 2032
- Figure 625: Oman Blood Glucose Monitoring Devices Industry Revenue Share (%), by End User (Revenue and Volume) 2024 & 2032
- Figure 626: Oman Blood Glucose Monitoring Devices Industry Volume Share (%), by End User (Revenue and Volume) 2024 & 2032
- Figure 627: Oman Blood Glucose Monitoring Devices Industry Revenue (Million), by Indicators (Revenue and Volume) 2024 & 2032
- Figure 628: Oman Blood Glucose Monitoring Devices Industry Volume (K Unit), by Indicators (Revenue and Volume) 2024 & 2032
- Figure 629: Oman Blood Glucose Monitoring Devices Industry Revenue Share (%), by Indicators (Revenue and Volume) 2024 & 2032
- Figure 630: Oman Blood Glucose Monitoring Devices Industry Volume Share (%), by Indicators (Revenue and Volume) 2024 & 2032
- Figure 631: Oman Blood Glucose Monitoring Devices Industry Revenue (Million), by Country 2024 & 2032
- Figure 632: Oman Blood Glucose Monitoring Devices Industry Volume (K Unit), by Country 2024 & 2032
- Figure 633: Oman Blood Glucose Monitoring Devices Industry Revenue Share (%), by Country 2024 & 2032
- Figure 634: Oman Blood Glucose Monitoring Devices Industry Volume Share (%), by Country 2024 & 2032
- Figure 635: South Africa Blood Glucose Monitoring Devices Industry Revenue (Million), by Device (Revenue and Volume) 2024 & 2032
- Figure 636: South Africa Blood Glucose Monitoring Devices Industry Volume (K Unit), by Device (Revenue and Volume) 2024 & 2032
- Figure 637: South Africa Blood Glucose Monitoring Devices Industry Revenue Share (%), by Device (Revenue and Volume) 2024 & 2032
- Figure 638: South Africa Blood Glucose Monitoring Devices Industry Volume Share (%), by Device (Revenue and Volume) 2024 & 2032
- Figure 639: South Africa Blood Glucose Monitoring Devices Industry Revenue (Million), by End User (Revenue and Volume) 2024 & 2032
- Figure 640: South Africa Blood Glucose Monitoring Devices Industry Volume (K Unit), by End User (Revenue and Volume) 2024 & 2032
- Figure 641: South Africa Blood Glucose Monitoring Devices Industry Revenue Share (%), by End User (Revenue and Volume) 2024 & 2032
- Figure 642: South Africa Blood Glucose Monitoring Devices Industry Volume Share (%), by End User (Revenue and Volume) 2024 & 2032
- Figure 643: South Africa Blood Glucose Monitoring Devices Industry Revenue (Million), by Indicators (Revenue and Volume) 2024 & 2032
- Figure 644: South Africa Blood Glucose Monitoring Devices Industry Volume (K Unit), by Indicators (Revenue and Volume) 2024 & 2032
- Figure 645: South Africa Blood Glucose Monitoring Devices Industry Revenue Share (%), by Indicators (Revenue and Volume) 2024 & 2032
- Figure 646: South Africa Blood Glucose Monitoring Devices Industry Volume Share (%), by Indicators (Revenue and Volume) 2024 & 2032
- Figure 647: South Africa Blood Glucose Monitoring Devices Industry Revenue (Million), by Country 2024 & 2032
- Figure 648: South Africa Blood Glucose Monitoring Devices Industry Volume (K Unit), by Country 2024 & 2032
- Figure 649: South Africa Blood Glucose Monitoring Devices Industry Revenue Share (%), by Country 2024 & 2032
- Figure 650: South Africa Blood Glucose Monitoring Devices Industry Volume Share (%), by Country 2024 & 2032
- Figure 651: Rest of Middle East and Africa Blood Glucose Monitoring Devices Industry Revenue (Million), by Device (Revenue and Volume) 2024 & 2032
- Figure 652: Rest of Middle East and Africa Blood Glucose Monitoring Devices Industry Volume (K Unit), by Device (Revenue and Volume) 2024 & 2032
- Figure 653: Rest of Middle East and Africa Blood Glucose Monitoring Devices Industry Revenue Share (%), by Device (Revenue and Volume) 2024 & 2032
- Figure 654: Rest of Middle East and Africa Blood Glucose Monitoring Devices Industry Volume Share (%), by Device (Revenue and Volume) 2024 & 2032
- Figure 655: Rest of Middle East and Africa Blood Glucose Monitoring Devices Industry Revenue (Million), by End User (Revenue and Volume) 2024 & 2032
- Figure 656: Rest of Middle East and Africa Blood Glucose Monitoring Devices Industry Volume (K Unit), by End User (Revenue and Volume) 2024 & 2032
- Figure 657: Rest of Middle East and Africa Blood Glucose Monitoring Devices Industry Revenue Share (%), by End User (Revenue and Volume) 2024 & 2032
- Figure 658: Rest of Middle East and Africa Blood Glucose Monitoring Devices Industry Volume Share (%), by End User (Revenue and Volume) 2024 & 2032
- Figure 659: Rest of Middle East and Africa Blood Glucose Monitoring Devices Industry Revenue (Million), by Indicators (Revenue and Volume) 2024 & 2032
- Figure 660: Rest of Middle East and Africa Blood Glucose Monitoring Devices Industry Volume (K Unit), by Indicators (Revenue and Volume) 2024 & 2032
- Figure 661: Rest of Middle East and Africa Blood Glucose Monitoring Devices Industry Revenue Share (%), by Indicators (Revenue and Volume) 2024 & 2032
- Figure 662: Rest of Middle East and Africa Blood Glucose Monitoring Devices Industry Volume Share (%), by Indicators (Revenue and Volume) 2024 & 2032
- Figure 663: Rest of Middle East and Africa Blood Glucose Monitoring Devices Industry Revenue (Million), by Country 2024 & 2032
- Figure 664: Rest of Middle East and Africa Blood Glucose Monitoring Devices Industry Volume (K Unit), by Country 2024 & 2032
- Figure 665: Rest of Middle East and Africa Blood Glucose Monitoring Devices Industry Revenue Share (%), by Country 2024 & 2032
- Figure 666: Rest of Middle East and Africa Blood Glucose Monitoring Devices Industry Volume Share (%), by Country 2024 & 2032
List of Tables
- Table 1: Global Blood Glucose Monitoring Devices Industry Revenue Million Forecast, by Region 2019 & 2032
- Table 2: Global Blood Glucose Monitoring Devices Industry Volume K Unit Forecast, by Region 2019 & 2032
- Table 3: Global Blood Glucose Monitoring Devices Industry Revenue Million Forecast, by Device (Revenue and Volume) 2019 & 2032
- Table 4: Global Blood Glucose Monitoring Devices Industry Volume K Unit Forecast, by Device (Revenue and Volume) 2019 & 2032
- Table 5: Global Blood Glucose Monitoring Devices Industry Revenue Million Forecast, by End User (Revenue and Volume) 2019 & 2032
- Table 6: Global Blood Glucose Monitoring Devices Industry Volume K Unit Forecast, by End User (Revenue and Volume) 2019 & 2032
- Table 7: Global Blood Glucose Monitoring Devices Industry Revenue Million Forecast, by Indicators (Revenue and Volume) 2019 & 2032
- Table 8: Global Blood Glucose Monitoring Devices Industry Volume K Unit Forecast, by Indicators (Revenue and Volume) 2019 & 2032
- Table 9: Global Blood Glucose Monitoring Devices Industry Revenue Million Forecast, by Region 2019 & 2032
- Table 10: Global Blood Glucose Monitoring Devices Industry Volume K Unit Forecast, by Region 2019 & 2032
- Table 11: Global Blood Glucose Monitoring Devices Industry Revenue Million Forecast, by Country 2019 & 2032
- Table 12: Global Blood Glucose Monitoring Devices Industry Volume K Unit Forecast, by Country 2019 & 2032
- Table 13: United States Blood Glucose Monitoring Devices Industry Revenue (Million) Forecast, by Application 2019 & 2032
- Table 14: United States Blood Glucose Monitoring Devices Industry Volume (K Unit) Forecast, by Application 2019 & 2032
- Table 15: Canada Blood Glucose Monitoring Devices Industry Revenue (Million) Forecast, by Application 2019 & 2032
- Table 16: Canada Blood Glucose Monitoring Devices Industry Volume (K Unit) Forecast, by Application 2019 & 2032
- Table 17: Mexico Blood Glucose Monitoring Devices Industry Revenue (Million) Forecast, by Application 2019 & 2032
- Table 18: Mexico Blood Glucose Monitoring Devices Industry Volume (K Unit) Forecast, by Application 2019 & 2032
- Table 19: Global Blood Glucose Monitoring Devices Industry Revenue Million Forecast, by Country 2019 & 2032
- Table 20: Global Blood Glucose Monitoring Devices Industry Volume K Unit Forecast, by Country 2019 & 2032
- Table 21: Germany Blood Glucose Monitoring Devices Industry Revenue (Million) Forecast, by Application 2019 & 2032
- Table 22: Germany Blood Glucose Monitoring Devices Industry Volume (K Unit) Forecast, by Application 2019 & 2032
- Table 23: United Kingdom Blood Glucose Monitoring Devices Industry Revenue (Million) Forecast, by Application 2019 & 2032
- Table 24: United Kingdom Blood Glucose Monitoring Devices Industry Volume (K Unit) Forecast, by Application 2019 & 2032
- Table 25: France Blood Glucose Monitoring Devices Industry Revenue (Million) Forecast, by Application 2019 & 2032
- Table 26: France Blood Glucose Monitoring Devices Industry Volume (K Unit) Forecast, by Application 2019 & 2032
- Table 27: Spain Blood Glucose Monitoring Devices Industry Revenue (Million) Forecast, by Application 2019 & 2032
- Table 28: Spain Blood Glucose Monitoring Devices Industry Volume (K Unit) Forecast, by Application 2019 & 2032
- Table 29: Italy Blood Glucose Monitoring Devices Industry Revenue (Million) Forecast, by Application 2019 & 2032
- Table 30: Italy Blood Glucose Monitoring Devices Industry Volume (K Unit) Forecast, by Application 2019 & 2032
- Table 31: Spain Blood Glucose Monitoring Devices Industry Revenue (Million) Forecast, by Application 2019 & 2032
- Table 32: Spain Blood Glucose Monitoring Devices Industry Volume (K Unit) Forecast, by Application 2019 & 2032
- Table 33: Belgium Blood Glucose Monitoring Devices Industry Revenue (Million) Forecast, by Application 2019 & 2032
- Table 34: Belgium Blood Glucose Monitoring Devices Industry Volume (K Unit) Forecast, by Application 2019 & 2032
- Table 35: Netherland Blood Glucose Monitoring Devices Industry Revenue (Million) Forecast, by Application 2019 & 2032
- Table 36: Netherland Blood Glucose Monitoring Devices Industry Volume (K Unit) Forecast, by Application 2019 & 2032
- Table 37: Nordics Blood Glucose Monitoring Devices Industry Revenue (Million) Forecast, by Application 2019 & 2032
- Table 38: Nordics Blood Glucose Monitoring Devices Industry Volume (K Unit) Forecast, by Application 2019 & 2032
- Table 39: Rest of Europe Blood Glucose Monitoring Devices Industry Revenue (Million) Forecast, by Application 2019 & 2032
- Table 40: Rest of Europe Blood Glucose Monitoring Devices Industry Volume (K Unit) Forecast, by Application 2019 & 2032
- Table 41: Global Blood Glucose Monitoring Devices Industry Revenue Million Forecast, by Country 2019 & 2032
- Table 42: Global Blood Glucose Monitoring Devices Industry Volume K Unit Forecast, by Country 2019 & 2032
- Table 43: China Blood Glucose Monitoring Devices Industry Revenue (Million) Forecast, by Application 2019 & 2032
- Table 44: China Blood Glucose Monitoring Devices Industry Volume (K Unit) Forecast, by Application 2019 & 2032
- Table 45: Japan Blood Glucose Monitoring Devices Industry Revenue (Million) Forecast, by Application 2019 & 2032
- Table 46: Japan Blood Glucose Monitoring Devices Industry Volume (K Unit) Forecast, by Application 2019 & 2032
- Table 47: India Blood Glucose Monitoring Devices Industry Revenue (Million) Forecast, by Application 2019 & 2032
- Table 48: India Blood Glucose Monitoring Devices Industry Volume (K Unit) Forecast, by Application 2019 & 2032
- Table 49: South Korea Blood Glucose Monitoring Devices Industry Revenue (Million) Forecast, by Application 2019 & 2032
- Table 50: South Korea Blood Glucose Monitoring Devices Industry Volume (K Unit) Forecast, by Application 2019 & 2032
- Table 51: Southeast Asia Blood Glucose Monitoring Devices Industry Revenue (Million) Forecast, by Application 2019 & 2032
- Table 52: Southeast Asia Blood Glucose Monitoring Devices Industry Volume (K Unit) Forecast, by Application 2019 & 2032
- Table 53: Australia Blood Glucose Monitoring Devices Industry Revenue (Million) Forecast, by Application 2019 & 2032
- Table 54: Australia Blood Glucose Monitoring Devices Industry Volume (K Unit) Forecast, by Application 2019 & 2032
- Table 55: Indonesia Blood Glucose Monitoring Devices Industry Revenue (Million) Forecast, by Application 2019 & 2032
- Table 56: Indonesia Blood Glucose Monitoring Devices Industry Volume (K Unit) Forecast, by Application 2019 & 2032
- Table 57: Phillipes Blood Glucose Monitoring Devices Industry Revenue (Million) Forecast, by Application 2019 & 2032
- Table 58: Phillipes Blood Glucose Monitoring Devices Industry Volume (K Unit) Forecast, by Application 2019 & 2032
- Table 59: Singapore Blood Glucose Monitoring Devices Industry Revenue (Million) Forecast, by Application 2019 & 2032
- Table 60: Singapore Blood Glucose Monitoring Devices Industry Volume (K Unit) Forecast, by Application 2019 & 2032
- Table 61: Thailandc Blood Glucose Monitoring Devices Industry Revenue (Million) Forecast, by Application 2019 & 2032
- Table 62: Thailandc Blood Glucose Monitoring Devices Industry Volume (K Unit) Forecast, by Application 2019 & 2032
- Table 63: Rest of Asia Pacific Blood Glucose Monitoring Devices Industry Revenue (Million) Forecast, by Application 2019 & 2032
- Table 64: Rest of Asia Pacific Blood Glucose Monitoring Devices Industry Volume (K Unit) Forecast, by Application 2019 & 2032
- Table 65: Global Blood Glucose Monitoring Devices Industry Revenue Million Forecast, by Country 2019 & 2032
- Table 66: Global Blood Glucose Monitoring Devices Industry Volume K Unit Forecast, by Country 2019 & 2032
- Table 67: Brazil Blood Glucose Monitoring Devices Industry Revenue (Million) Forecast, by Application 2019 & 2032
- Table 68: Brazil Blood Glucose Monitoring Devices Industry Volume (K Unit) Forecast, by Application 2019 & 2032
- Table 69: Argentina Blood Glucose Monitoring Devices Industry Revenue (Million) Forecast, by Application 2019 & 2032
- Table 70: Argentina Blood Glucose Monitoring Devices Industry Volume (K Unit) Forecast, by Application 2019 & 2032
- Table 71: Peru Blood Glucose Monitoring Devices Industry Revenue (Million) Forecast, by Application 2019 & 2032
- Table 72: Peru Blood Glucose Monitoring Devices Industry Volume (K Unit) Forecast, by Application 2019 & 2032
- Table 73: Chile Blood Glucose Monitoring Devices Industry Revenue (Million) Forecast, by Application 2019 & 2032
- Table 74: Chile Blood Glucose Monitoring Devices Industry Volume (K Unit) Forecast, by Application 2019 & 2032
- Table 75: Colombia Blood Glucose Monitoring Devices Industry Revenue (Million) Forecast, by Application 2019 & 2032
- Table 76: Colombia Blood Glucose Monitoring Devices Industry Volume (K Unit) Forecast, by Application 2019 & 2032
- Table 77: Ecuador Blood Glucose Monitoring Devices Industry Revenue (Million) Forecast, by Application 2019 & 2032
- Table 78: Ecuador Blood Glucose Monitoring Devices Industry Volume (K Unit) Forecast, by Application 2019 & 2032
- Table 79: Venezuela Blood Glucose Monitoring Devices Industry Revenue (Million) Forecast, by Application 2019 & 2032
- Table 80: Venezuela Blood Glucose Monitoring Devices Industry Volume (K Unit) Forecast, by Application 2019 & 2032
- Table 81: Rest of South America Blood Glucose Monitoring Devices Industry Revenue (Million) Forecast, by Application 2019 & 2032
- Table 82: Rest of South America Blood Glucose Monitoring Devices Industry Volume (K Unit) Forecast, by Application 2019 & 2032
- Table 83: Global Blood Glucose Monitoring Devices Industry Revenue Million Forecast, by Country 2019 & 2032
- Table 84: Global Blood Glucose Monitoring Devices Industry Volume K Unit Forecast, by Country 2019 & 2032
- Table 85: United States Blood Glucose Monitoring Devices Industry Revenue (Million) Forecast, by Application 2019 & 2032
- Table 86: United States Blood Glucose Monitoring Devices Industry Volume (K Unit) Forecast, by Application 2019 & 2032
- Table 87: Canada Blood Glucose Monitoring Devices Industry Revenue (Million) Forecast, by Application 2019 & 2032
- Table 88: Canada Blood Glucose Monitoring Devices Industry Volume (K Unit) Forecast, by Application 2019 & 2032
- Table 89: Mexico Blood Glucose Monitoring Devices Industry Revenue (Million) Forecast, by Application 2019 & 2032
- Table 90: Mexico Blood Glucose Monitoring Devices Industry Volume (K Unit) Forecast, by Application 2019 & 2032
- Table 91: Global Blood Glucose Monitoring Devices Industry Revenue Million Forecast, by Country 2019 & 2032
- Table 92: Global Blood Glucose Monitoring Devices Industry Volume K Unit Forecast, by Country 2019 & 2032
- Table 93: United Arab Emirates Blood Glucose Monitoring Devices Industry Revenue (Million) Forecast, by Application 2019 & 2032
- Table 94: United Arab Emirates Blood Glucose Monitoring Devices Industry Volume (K Unit) Forecast, by Application 2019 & 2032
- Table 95: Saudi Arabia Blood Glucose Monitoring Devices Industry Revenue (Million) Forecast, by Application 2019 & 2032
- Table 96: Saudi Arabia Blood Glucose Monitoring Devices Industry Volume (K Unit) Forecast, by Application 2019 & 2032
- Table 97: South Africa Blood Glucose Monitoring Devices Industry Revenue (Million) Forecast, by Application 2019 & 2032
- Table 98: South Africa Blood Glucose Monitoring Devices Industry Volume (K Unit) Forecast, by Application 2019 & 2032
- Table 99: Rest of Middle East and Africa Blood Glucose Monitoring Devices Industry Revenue (Million) Forecast, by Application 2019 & 2032
- Table 100: Rest of Middle East and Africa Blood Glucose Monitoring Devices Industry Volume (K Unit) Forecast, by Application 2019 & 2032
- Table 101: Global Blood Glucose Monitoring Devices Industry Revenue Million Forecast, by Device (Revenue and Volume) 2019 & 2032
- Table 102: Global Blood Glucose Monitoring Devices Industry Volume K Unit Forecast, by Device (Revenue and Volume) 2019 & 2032
- Table 103: Global Blood Glucose Monitoring Devices Industry Revenue Million Forecast, by End User (Revenue and Volume) 2019 & 2032
- Table 104: Global Blood Glucose Monitoring Devices Industry Volume K Unit Forecast, by End User (Revenue and Volume) 2019 & 2032
- Table 105: Global Blood Glucose Monitoring Devices Industry Revenue Million Forecast, by Indicators (Revenue and Volume) 2019 & 2032
- Table 106: Global Blood Glucose Monitoring Devices Industry Volume K Unit Forecast, by Indicators (Revenue and Volume) 2019 & 2032
- Table 107: Global Blood Glucose Monitoring Devices Industry Revenue Million Forecast, by Country 2019 & 2032
- Table 108: Global Blood Glucose Monitoring Devices Industry Volume K Unit Forecast, by Country 2019 & 2032
- Table 109: By Device Blood Glucose Monitoring Devices Industry Revenue (Million) Forecast, by Application 2019 & 2032
- Table 110: By Device Blood Glucose Monitoring Devices Industry Volume (K Unit) Forecast, by Application 2019 & 2032
- Table 111: Global Blood Glucose Monitoring Devices Industry Revenue Million Forecast, by Device (Revenue and Volume) 2019 & 2032
- Table 112: Global Blood Glucose Monitoring Devices Industry Volume K Unit Forecast, by Device (Revenue and Volume) 2019 & 2032
- Table 113: Global Blood Glucose Monitoring Devices Industry Revenue Million Forecast, by End User (Revenue and Volume) 2019 & 2032
- Table 114: Global Blood Glucose Monitoring Devices Industry Volume K Unit Forecast, by End User (Revenue and Volume) 2019 & 2032
- Table 115: Global Blood Glucose Monitoring Devices Industry Revenue Million Forecast, by Indicators (Revenue and Volume) 2019 & 2032
- Table 116: Global Blood Glucose Monitoring Devices Industry Volume K Unit Forecast, by Indicators (Revenue and Volume) 2019 & 2032
- Table 117: Global Blood Glucose Monitoring Devices Industry Revenue Million Forecast, by Country 2019 & 2032
- Table 118: Global Blood Glucose Monitoring Devices Industry Volume K Unit Forecast, by Country 2019 & 2032
- Table 119: Global Blood Glucose Monitoring Devices Industry Revenue Million Forecast, by Device (Revenue and Volume) 2019 & 2032
- Table 120: Global Blood Glucose Monitoring Devices Industry Volume K Unit Forecast, by Device (Revenue and Volume) 2019 & 2032
- Table 121: Global Blood Glucose Monitoring Devices Industry Revenue Million Forecast, by End User (Revenue and Volume) 2019 & 2032
- Table 122: Global Blood Glucose Monitoring Devices Industry Volume K Unit Forecast, by End User (Revenue and Volume) 2019 & 2032
- Table 123: Global Blood Glucose Monitoring Devices Industry Revenue Million Forecast, by Indicators (Revenue and Volume) 2019 & 2032
- Table 124: Global Blood Glucose Monitoring Devices Industry Volume K Unit Forecast, by Indicators (Revenue and Volume) 2019 & 2032
- Table 125: Global Blood Glucose Monitoring Devices Industry Revenue Million Forecast, by Country 2019 & 2032
- Table 126: Global Blood Glucose Monitoring Devices Industry Volume K Unit Forecast, by Country 2019 & 2032
- Table 127: Global Blood Glucose Monitoring Devices Industry Revenue Million Forecast, by Device (Revenue and Volume) 2019 & 2032
- Table 128: Global Blood Glucose Monitoring Devices Industry Volume K Unit Forecast, by Device (Revenue and Volume) 2019 & 2032
- Table 129: Global Blood Glucose Monitoring Devices Industry Revenue Million Forecast, by End User (Revenue and Volume) 2019 & 2032
- Table 130: Global Blood Glucose Monitoring Devices Industry Volume K Unit Forecast, by End User (Revenue and Volume) 2019 & 2032
- Table 131: Global Blood Glucose Monitoring Devices Industry Revenue Million Forecast, by Indicators (Revenue and Volume) 2019 & 2032
- Table 132: Global Blood Glucose Monitoring Devices Industry Volume K Unit Forecast, by Indicators (Revenue and Volume) 2019 & 2032
- Table 133: Global Blood Glucose Monitoring Devices Industry Revenue Million Forecast, by Country 2019 & 2032
- Table 134: Global Blood Glucose Monitoring Devices Industry Volume K Unit Forecast, by Country 2019 & 2032
- Table 135: Global Blood Glucose Monitoring Devices Industry Revenue Million Forecast, by Device (Revenue and Volume) 2019 & 2032
- Table 136: Global Blood Glucose Monitoring Devices Industry Volume K Unit Forecast, by Device (Revenue and Volume) 2019 & 2032
- Table 137: Global Blood Glucose Monitoring Devices Industry Revenue Million Forecast, by End User (Revenue and Volume) 2019 & 2032
- Table 138: Global Blood Glucose Monitoring Devices Industry Volume K Unit Forecast, by End User (Revenue and Volume) 2019 & 2032
- Table 139: Global Blood Glucose Monitoring Devices Industry Revenue Million Forecast, by Indicators (Revenue and Volume) 2019 & 2032
- Table 140: Global Blood Glucose Monitoring Devices Industry Volume K Unit Forecast, by Indicators (Revenue and Volume) 2019 & 2032
- Table 141: Global Blood Glucose Monitoring Devices Industry Revenue Million Forecast, by Country 2019 & 2032
- Table 142: Global Blood Glucose Monitoring Devices Industry Volume K Unit Forecast, by Country 2019 & 2032
- Table 143: Global Blood Glucose Monitoring Devices Industry Revenue Million Forecast, by Device (Revenue and Volume) 2019 & 2032
- Table 144: Global Blood Glucose Monitoring Devices Industry Volume K Unit Forecast, by Device (Revenue and Volume) 2019 & 2032
- Table 145: Global Blood Glucose Monitoring Devices Industry Revenue Million Forecast, by End User (Revenue and Volume) 2019 & 2032
- Table 146: Global Blood Glucose Monitoring Devices Industry Volume K Unit Forecast, by End User (Revenue and Volume) 2019 & 2032
- Table 147: Global Blood Glucose Monitoring Devices Industry Revenue Million Forecast, by Indicators (Revenue and Volume) 2019 & 2032
- Table 148: Global Blood Glucose Monitoring Devices Industry Volume K Unit Forecast, by Indicators (Revenue and Volume) 2019 & 2032
- Table 149: Global Blood Glucose Monitoring Devices Industry Revenue Million Forecast, by Country 2019 & 2032
- Table 150: Global Blood Glucose Monitoring Devices Industry Volume K Unit Forecast, by Country 2019 & 2032
- Table 151: By Device Blood Glucose Monitoring Devices Industry Revenue (Million) Forecast, by Application 2019 & 2032
- Table 152: By Device Blood Glucose Monitoring Devices Industry Volume (K Unit) Forecast, by Application 2019 & 2032
- Table 153: Global Blood Glucose Monitoring Devices Industry Revenue Million Forecast, by Device (Revenue and Volume) 2019 & 2032
- Table 154: Global Blood Glucose Monitoring Devices Industry Volume K Unit Forecast, by Device (Revenue and Volume) 2019 & 2032
- Table 155: Global Blood Glucose Monitoring Devices Industry Revenue Million Forecast, by End User (Revenue and Volume) 2019 & 2032
- Table 156: Global Blood Glucose Monitoring Devices Industry Volume K Unit Forecast, by End User (Revenue and Volume) 2019 & 2032
- Table 157: Global Blood Glucose Monitoring Devices Industry Revenue Million Forecast, by Indicators (Revenue and Volume) 2019 & 2032
- Table 158: Global Blood Glucose Monitoring Devices Industry Volume K Unit Forecast, by Indicators (Revenue and Volume) 2019 & 2032
- Table 159: Global Blood Glucose Monitoring Devices Industry Revenue Million Forecast, by Country 2019 & 2032
- Table 160: Global Blood Glucose Monitoring Devices Industry Volume K Unit Forecast, by Country 2019 & 2032
- Table 161: Global Blood Glucose Monitoring Devices Industry Revenue Million Forecast, by Device (Revenue and Volume) 2019 & 2032
- Table 162: Global Blood Glucose Monitoring Devices Industry Volume K Unit Forecast, by Device (Revenue and Volume) 2019 & 2032
- Table 163: Global Blood Glucose Monitoring Devices Industry Revenue Million Forecast, by End User (Revenue and Volume) 2019 & 2032
- Table 164: Global Blood Glucose Monitoring Devices Industry Volume K Unit Forecast, by End User (Revenue and Volume) 2019 & 2032
- Table 165: Global Blood Glucose Monitoring Devices Industry Revenue Million Forecast, by Indicators (Revenue and Volume) 2019 & 2032
- Table 166: Global Blood Glucose Monitoring Devices Industry Volume K Unit Forecast, by Indicators (Revenue and Volume) 2019 & 2032
- Table 167: Global Blood Glucose Monitoring Devices Industry Revenue Million Forecast, by Country 2019 & 2032
- Table 168: Global Blood Glucose Monitoring Devices Industry Volume K Unit Forecast, by Country 2019 & 2032
- Table 169: Global Blood Glucose Monitoring Devices Industry Revenue Million Forecast, by Device (Revenue and Volume) 2019 & 2032
- Table 170: Global Blood Glucose Monitoring Devices Industry Volume K Unit Forecast, by Device (Revenue and Volume) 2019 & 2032
- Table 171: Global Blood Glucose Monitoring Devices Industry Revenue Million Forecast, by End User (Revenue and Volume) 2019 & 2032
- Table 172: Global Blood Glucose Monitoring Devices Industry Volume K Unit Forecast, by End User (Revenue and Volume) 2019 & 2032
- Table 173: Global Blood Glucose Monitoring Devices Industry Revenue Million Forecast, by Indicators (Revenue and Volume) 2019 & 2032
- Table 174: Global Blood Glucose Monitoring Devices Industry Volume K Unit Forecast, by Indicators (Revenue and Volume) 2019 & 2032
- Table 175: Global Blood Glucose Monitoring Devices Industry Revenue Million Forecast, by Country 2019 & 2032
- Table 176: Global Blood Glucose Monitoring Devices Industry Volume K Unit Forecast, by Country 2019 & 2032
- Table 177: Global Blood Glucose Monitoring Devices Industry Revenue Million Forecast, by Device (Revenue and Volume) 2019 & 2032
- Table 178: Global Blood Glucose Monitoring Devices Industry Volume K Unit Forecast, by Device (Revenue and Volume) 2019 & 2032
- Table 179: Global Blood Glucose Monitoring Devices Industry Revenue Million Forecast, by End User (Revenue and Volume) 2019 & 2032
- Table 180: Global Blood Glucose Monitoring Devices Industry Volume K Unit Forecast, by End User (Revenue and Volume) 2019 & 2032
- Table 181: Global Blood Glucose Monitoring Devices Industry Revenue Million Forecast, by Indicators (Revenue and Volume) 2019 & 2032
- Table 182: Global Blood Glucose Monitoring Devices Industry Volume K Unit Forecast, by Indicators (Revenue and Volume) 2019 & 2032
- Table 183: Global Blood Glucose Monitoring Devices Industry Revenue Million Forecast, by Country 2019 & 2032
- Table 184: Global Blood Glucose Monitoring Devices Industry Volume K Unit Forecast, by Country 2019 & 2032
- Table 185: Global Blood Glucose Monitoring Devices Industry Revenue Million Forecast, by Device (Revenue and Volume) 2019 & 2032
- Table 186: Global Blood Glucose Monitoring Devices Industry Volume K Unit Forecast, by Device (Revenue and Volume) 2019 & 2032
- Table 187: Global Blood Glucose Monitoring Devices Industry Revenue Million Forecast, by End User (Revenue and Volume) 2019 & 2032
- Table 188: Global Blood Glucose Monitoring Devices Industry Volume K Unit Forecast, by End User (Revenue and Volume) 2019 & 2032
- Table 189: Global Blood Glucose Monitoring Devices Industry Revenue Million Forecast, by Indicators (Revenue and Volume) 2019 & 2032
- Table 190: Global Blood Glucose Monitoring Devices Industry Volume K Unit Forecast, by Indicators (Revenue and Volume) 2019 & 2032
- Table 191: Global Blood Glucose Monitoring Devices Industry Revenue Million Forecast, by Country 2019 & 2032
- Table 192: Global Blood Glucose Monitoring Devices Industry Volume K Unit Forecast, by Country 2019 & 2032
- Table 193: Global Blood Glucose Monitoring Devices Industry Revenue Million Forecast, by Device (Revenue and Volume) 2019 & 2032
- Table 194: Global Blood Glucose Monitoring Devices Industry Volume K Unit Forecast, by Device (Revenue and Volume) 2019 & 2032
- Table 195: Global Blood Glucose Monitoring Devices Industry Revenue Million Forecast, by End User (Revenue and Volume) 2019 & 2032
- Table 196: Global Blood Glucose Monitoring Devices Industry Volume K Unit Forecast, by End User (Revenue and Volume) 2019 & 2032
- Table 197: Global Blood Glucose Monitoring Devices Industry Revenue Million Forecast, by Indicators (Revenue and Volume) 2019 & 2032
- Table 198: Global Blood Glucose Monitoring Devices Industry Volume K Unit Forecast, by Indicators (Revenue and Volume) 2019 & 2032
- Table 199: Global Blood Glucose Monitoring Devices Industry Revenue Million Forecast, by Country 2019 & 2032
- Table 200: Global Blood Glucose Monitoring Devices Industry Volume K Unit Forecast, by Country 2019 & 2032
- Table 201: Global Blood Glucose Monitoring Devices Industry Revenue Million Forecast, by Device (Revenue and Volume) 2019 & 2032
- Table 202: Global Blood Glucose Monitoring Devices Industry Volume K Unit Forecast, by Device (Revenue and Volume) 2019 & 2032
- Table 203: Global Blood Glucose Monitoring Devices Industry Revenue Million Forecast, by End User (Revenue and Volume) 2019 & 2032
- Table 204: Global Blood Glucose Monitoring Devices Industry Volume K Unit Forecast, by End User (Revenue and Volume) 2019 & 2032
- Table 205: Global Blood Glucose Monitoring Devices Industry Revenue Million Forecast, by Indicators (Revenue and Volume) 2019 & 2032
- Table 206: Global Blood Glucose Monitoring Devices Industry Volume K Unit Forecast, by Indicators (Revenue and Volume) 2019 & 2032
- Table 207: Global Blood Glucose Monitoring Devices Industry Revenue Million Forecast, by Country 2019 & 2032
- Table 208: Global Blood Glucose Monitoring Devices Industry Volume K Unit Forecast, by Country 2019 & 2032
- Table 209: Global Blood Glucose Monitoring Devices Industry Revenue Million Forecast, by Device (Revenue and Volume) 2019 & 2032
- Table 210: Global Blood Glucose Monitoring Devices Industry Volume K Unit Forecast, by Device (Revenue and Volume) 2019 & 2032
- Table 211: Global Blood Glucose Monitoring Devices Industry Revenue Million Forecast, by End User (Revenue and Volume) 2019 & 2032
- Table 212: Global Blood Glucose Monitoring Devices Industry Volume K Unit Forecast, by End User (Revenue and Volume) 2019 & 2032
- Table 213: Global Blood Glucose Monitoring Devices Industry Revenue Million Forecast, by Indicators (Revenue and Volume) 2019 & 2032
- Table 214: Global Blood Glucose Monitoring Devices Industry Volume K Unit Forecast, by Indicators (Revenue and Volume) 2019 & 2032
- Table 215: Global Blood Glucose Monitoring Devices Industry Revenue Million Forecast, by Country 2019 & 2032
- Table 216: Global Blood Glucose Monitoring Devices Industry Volume K Unit Forecast, by Country 2019 & 2032
- Table 217: Global Blood Glucose Monitoring Devices Industry Revenue Million Forecast, by Device (Revenue and Volume) 2019 & 2032
- Table 218: Global Blood Glucose Monitoring Devices Industry Volume K Unit Forecast, by Device (Revenue and Volume) 2019 & 2032
- Table 219: Global Blood Glucose Monitoring Devices Industry Revenue Million Forecast, by End User (Revenue and Volume) 2019 & 2032
- Table 220: Global Blood Glucose Monitoring Devices Industry Volume K Unit Forecast, by End User (Revenue and Volume) 2019 & 2032
- Table 221: Global Blood Glucose Monitoring Devices Industry Revenue Million Forecast, by Indicators (Revenue and Volume) 2019 & 2032
- Table 222: Global Blood Glucose Monitoring Devices Industry Volume K Unit Forecast, by Indicators (Revenue and Volume) 2019 & 2032
- Table 223: Global Blood Glucose Monitoring Devices Industry Revenue Million Forecast, by Country 2019 & 2032
- Table 224: Global Blood Glucose Monitoring Devices Industry Volume K Unit Forecast, by Country 2019 & 2032
- Table 225: By Device Blood Glucose Monitoring Devices Industry Revenue (Million) Forecast, by Application 2019 & 2032
- Table 226: By Device Blood Glucose Monitoring Devices Industry Volume (K Unit) Forecast, by Application 2019 & 2032
- Table 227: Global Blood Glucose Monitoring Devices Industry Revenue Million Forecast, by Device (Revenue and Volume) 2019 & 2032
- Table 228: Global Blood Glucose Monitoring Devices Industry Volume K Unit Forecast, by Device (Revenue and Volume) 2019 & 2032
- Table 229: Global Blood Glucose Monitoring Devices Industry Revenue Million Forecast, by End User (Revenue and Volume) 2019 & 2032
- Table 230: Global Blood Glucose Monitoring Devices Industry Volume K Unit Forecast, by End User (Revenue and Volume) 2019 & 2032
- Table 231: Global Blood Glucose Monitoring Devices Industry Revenue Million Forecast, by Indicators (Revenue and Volume) 2019 & 2032
- Table 232: Global Blood Glucose Monitoring Devices Industry Volume K Unit Forecast, by Indicators (Revenue and Volume) 2019 & 2032
- Table 233: Global Blood Glucose Monitoring Devices Industry Revenue Million Forecast, by Country 2019 & 2032
- Table 234: Global Blood Glucose Monitoring Devices Industry Volume K Unit Forecast, by Country 2019 & 2032
- Table 235: Global Blood Glucose Monitoring Devices Industry Revenue Million Forecast, by Device (Revenue and Volume) 2019 & 2032
- Table 236: Global Blood Glucose Monitoring Devices Industry Volume K Unit Forecast, by Device (Revenue and Volume) 2019 & 2032
- Table 237: Global Blood Glucose Monitoring Devices Industry Revenue Million Forecast, by End User (Revenue and Volume) 2019 & 2032
- Table 238: Global Blood Glucose Monitoring Devices Industry Volume K Unit Forecast, by End User (Revenue and Volume) 2019 & 2032
- Table 239: Global Blood Glucose Monitoring Devices Industry Revenue Million Forecast, by Indicators (Revenue and Volume) 2019 & 2032
- Table 240: Global Blood Glucose Monitoring Devices Industry Volume K Unit Forecast, by Indicators (Revenue and Volume) 2019 & 2032
- Table 241: Global Blood Glucose Monitoring Devices Industry Revenue Million Forecast, by Country 2019 & 2032
- Table 242: Global Blood Glucose Monitoring Devices Industry Volume K Unit Forecast, by Country 2019 & 2032
- Table 243: Global Blood Glucose Monitoring Devices Industry Revenue Million Forecast, by Device (Revenue and Volume) 2019 & 2032
- Table 244: Global Blood Glucose Monitoring Devices Industry Volume K Unit Forecast, by Device (Revenue and Volume) 2019 & 2032
- Table 245: Global Blood Glucose Monitoring Devices Industry Revenue Million Forecast, by End User (Revenue and Volume) 2019 & 2032
- Table 246: Global Blood Glucose Monitoring Devices Industry Volume K Unit Forecast, by End User (Revenue and Volume) 2019 & 2032
- Table 247: Global Blood Glucose Monitoring Devices Industry Revenue Million Forecast, by Indicators (Revenue and Volume) 2019 & 2032
- Table 248: Global Blood Glucose Monitoring Devices Industry Volume K Unit Forecast, by Indicators (Revenue and Volume) 2019 & 2032
- Table 249: Global Blood Glucose Monitoring Devices Industry Revenue Million Forecast, by Country 2019 & 2032
- Table 250: Global Blood Glucose Monitoring Devices Industry Volume K Unit Forecast, by Country 2019 & 2032
- Table 251: Global Blood Glucose Monitoring Devices Industry Revenue Million Forecast, by Device (Revenue and Volume) 2019 & 2032
- Table 252: Global Blood Glucose Monitoring Devices Industry Volume K Unit Forecast, by Device (Revenue and Volume) 2019 & 2032
- Table 253: Global Blood Glucose Monitoring Devices Industry Revenue Million Forecast, by End User (Revenue and Volume) 2019 & 2032
- Table 254: Global Blood Glucose Monitoring Devices Industry Volume K Unit Forecast, by End User (Revenue and Volume) 2019 & 2032
- Table 255: Global Blood Glucose Monitoring Devices Industry Revenue Million Forecast, by Indicators (Revenue and Volume) 2019 & 2032
- Table 256: Global Blood Glucose Monitoring Devices Industry Volume K Unit Forecast, by Indicators (Revenue and Volume) 2019 & 2032
- Table 257: Global Blood Glucose Monitoring Devices Industry Revenue Million Forecast, by Country 2019 & 2032
- Table 258: Global Blood Glucose Monitoring Devices Industry Volume K Unit Forecast, by Country 2019 & 2032
- Table 259: Global Blood Glucose Monitoring Devices Industry Revenue Million Forecast, by Device (Revenue and Volume) 2019 & 2032
- Table 260: Global Blood Glucose Monitoring Devices Industry Volume K Unit Forecast, by Device (Revenue and Volume) 2019 & 2032
- Table 261: Global Blood Glucose Monitoring Devices Industry Revenue Million Forecast, by End User (Revenue and Volume) 2019 & 2032
- Table 262: Global Blood Glucose Monitoring Devices Industry Volume K Unit Forecast, by End User (Revenue and Volume) 2019 & 2032
- Table 263: Global Blood Glucose Monitoring Devices Industry Revenue Million Forecast, by Indicators (Revenue and Volume) 2019 & 2032
- Table 264: Global Blood Glucose Monitoring Devices Industry Volume K Unit Forecast, by Indicators (Revenue and Volume) 2019 & 2032
- Table 265: Global Blood Glucose Monitoring Devices Industry Revenue Million Forecast, by Country 2019 & 2032
- Table 266: Global Blood Glucose Monitoring Devices Industry Volume K Unit Forecast, by Country 2019 & 2032
- Table 267: By Device Blood Glucose Monitoring Devices Industry Revenue (Million) Forecast, by Application 2019 & 2032
- Table 268: By Device Blood Glucose Monitoring Devices Industry Volume (K Unit) Forecast, by Application 2019 & 2032
- Table 269: Global Blood Glucose Monitoring Devices Industry Revenue Million Forecast, by Device (Revenue and Volume) 2019 & 2032
- Table 270: Global Blood Glucose Monitoring Devices Industry Volume K Unit Forecast, by Device (Revenue and Volume) 2019 & 2032
- Table 271: Global Blood Glucose Monitoring Devices Industry Revenue Million Forecast, by End User (Revenue and Volume) 2019 & 2032
- Table 272: Global Blood Glucose Monitoring Devices Industry Volume K Unit Forecast, by End User (Revenue and Volume) 2019 & 2032
- Table 273: Global Blood Glucose Monitoring Devices Industry Revenue Million Forecast, by Indicators (Revenue and Volume) 2019 & 2032
- Table 274: Global Blood Glucose Monitoring Devices Industry Volume K Unit Forecast, by Indicators (Revenue and Volume) 2019 & 2032
- Table 275: Global Blood Glucose Monitoring Devices Industry Revenue Million Forecast, by Country 2019 & 2032
- Table 276: Global Blood Glucose Monitoring Devices Industry Volume K Unit Forecast, by Country 2019 & 2032
- Table 277: Global Blood Glucose Monitoring Devices Industry Revenue Million Forecast, by Device (Revenue and Volume) 2019 & 2032
- Table 278: Global Blood Glucose Monitoring Devices Industry Volume K Unit Forecast, by Device (Revenue and Volume) 2019 & 2032
- Table 279: Global Blood Glucose Monitoring Devices Industry Revenue Million Forecast, by End User (Revenue and Volume) 2019 & 2032
- Table 280: Global Blood Glucose Monitoring Devices Industry Volume K Unit Forecast, by End User (Revenue and Volume) 2019 & 2032
- Table 281: Global Blood Glucose Monitoring Devices Industry Revenue Million Forecast, by Indicators (Revenue and Volume) 2019 & 2032
- Table 282: Global Blood Glucose Monitoring Devices Industry Volume K Unit Forecast, by Indicators (Revenue and Volume) 2019 & 2032
- Table 283: Global Blood Glucose Monitoring Devices Industry Revenue Million Forecast, by Country 2019 & 2032
- Table 284: Global Blood Glucose Monitoring Devices Industry Volume K Unit Forecast, by Country 2019 & 2032
- Table 285: Global Blood Glucose Monitoring Devices Industry Revenue Million Forecast, by Device (Revenue and Volume) 2019 & 2032
- Table 286: Global Blood Glucose Monitoring Devices Industry Volume K Unit Forecast, by Device (Revenue and Volume) 2019 & 2032
- Table 287: Global Blood Glucose Monitoring Devices Industry Revenue Million Forecast, by End User (Revenue and Volume) 2019 & 2032
- Table 288: Global Blood Glucose Monitoring Devices Industry Volume K Unit Forecast, by End User (Revenue and Volume) 2019 & 2032
- Table 289: Global Blood Glucose Monitoring Devices Industry Revenue Million Forecast, by Indicators (Revenue and Volume) 2019 & 2032
- Table 290: Global Blood Glucose Monitoring Devices Industry Volume K Unit Forecast, by Indicators (Revenue and Volume) 2019 & 2032
- Table 291: Global Blood Glucose Monitoring Devices Industry Revenue Million Forecast, by Country 2019 & 2032
- Table 292: Global Blood Glucose Monitoring Devices Industry Volume K Unit Forecast, by Country 2019 & 2032
- Table 293: Global Blood Glucose Monitoring Devices Industry Revenue Million Forecast, by Device (Revenue and Volume) 2019 & 2032
- Table 294: Global Blood Glucose Monitoring Devices Industry Volume K Unit Forecast, by Device (Revenue and Volume) 2019 & 2032
- Table 295: Global Blood Glucose Monitoring Devices Industry Revenue Million Forecast, by End User (Revenue and Volume) 2019 & 2032
- Table 296: Global Blood Glucose Monitoring Devices Industry Volume K Unit Forecast, by End User (Revenue and Volume) 2019 & 2032
- Table 297: Global Blood Glucose Monitoring Devices Industry Revenue Million Forecast, by Indicators (Revenue and Volume) 2019 & 2032
- Table 298: Global Blood Glucose Monitoring Devices Industry Volume K Unit Forecast, by Indicators (Revenue and Volume) 2019 & 2032
- Table 299: Global Blood Glucose Monitoring Devices Industry Revenue Million Forecast, by Country 2019 & 2032
- Table 300: Global Blood Glucose Monitoring Devices Industry Volume K Unit Forecast, by Country 2019 & 2032
- Table 301: Global Blood Glucose Monitoring Devices Industry Revenue Million Forecast, by Device (Revenue and Volume) 2019 & 2032
- Table 302: Global Blood Glucose Monitoring Devices Industry Volume K Unit Forecast, by Device (Revenue and Volume) 2019 & 2032
- Table 303: Global Blood Glucose Monitoring Devices Industry Revenue Million Forecast, by End User (Revenue and Volume) 2019 & 2032
- Table 304: Global Blood Glucose Monitoring Devices Industry Volume K Unit Forecast, by End User (Revenue and Volume) 2019 & 2032
- Table 305: Global Blood Glucose Monitoring Devices Industry Revenue Million Forecast, by Indicators (Revenue and Volume) 2019 & 2032
- Table 306: Global Blood Glucose Monitoring Devices Industry Volume K Unit Forecast, by Indicators (Revenue and Volume) 2019 & 2032
- Table 307: Global Blood Glucose Monitoring Devices Industry Revenue Million Forecast, by Country 2019 & 2032
- Table 308: Global Blood Glucose Monitoring Devices Industry Volume K Unit Forecast, by Country 2019 & 2032
- Table 309: Global Blood Glucose Monitoring Devices Industry Revenue Million Forecast, by Device (Revenue and Volume) 2019 & 2032
- Table 310: Global Blood Glucose Monitoring Devices Industry Volume K Unit Forecast, by Device (Revenue and Volume) 2019 & 2032
- Table 311: Global Blood Glucose Monitoring Devices Industry Revenue Million Forecast, by End User (Revenue and Volume) 2019 & 2032
- Table 312: Global Blood Glucose Monitoring Devices Industry Volume K Unit Forecast, by End User (Revenue and Volume) 2019 & 2032
- Table 313: Global Blood Glucose Monitoring Devices Industry Revenue Million Forecast, by Indicators (Revenue and Volume) 2019 & 2032
- Table 314: Global Blood Glucose Monitoring Devices Industry Volume K Unit Forecast, by Indicators (Revenue and Volume) 2019 & 2032
- Table 315: Global Blood Glucose Monitoring Devices Industry Revenue Million Forecast, by Country 2019 & 2032
- Table 316: Global Blood Glucose Monitoring Devices Industry Volume K Unit Forecast, by Country 2019 & 2032
- Table 317: Global Blood Glucose Monitoring Devices Industry Revenue Million Forecast, by Device (Revenue and Volume) 2019 & 2032
- Table 318: Global Blood Glucose Monitoring Devices Industry Volume K Unit Forecast, by Device (Revenue and Volume) 2019 & 2032
- Table 319: Global Blood Glucose Monitoring Devices Industry Revenue Million Forecast, by End User (Revenue and Volume) 2019 & 2032
- Table 320: Global Blood Glucose Monitoring Devices Industry Volume K Unit Forecast, by End User (Revenue and Volume) 2019 & 2032
- Table 321: Global Blood Glucose Monitoring Devices Industry Revenue Million Forecast, by Indicators (Revenue and Volume) 2019 & 2032
- Table 322: Global Blood Glucose Monitoring Devices Industry Volume K Unit Forecast, by Indicators (Revenue and Volume) 2019 & 2032
- Table 323: Global Blood Glucose Monitoring Devices Industry Revenue Million Forecast, by Country 2019 & 2032
- Table 324: Global Blood Glucose Monitoring Devices Industry Volume K Unit Forecast, by Country 2019 & 2032
- Table 325: Global Blood Glucose Monitoring Devices Industry Revenue Million Forecast, by Device (Revenue and Volume) 2019 & 2032
- Table 326: Global Blood Glucose Monitoring Devices Industry Volume K Unit Forecast, by Device (Revenue and Volume) 2019 & 2032
- Table 327: Global Blood Glucose Monitoring Devices Industry Revenue Million Forecast, by End User (Revenue and Volume) 2019 & 2032
- Table 328: Global Blood Glucose Monitoring Devices Industry Volume K Unit Forecast, by End User (Revenue and Volume) 2019 & 2032
- Table 329: Global Blood Glucose Monitoring Devices Industry Revenue Million Forecast, by Indicators (Revenue and Volume) 2019 & 2032
- Table 330: Global Blood Glucose Monitoring Devices Industry Volume K Unit Forecast, by Indicators (Revenue and Volume) 2019 & 2032
- Table 331: Global Blood Glucose Monitoring Devices Industry Revenue Million Forecast, by Country 2019 & 2032
- Table 332: Global Blood Glucose Monitoring Devices Industry Volume K Unit Forecast, by Country 2019 & 2032
- Table 333: Global Blood Glucose Monitoring Devices Industry Revenue Million Forecast, by Device (Revenue and Volume) 2019 & 2032
- Table 334: Global Blood Glucose Monitoring Devices Industry Volume K Unit Forecast, by Device (Revenue and Volume) 2019 & 2032
- Table 335: Global Blood Glucose Monitoring Devices Industry Revenue Million Forecast, by End User (Revenue and Volume) 2019 & 2032
- Table 336: Global Blood Glucose Monitoring Devices Industry Volume K Unit Forecast, by End User (Revenue and Volume) 2019 & 2032
- Table 337: Global Blood Glucose Monitoring Devices Industry Revenue Million Forecast, by Indicators (Revenue and Volume) 2019 & 2032
- Table 338: Global Blood Glucose Monitoring Devices Industry Volume K Unit Forecast, by Indicators (Revenue and Volume) 2019 & 2032
- Table 339: Global Blood Glucose Monitoring Devices Industry Revenue Million Forecast, by Country 2019 & 2032
- Table 340: Global Blood Glucose Monitoring Devices Industry Volume K Unit Forecast, by Country 2019 & 2032
- Table 341: Global Blood Glucose Monitoring Devices Industry Revenue Million Forecast, by Device (Revenue and Volume) 2019 & 2032
- Table 342: Global Blood Glucose Monitoring Devices Industry Volume K Unit Forecast, by Device (Revenue and Volume) 2019 & 2032
- Table 343: Global Blood Glucose Monitoring Devices Industry Revenue Million Forecast, by End User (Revenue and Volume) 2019 & 2032
- Table 344: Global Blood Glucose Monitoring Devices Industry Volume K Unit Forecast, by End User (Revenue and Volume) 2019 & 2032
- Table 345: Global Blood Glucose Monitoring Devices Industry Revenue Million Forecast, by Indicators (Revenue and Volume) 2019 & 2032
- Table 346: Global Blood Glucose Monitoring Devices Industry Volume K Unit Forecast, by Indicators (Revenue and Volume) 2019 & 2032
- Table 347: Global Blood Glucose Monitoring Devices Industry Revenue Million Forecast, by Country 2019 & 2032
- Table 348: Global Blood Glucose Monitoring Devices Industry Volume K Unit Forecast, by Country 2019 & 2032
- Table 349: Global Blood Glucose Monitoring Devices Industry Revenue Million Forecast, by Device (Revenue and Volume) 2019 & 2032
- Table 350: Global Blood Glucose Monitoring Devices Industry Volume K Unit Forecast, by Device (Revenue and Volume) 2019 & 2032
- Table 351: Global Blood Glucose Monitoring Devices Industry Revenue Million Forecast, by End User (Revenue and Volume) 2019 & 2032
- Table 352: Global Blood Glucose Monitoring Devices Industry Volume K Unit Forecast, by End User (Revenue and Volume) 2019 & 2032
- Table 353: Global Blood Glucose Monitoring Devices Industry Revenue Million Forecast, by Indicators (Revenue and Volume) 2019 & 2032
- Table 354: Global Blood Glucose Monitoring Devices Industry Volume K Unit Forecast, by Indicators (Revenue and Volume) 2019 & 2032
- Table 355: Global Blood Glucose Monitoring Devices Industry Revenue Million Forecast, by Country 2019 & 2032
- Table 356: Global Blood Glucose Monitoring Devices Industry Volume K Unit Forecast, by Country 2019 & 2032
- Table 357: Global Blood Glucose Monitoring Devices Industry Revenue Million Forecast, by Device (Revenue and Volume) 2019 & 2032
- Table 358: Global Blood Glucose Monitoring Devices Industry Volume K Unit Forecast, by Device (Revenue and Volume) 2019 & 2032
- Table 359: Global Blood Glucose Monitoring Devices Industry Revenue Million Forecast, by End User (Revenue and Volume) 2019 & 2032
- Table 360: Global Blood Glucose Monitoring Devices Industry Volume K Unit Forecast, by End User (Revenue and Volume) 2019 & 2032
- Table 361: Global Blood Glucose Monitoring Devices Industry Revenue Million Forecast, by Indicators (Revenue and Volume) 2019 & 2032
- Table 362: Global Blood Glucose Monitoring Devices Industry Volume K Unit Forecast, by Indicators (Revenue and Volume) 2019 & 2032
- Table 363: Global Blood Glucose Monitoring Devices Industry Revenue Million Forecast, by Country 2019 & 2032
- Table 364: Global Blood Glucose Monitoring Devices Industry Volume K Unit Forecast, by Country 2019 & 2032
- Table 365: Global Blood Glucose Monitoring Devices Industry Revenue Million Forecast, by Device (Revenue and Volume) 2019 & 2032
- Table 366: Global Blood Glucose Monitoring Devices Industry Volume K Unit Forecast, by Device (Revenue and Volume) 2019 & 2032
- Table 367: Global Blood Glucose Monitoring Devices Industry Revenue Million Forecast, by End User (Revenue and Volume) 2019 & 2032
- Table 368: Global Blood Glucose Monitoring Devices Industry Volume K Unit Forecast, by End User (Revenue and Volume) 2019 & 2032
- Table 369: Global Blood Glucose Monitoring Devices Industry Revenue Million Forecast, by Indicators (Revenue and Volume) 2019 & 2032
- Table 370: Global Blood Glucose Monitoring Devices Industry Volume K Unit Forecast, by Indicators (Revenue and Volume) 2019 & 2032
- Table 371: Global Blood Glucose Monitoring Devices Industry Revenue Million Forecast, by Country 2019 & 2032
- Table 372: Global Blood Glucose Monitoring Devices Industry Volume K Unit Forecast, by Country 2019 & 2032
- Table 373: By Device Blood Glucose Monitoring Devices Industry Revenue (Million) Forecast, by Application 2019 & 2032
- Table 374: By Device Blood Glucose Monitoring Devices Industry Volume (K Unit) Forecast, by Application 2019 & 2032
- Table 375: Global Blood Glucose Monitoring Devices Industry Revenue Million Forecast, by Device (Revenue and Volume) 2019 & 2032
- Table 376: Global Blood Glucose Monitoring Devices Industry Volume K Unit Forecast, by Device (Revenue and Volume) 2019 & 2032
- Table 377: Global Blood Glucose Monitoring Devices Industry Revenue Million Forecast, by End User (Revenue and Volume) 2019 & 2032
- Table 378: Global Blood Glucose Monitoring Devices Industry Volume K Unit Forecast, by End User (Revenue and Volume) 2019 & 2032
- Table 379: Global Blood Glucose Monitoring Devices Industry Revenue Million Forecast, by Indicators (Revenue and Volume) 2019 & 2032
- Table 380: Global Blood Glucose Monitoring Devices Industry Volume K Unit Forecast, by Indicators (Revenue and Volume) 2019 & 2032
- Table 381: Global Blood Glucose Monitoring Devices Industry Revenue Million Forecast, by Country 2019 & 2032
- Table 382: Global Blood Glucose Monitoring Devices Industry Volume K Unit Forecast, by Country 2019 & 2032
- Table 383: Global Blood Glucose Monitoring Devices Industry Revenue Million Forecast, by Device (Revenue and Volume) 2019 & 2032
- Table 384: Global Blood Glucose Monitoring Devices Industry Volume K Unit Forecast, by Device (Revenue and Volume) 2019 & 2032
- Table 385: Global Blood Glucose Monitoring Devices Industry Revenue Million Forecast, by End User (Revenue and Volume) 2019 & 2032
- Table 386: Global Blood Glucose Monitoring Devices Industry Volume K Unit Forecast, by End User (Revenue and Volume) 2019 & 2032
- Table 387: Global Blood Glucose Monitoring Devices Industry Revenue Million Forecast, by Indicators (Revenue and Volume) 2019 & 2032
- Table 388: Global Blood Glucose Monitoring Devices Industry Volume K Unit Forecast, by Indicators (Revenue and Volume) 2019 & 2032
- Table 389: Global Blood Glucose Monitoring Devices Industry Revenue Million Forecast, by Country 2019 & 2032
- Table 390: Global Blood Glucose Monitoring Devices Industry Volume K Unit Forecast, by Country 2019 & 2032
- Table 391: Global Blood Glucose Monitoring Devices Industry Revenue Million Forecast, by Device (Revenue and Volume) 2019 & 2032
- Table 392: Global Blood Glucose Monitoring Devices Industry Volume K Unit Forecast, by Device (Revenue and Volume) 2019 & 2032
- Table 393: Global Blood Glucose Monitoring Devices Industry Revenue Million Forecast, by End User (Revenue and Volume) 2019 & 2032
- Table 394: Global Blood Glucose Monitoring Devices Industry Volume K Unit Forecast, by End User (Revenue and Volume) 2019 & 2032
- Table 395: Global Blood Glucose Monitoring Devices Industry Revenue Million Forecast, by Indicators (Revenue and Volume) 2019 & 2032
- Table 396: Global Blood Glucose Monitoring Devices Industry Volume K Unit Forecast, by Indicators (Revenue and Volume) 2019 & 2032
- Table 397: Global Blood Glucose Monitoring Devices Industry Revenue Million Forecast, by Country 2019 & 2032
- Table 398: Global Blood Glucose Monitoring Devices Industry Volume K Unit Forecast, by Country 2019 & 2032
- Table 399: Global Blood Glucose Monitoring Devices Industry Revenue Million Forecast, by Device (Revenue and Volume) 2019 & 2032
- Table 400: Global Blood Glucose Monitoring Devices Industry Volume K Unit Forecast, by Device (Revenue and Volume) 2019 & 2032
- Table 401: Global Blood Glucose Monitoring Devices Industry Revenue Million Forecast, by End User (Revenue and Volume) 2019 & 2032
- Table 402: Global Blood Glucose Monitoring Devices Industry Volume K Unit Forecast, by End User (Revenue and Volume) 2019 & 2032
- Table 403: Global Blood Glucose Monitoring Devices Industry Revenue Million Forecast, by Indicators (Revenue and Volume) 2019 & 2032
- Table 404: Global Blood Glucose Monitoring Devices Industry Volume K Unit Forecast, by Indicators (Revenue and Volume) 2019 & 2032
- Table 405: Global Blood Glucose Monitoring Devices Industry Revenue Million Forecast, by Country 2019 & 2032
- Table 406: Global Blood Glucose Monitoring Devices Industry Volume K Unit Forecast, by Country 2019 & 2032
- Table 407: Global Blood Glucose Monitoring Devices Industry Revenue Million Forecast, by Device (Revenue and Volume) 2019 & 2032
- Table 408: Global Blood Glucose Monitoring Devices Industry Volume K Unit Forecast, by Device (Revenue and Volume) 2019 & 2032
- Table 409: Global Blood Glucose Monitoring Devices Industry Revenue Million Forecast, by End User (Revenue and Volume) 2019 & 2032
- Table 410: Global Blood Glucose Monitoring Devices Industry Volume K Unit Forecast, by End User (Revenue and Volume) 2019 & 2032
- Table 411: Global Blood Glucose Monitoring Devices Industry Revenue Million Forecast, by Indicators (Revenue and Volume) 2019 & 2032
- Table 412: Global Blood Glucose Monitoring Devices Industry Volume K Unit Forecast, by Indicators (Revenue and Volume) 2019 & 2032
- Table 413: Global Blood Glucose Monitoring Devices Industry Revenue Million Forecast, by Country 2019 & 2032
- Table 414: Global Blood Glucose Monitoring Devices Industry Volume K Unit Forecast, by Country 2019 & 2032
- Table 415: Global Blood Glucose Monitoring Devices Industry Revenue Million Forecast, by Device (Revenue and Volume) 2019 & 2032
- Table 416: Global Blood Glucose Monitoring Devices Industry Volume K Unit Forecast, by Device (Revenue and Volume) 2019 & 2032
- Table 417: Global Blood Glucose Monitoring Devices Industry Revenue Million Forecast, by End User (Revenue and Volume) 2019 & 2032
- Table 418: Global Blood Glucose Monitoring Devices Industry Volume K Unit Forecast, by End User (Revenue and Volume) 2019 & 2032
- Table 419: Global Blood Glucose Monitoring Devices Industry Revenue Million Forecast, by Indicators (Revenue and Volume) 2019 & 2032
- Table 420: Global Blood Glucose Monitoring Devices Industry Volume K Unit Forecast, by Indicators (Revenue and Volume) 2019 & 2032
- Table 421: Global Blood Glucose Monitoring Devices Industry Revenue Million Forecast, by Country 2019 & 2032
- Table 422: Global Blood Glucose Monitoring Devices Industry Volume K Unit Forecast, by Country 2019 & 2032
- Table 423: Global Blood Glucose Monitoring Devices Industry Revenue Million Forecast, by Device (Revenue and Volume) 2019 & 2032
- Table 424: Global Blood Glucose Monitoring Devices Industry Volume K Unit Forecast, by Device (Revenue and Volume) 2019 & 2032
- Table 425: Global Blood Glucose Monitoring Devices Industry Revenue Million Forecast, by End User (Revenue and Volume) 2019 & 2032
- Table 426: Global Blood Glucose Monitoring Devices Industry Volume K Unit Forecast, by End User (Revenue and Volume) 2019 & 2032
- Table 427: Global Blood Glucose Monitoring Devices Industry Revenue Million Forecast, by Indicators (Revenue and Volume) 2019 & 2032
- Table 428: Global Blood Glucose Monitoring Devices Industry Volume K Unit Forecast, by Indicators (Revenue and Volume) 2019 & 2032
- Table 429: Global Blood Glucose Monitoring Devices Industry Revenue Million Forecast, by Country 2019 & 2032
- Table 430: Global Blood Glucose Monitoring Devices Industry Volume K Unit Forecast, by Country 2019 & 2032
Frequently Asked Questions
1. What is the projected Compound Annual Growth Rate (CAGR) of the Blood Glucose Monitoring Devices Industry?
The projected CAGR is approximately 7.82%.
2. Which companies are prominent players in the Blood Glucose Monitoring Devices Industry?
Key companies in the market include Sinocare, Rossmax International Ltd, Trivida Functional Medicine, Abbott Diabetes Care, Self-monitoring Blood Glucose, Dexcom Inc, Continuous Glucose Monitoring Devices, Acon Laboratories Inc, Medtronic PLC, Agamatrix Inc, Medisana AG, Bionime Corporation, LifeScan, Roche Holding AG, Arkray Inc, Ascensia Diabetes Care.
3. What are the main segments of the Blood Glucose Monitoring Devices Industry?
The market segments include Device (Revenue and Volume), End User (Revenue and Volume), Indicators (Revenue and Volume).
4. Can you provide details about the market size?
The market size is estimated to be USD 22.78 Million as of 2022.
5. What are some drivers contributing to market growth?
Rising Prevalence of Cancer Worldwide; Technological Advancements in Diagnostic Testing; Increasing Demand for Point-of-care Treatment.
6. What are the notable trends driving market growth?
The Self-blood Glucose Monitoring Segment held the Highest Market Share in the Current Year.
7. Are there any restraints impacting market growth?
High Cost of Molecular Diagnostic Tests; Lack of Skilled Workforce and Stringent Regulatory Framework.
8. Can you provide examples of recent developments in the market?
October 2023: The Canadian government approved Dexcom's next-generation Dexcom G7 Continuous Glucose Monitoring System for Canadian type-1 diabetes patients.
9. What pricing options are available for accessing the report?
Pricing options include single-user, multi-user, and enterprise licenses priced at USD 4750, USD 5250, and USD 8750 respectively.
10. Is the market size provided in terms of value or volume?
The market size is provided in terms of value, measured in Million and volume, measured in K Unit.
11. Are there any specific market keywords associated with the report?
Yes, the market keyword associated with the report is "Blood Glucose Monitoring Devices Industry," which aids in identifying and referencing the specific market segment covered.
12. How do I determine which pricing option suits my needs best?
The pricing options vary based on user requirements and access needs. Individual users may opt for single-user licenses, while businesses requiring broader access may choose multi-user or enterprise licenses for cost-effective access to the report.
13. Are there any additional resources or data provided in the Blood Glucose Monitoring Devices Industry report?
While the report offers comprehensive insights, it's advisable to review the specific contents or supplementary materials provided to ascertain if additional resources or data are available.
14. How can I stay updated on further developments or reports in the Blood Glucose Monitoring Devices Industry?
To stay informed about further developments, trends, and reports in the Blood Glucose Monitoring Devices Industry, consider subscribing to industry newsletters, following relevant companies and organizations, or regularly checking reputable industry news sources and publications.
Methodology
Step 1 - Identification of Relevant Samples Size from Population Database


Step 2 - Approaches for Defining Global Market Size (Value, Volume* & Price*)

Note*: In applicable scenarios
Step 3 - Data Sources
Primary Research
- Web Analytics
- Survey Reports
- Research Institute
- Latest Research Reports
- Opinion Leaders
Secondary Research
- Annual Reports
- White Paper
- Latest Press Release
- Industry Association
- Paid Database
- Investor Presentations

Step 4 - Data Triangulation
Involves using different sources of information in order to increase the validity of a study
These sources are likely to be stakeholders in a program - participants, other researchers, program staff, other community members, and so on.
Then we put all data in single framework & apply various statistical tools to find out the dynamic on the market.
During the analysis stage, feedback from the stakeholder groups would be compared to determine areas of agreement as well as areas of divergence
