

Key Insights
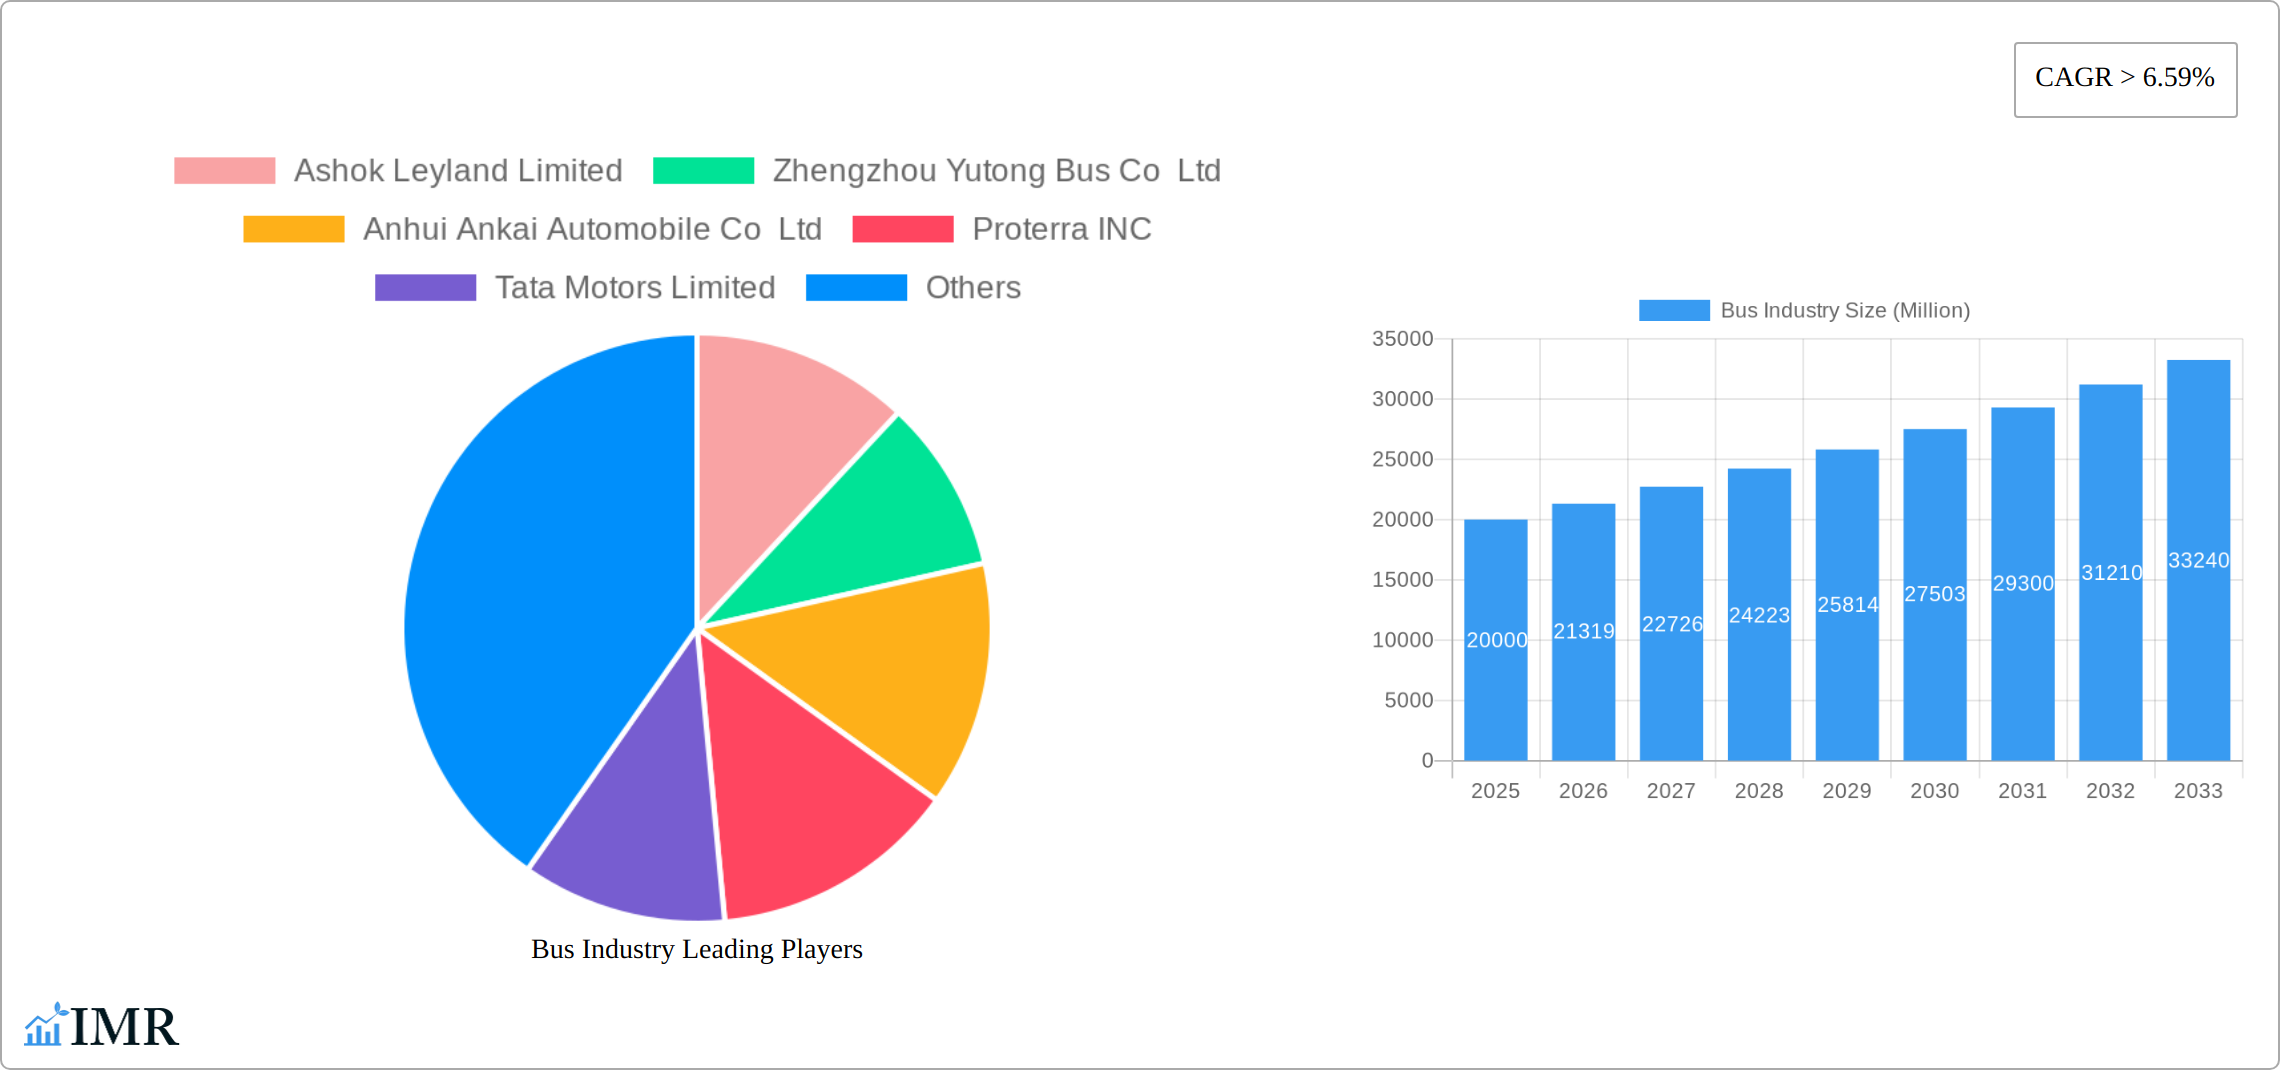
The global bus industry, currently valued at approximately $XX million (estimated based on available CAGR and market trends), is experiencing robust growth, projected to maintain a Compound Annual Growth Rate (CAGR) exceeding 6.59% from 2025 to 2033. This expansion is fueled by several key factors. Increasing urbanization and the consequent rise in public transportation demand are major drivers. Government initiatives promoting sustainable transportation, including significant investments in electric and hybrid bus fleets, are also significantly contributing to market growth. Furthermore, technological advancements in bus manufacturing, such as improved fuel efficiency, enhanced safety features (e.g., advanced driver-assistance systems), and the integration of intelligent transportation systems, are attracting both passengers and operators. The shift towards electric and hybrid propulsion systems is a defining trend, driven by environmental concerns and government regulations aimed at reducing carbon emissions.
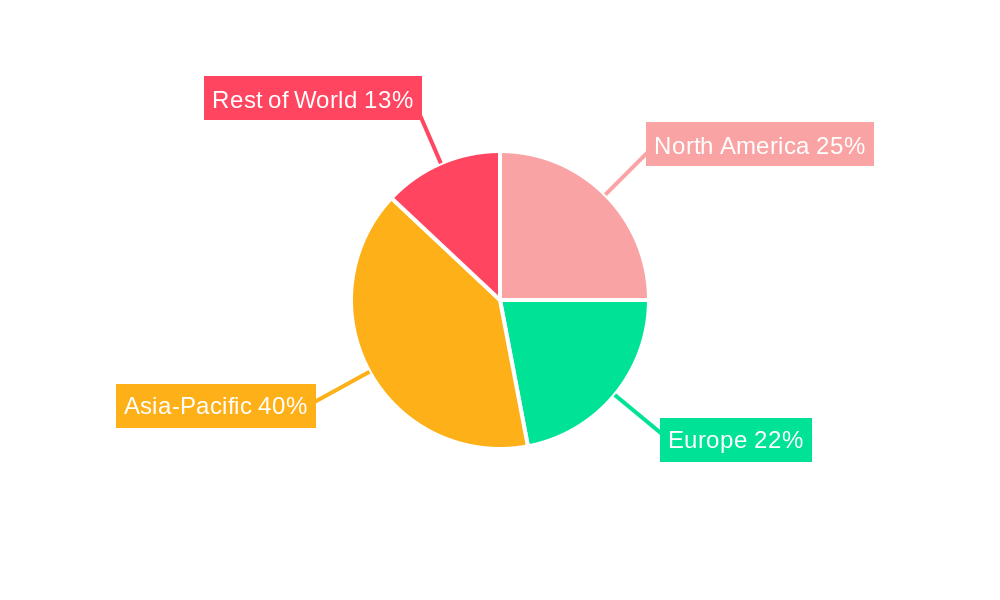
However, challenges remain. Fluctuations in raw material prices, particularly those impacting battery production for electric buses, pose a significant restraint. Supply chain disruptions and the overall economic climate can also impact production and sales. Despite these challenges, the long-term outlook remains positive, particularly for manufacturers specializing in sustainable, technologically advanced buses. Market segmentation by propulsion type (hybrid and electric) reveals a strong preference for environmentally friendly options, leading to substantial investment and innovation in this segment. Key players like Ashok Leyland Limited, BYD Auto Industry Company Limited, and Volvo Group are actively shaping the market through technological advancements and strategic expansions. The regional distribution of market share is likely influenced by factors such as government policies, infrastructure development, and the level of urbanization, with regions like North America and Europe expected to hold significant market shares due to robust public transportation systems and environmental regulations.
Comprehensive Bus Industry Market Report: 2019-2033
This in-depth report provides a comprehensive analysis of the global bus industry, encompassing market dynamics, growth trends, key players, and future opportunities. With a focus on the parent market (Bus Industry) and the child market (Hybrid and Electric Buses), this report offers invaluable insights for industry professionals, investors, and strategic decision-makers. The study period covers 2019-2033, with 2025 as the base year and forecast extending to 2033. Market values are presented in million units.
Bus Industry Market Dynamics & Structure
This section analyzes the competitive landscape, technological advancements, regulatory influences, and market evolution within the bus industry from 2019 to 2024. The report delves into market concentration, revealing the market share held by key players like Ashok Leyland Limited, Zhengzhou Yutong Bus Co Ltd, and others. It examines the impact of technological innovations, specifically in hybrid and electric vehicle propulsion, on market structure. Furthermore, the report explores the role of regulatory frameworks in shaping industry growth and the influence of mergers and acquisitions (M&A) activities. Quantitative insights, such as market share percentages and M&A deal volumes (xx million deals), are provided alongside qualitative factors like innovation barriers and competitive pressures.
- Market Concentration: Analysis of market share distribution among top players (e.g., Ashok Leyland Limited holding xx%, Zhengzhou Yutong Bus Co Ltd holding xx%).
- Technological Innovation Drivers: Detailed examination of the role of hybrid and electric vehicle technologies in driving market transformation.
- Regulatory Frameworks: Impact of emission regulations and safety standards on market dynamics.
- Competitive Product Substitutes: Assessment of alternative transportation solutions and their impact on market share.
- End-User Demographics: Analysis of evolving passenger preferences and their impact on bus design and operation.
- M&A Trends: Review of significant mergers and acquisitions, their motivations, and their impact on market consolidation.
Bus Industry Growth Trends & Insights
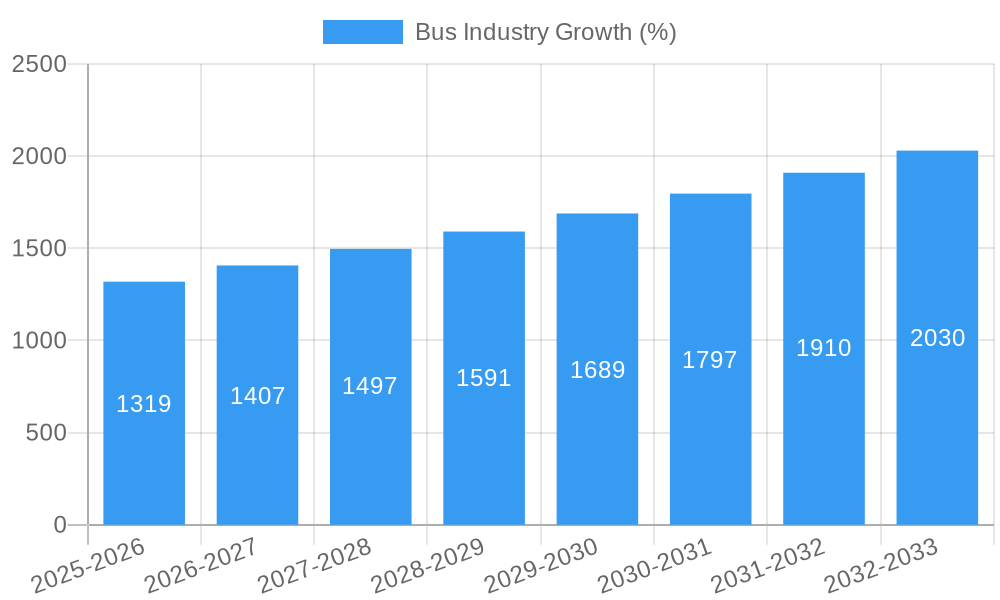
This section provides a detailed analysis of the bus industry's growth trajectory from 2019 to 2033, leveraging robust data and analytical frameworks. The analysis explores market size evolution, revealing a CAGR of xx% during the historical period (2019-2024) and a projected CAGR of xx% during the forecast period (2025-2033). It delves into adoption rates of hybrid and electric buses, assessing the factors driving market penetration and identifying technological disruptions that are reshaping the industry landscape. Consumer behavior shifts are also examined, focusing on evolving preferences for sustainable and technologically advanced transportation solutions.
Dominant Regions, Countries, or Segments in Bus Industry
This section identifies the leading regions, countries, or segments within the hybrid and electric bus market driving overall industry growth. Detailed analysis focuses on the factors contributing to market dominance in these regions, considering economic policies, infrastructure development, and government initiatives supporting electric mobility. Market share data and growth potential projections for each dominant region/segment are provided.
- Key Drivers: Detailed analysis of economic policies supporting electric vehicle adoption, investment in charging infrastructure, and government incentives.
- Dominance Factors: Assessment of market share, growth rates, and competitive intensity in leading regions/segments.
Bus Industry Product Landscape
This section provides a concise overview of product innovations, applications, and performance metrics within the bus industry. It highlights the unique selling propositions (USPs) of different bus models, emphasizing advancements in electric propulsion, safety features, and passenger comfort. The analysis covers the latest technological advancements and their impact on market competitiveness.
Key Drivers, Barriers & Challenges in Bus Industry
This section identifies the primary drivers and challenges impacting the bus industry.
Key Drivers:
- Technological advancements in battery technology and electric motor efficiency.
- Increasing concerns about environmental sustainability and air quality.
- Government regulations promoting the adoption of electric vehicles.
Key Challenges & Restraints:
- High initial investment costs associated with electric buses.
- Limited charging infrastructure in many regions.
- Supply chain disruptions impacting the availability of key components.
Emerging Opportunities in Bus Industry
This section explores untapped market potential and evolving consumer preferences.
- Growth in developing economies with expanding urban populations.
- Increasing demand for autonomous driving features in buses.
- Development of innovative financing models to reduce the cost barrier of electric bus adoption.
Growth Accelerators in the Bus Industry
Technological breakthroughs in battery technology, strategic partnerships fostering innovation, and expansion into new markets are pivotal growth catalysts. These advancements will drive efficiency gains, reduce operational costs, and unlock new market opportunities for bus manufacturers.
Key Players Shaping the Bus Industry Market
- Ashok Leyland Limited
- Zhengzhou Yutong Bus Co Ltd
- Anhui Ankai Automobile Co Ltd
- Proterra INC
- Tata Motors Limited
- Daimler Truck Holding AG
- Volvo Group
- NFI Group Inc
- King Long United Automotive Industry Co Ltd
- Byd Auto Industry Company Limited
- Zhongtong Bus Holding Co Ltd
Notable Milestones in Bus Industry Sector
- September 2023: Volvo Energy signed a letter of intent with Connected Energy to jointly develop a battery energy storage system (BESS). This collaboration signifies a move towards enhancing the grid stability and leveraging battery technology beyond bus applications.
- September 2023: Yutong announced the export of 87 apron buses to Saudi Arabia, the largest single export of apron buses from China. This highlights the growing international demand for Chinese-manufactured buses.
- September 2023: Daimler Trucks & Buses US, PACCAR, and Accelera by Cummins partnered to localize battery cell production in the U.S. This initiative will bolster the domestic supply chain for electric vehicle batteries.
In-Depth Bus Industry Market Outlook
The bus industry is poised for significant growth driven by the increasing adoption of electric vehicles, supported by government regulations and technological advancements. Strategic partnerships and expansion into new markets, particularly in developing economies, present substantial opportunities. The forecast period will witness substantial market expansion, driven by factors outlined in previous sections. This presents significant opportunities for companies to establish themselves as market leaders.
Bus Industry Segmentation
-
1. Propulsion Type
-
1.1. Hybrid and Electric Vehicles
-
1.1.1. By Fuel Category
- 1.1.1.1. BEV
- 1.1.1.2. FCEV
- 1.1.1.3. HEV
- 1.1.1.4. PHEV
-
1.1.1. By Fuel Category
- 1.2. ICE
-
1.1. Hybrid and Electric Vehicles
Bus Industry Segmentation By Geography
-
1. North America
- 1.1. United States
- 1.2. Canada
- 1.3. Mexico
-
2. South America
- 2.1. Brazil
- 2.2. Argentina
- 2.3. Rest of South America
-
3. Europe
- 3.1. United Kingdom
- 3.2. Germany
- 3.3. France
- 3.4. Italy
- 3.5. Spain
- 3.6. Russia
- 3.7. Benelux
- 3.8. Nordics
- 3.9. Rest of Europe
-
4. Middle East & Africa
- 4.1. Turkey
- 4.2. Israel
- 4.3. GCC
- 4.4. North Africa
- 4.5. South Africa
- 4.6. Rest of Middle East & Africa
-
5. Asia Pacific
- 5.1. China
- 5.2. India
- 5.3. Japan
- 5.4. South Korea
- 5.5. ASEAN
- 5.6. Oceania
- 5.7. Rest of Asia Pacific
Bus Industry REPORT HIGHLIGHTS
| Aspects | Details |
|---|---|
| Study Period | 2019-2033 |
| Base Year | 2024 |
| Estimated Year | 2025 |
| Forecast Period | 2025-2033 |
| Historical Period | 2019-2024 |
| Growth Rate | CAGR of > 6.59% from 2019-2033 |
| Segmentation |
|
Table of Contents
- 1. Introduction
- 1.1. Research Scope
- 1.2. Market Segmentation
- 1.3. Research Methodology
- 1.4. Definitions and Assumptions
- 2. Executive Summary
- 2.1. Introduction
- 3. Market Dynamics
- 3.1. Introduction
- 3.2. Market Drivers
- 3.2.1. Increasing Air Pollution Awareness and Health Concern is Driving the Demand
- 3.3. Market Restrains
- 3.3.1. High Cost of Installation Related to Industrial Robots
- 3.4. Market Trends
- 3.4.1. OTHER KEY INDUSTRY TRENDS COVERED IN THE REPORT
- 4. Market Factor Analysis
- 4.1. Porters Five Forces
- 4.2. Supply/Value Chain
- 4.3. PESTEL analysis
- 4.4. Market Entropy
- 4.5. Patent/Trademark Analysis
- 5. Global Bus Industry Analysis, Insights and Forecast, 2019-2031
- 5.1. Market Analysis, Insights and Forecast - by Propulsion Type
- 5.1.1. Hybrid and Electric Vehicles
- 5.1.1.1. By Fuel Category
- 5.1.1.1.1. BEV
- 5.1.1.1.2. FCEV
- 5.1.1.1.3. HEV
- 5.1.1.1.4. PHEV
- 5.1.1.1. By Fuel Category
- 5.1.2. ICE
- 5.1.1. Hybrid and Electric Vehicles
- 5.2. Market Analysis, Insights and Forecast - by Region
- 5.2.1. North America
- 5.2.2. South America
- 5.2.3. Europe
- 5.2.4. Middle East & Africa
- 5.2.5. Asia Pacific
- 5.1. Market Analysis, Insights and Forecast - by Propulsion Type
- 6. North America Bus Industry Analysis, Insights and Forecast, 2019-2031
- 6.1. Market Analysis, Insights and Forecast - by Propulsion Type
- 6.1.1. Hybrid and Electric Vehicles
- 6.1.1.1. By Fuel Category
- 6.1.1.1.1. BEV
- 6.1.1.1.2. FCEV
- 6.1.1.1.3. HEV
- 6.1.1.1.4. PHEV
- 6.1.1.1. By Fuel Category
- 6.1.2. ICE
- 6.1.1. Hybrid and Electric Vehicles
- 6.1. Market Analysis, Insights and Forecast - by Propulsion Type
- 7. South America Bus Industry Analysis, Insights and Forecast, 2019-2031
- 7.1. Market Analysis, Insights and Forecast - by Propulsion Type
- 7.1.1. Hybrid and Electric Vehicles
- 7.1.1.1. By Fuel Category
- 7.1.1.1.1. BEV
- 7.1.1.1.2. FCEV
- 7.1.1.1.3. HEV
- 7.1.1.1.4. PHEV
- 7.1.1.1. By Fuel Category
- 7.1.2. ICE
- 7.1.1. Hybrid and Electric Vehicles
- 7.1. Market Analysis, Insights and Forecast - by Propulsion Type
- 8. Europe Bus Industry Analysis, Insights and Forecast, 2019-2031
- 8.1. Market Analysis, Insights and Forecast - by Propulsion Type
- 8.1.1. Hybrid and Electric Vehicles
- 8.1.1.1. By Fuel Category
- 8.1.1.1.1. BEV
- 8.1.1.1.2. FCEV
- 8.1.1.1.3. HEV
- 8.1.1.1.4. PHEV
- 8.1.1.1. By Fuel Category
- 8.1.2. ICE
- 8.1.1. Hybrid and Electric Vehicles
- 8.1. Market Analysis, Insights and Forecast - by Propulsion Type
- 9. Middle East & Africa Bus Industry Analysis, Insights and Forecast, 2019-2031
- 9.1. Market Analysis, Insights and Forecast - by Propulsion Type
- 9.1.1. Hybrid and Electric Vehicles
- 9.1.1.1. By Fuel Category
- 9.1.1.1.1. BEV
- 9.1.1.1.2. FCEV
- 9.1.1.1.3. HEV
- 9.1.1.1.4. PHEV
- 9.1.1.1. By Fuel Category
- 9.1.2. ICE
- 9.1.1. Hybrid and Electric Vehicles
- 9.1. Market Analysis, Insights and Forecast - by Propulsion Type
- 10. Asia Pacific Bus Industry Analysis, Insights and Forecast, 2019-2031
- 10.1. Market Analysis, Insights and Forecast - by Propulsion Type
- 10.1.1. Hybrid and Electric Vehicles
- 10.1.1.1. By Fuel Category
- 10.1.1.1.1. BEV
- 10.1.1.1.2. FCEV
- 10.1.1.1.3. HEV
- 10.1.1.1.4. PHEV
- 10.1.1.1. By Fuel Category
- 10.1.2. ICE
- 10.1.1. Hybrid and Electric Vehicles
- 10.1. Market Analysis, Insights and Forecast - by Propulsion Type
- 11. Competitive Analysis
- 11.1. Global Market Share Analysis 2024
- 11.2. Company Profiles
- 11.2.1 Ashok Leyland Limited
- 11.2.1.1. Overview
- 11.2.1.2. Products
- 11.2.1.3. SWOT Analysis
- 11.2.1.4. Recent Developments
- 11.2.1.5. Financials (Based on Availability)
- 11.2.2 Zhengzhou Yutong Bus Co Ltd
- 11.2.2.1. Overview
- 11.2.2.2. Products
- 11.2.2.3. SWOT Analysis
- 11.2.2.4. Recent Developments
- 11.2.2.5. Financials (Based on Availability)
- 11.2.3 Anhui Ankai Automobile Co Ltd
- 11.2.3.1. Overview
- 11.2.3.2. Products
- 11.2.3.3. SWOT Analysis
- 11.2.3.4. Recent Developments
- 11.2.3.5. Financials (Based on Availability)
- 11.2.4 Proterra INC
- 11.2.4.1. Overview
- 11.2.4.2. Products
- 11.2.4.3. SWOT Analysis
- 11.2.4.4. Recent Developments
- 11.2.4.5. Financials (Based on Availability)
- 11.2.5 Tata Motors Limited
- 11.2.5.1. Overview
- 11.2.5.2. Products
- 11.2.5.3. SWOT Analysis
- 11.2.5.4. Recent Developments
- 11.2.5.5. Financials (Based on Availability)
- 11.2.6 Daimler Truck Holding AG
- 11.2.6.1. Overview
- 11.2.6.2. Products
- 11.2.6.3. SWOT Analysis
- 11.2.6.4. Recent Developments
- 11.2.6.5. Financials (Based on Availability)
- 11.2.7 Volvo Group
- 11.2.7.1. Overview
- 11.2.7.2. Products
- 11.2.7.3. SWOT Analysis
- 11.2.7.4. Recent Developments
- 11.2.7.5. Financials (Based on Availability)
- 11.2.8 NFI Group Inc
- 11.2.8.1. Overview
- 11.2.8.2. Products
- 11.2.8.3. SWOT Analysis
- 11.2.8.4. Recent Developments
- 11.2.8.5. Financials (Based on Availability)
- 11.2.9 King Long United Automotive Industry Co Ltd
- 11.2.9.1. Overview
- 11.2.9.2. Products
- 11.2.9.3. SWOT Analysis
- 11.2.9.4. Recent Developments
- 11.2.9.5. Financials (Based on Availability)
- 11.2.10 Byd Auto Industry Company Limited
- 11.2.10.1. Overview
- 11.2.10.2. Products
- 11.2.10.3. SWOT Analysis
- 11.2.10.4. Recent Developments
- 11.2.10.5. Financials (Based on Availability)
- 11.2.11 Zhongtong Bus Holding Co Ltd
- 11.2.11.1. Overview
- 11.2.11.2. Products
- 11.2.11.3. SWOT Analysis
- 11.2.11.4. Recent Developments
- 11.2.11.5. Financials (Based on Availability)
- 11.2.1 Ashok Leyland Limited
List of Figures
- Figure 1: Global Bus Industry Revenue Breakdown (Million, %) by Region 2024 & 2032
- Figure 2: North America Bus Industry Revenue (Million), by Propulsion Type 2024 & 2032
- Figure 3: North America Bus Industry Revenue Share (%), by Propulsion Type 2024 & 2032
- Figure 4: North America Bus Industry Revenue (Million), by Country 2024 & 2032
- Figure 5: North America Bus Industry Revenue Share (%), by Country 2024 & 2032
- Figure 6: South America Bus Industry Revenue (Million), by Propulsion Type 2024 & 2032
- Figure 7: South America Bus Industry Revenue Share (%), by Propulsion Type 2024 & 2032
- Figure 8: South America Bus Industry Revenue (Million), by Country 2024 & 2032
- Figure 9: South America Bus Industry Revenue Share (%), by Country 2024 & 2032
- Figure 10: Europe Bus Industry Revenue (Million), by Propulsion Type 2024 & 2032
- Figure 11: Europe Bus Industry Revenue Share (%), by Propulsion Type 2024 & 2032
- Figure 12: Europe Bus Industry Revenue (Million), by Country 2024 & 2032
- Figure 13: Europe Bus Industry Revenue Share (%), by Country 2024 & 2032
- Figure 14: Middle East & Africa Bus Industry Revenue (Million), by Propulsion Type 2024 & 2032
- Figure 15: Middle East & Africa Bus Industry Revenue Share (%), by Propulsion Type 2024 & 2032
- Figure 16: Middle East & Africa Bus Industry Revenue (Million), by Country 2024 & 2032
- Figure 17: Middle East & Africa Bus Industry Revenue Share (%), by Country 2024 & 2032
- Figure 18: Asia Pacific Bus Industry Revenue (Million), by Propulsion Type 2024 & 2032
- Figure 19: Asia Pacific Bus Industry Revenue Share (%), by Propulsion Type 2024 & 2032
- Figure 20: Asia Pacific Bus Industry Revenue (Million), by Country 2024 & 2032
- Figure 21: Asia Pacific Bus Industry Revenue Share (%), by Country 2024 & 2032
List of Tables
- Table 1: Global Bus Industry Revenue Million Forecast, by Region 2019 & 2032
- Table 2: Global Bus Industry Revenue Million Forecast, by Propulsion Type 2019 & 2032
- Table 3: Global Bus Industry Revenue Million Forecast, by Region 2019 & 2032
- Table 4: Global Bus Industry Revenue Million Forecast, by Propulsion Type 2019 & 2032
- Table 5: Global Bus Industry Revenue Million Forecast, by Country 2019 & 2032
- Table 6: United States Bus Industry Revenue (Million) Forecast, by Application 2019 & 2032
- Table 7: Canada Bus Industry Revenue (Million) Forecast, by Application 2019 & 2032
- Table 8: Mexico Bus Industry Revenue (Million) Forecast, by Application 2019 & 2032
- Table 9: Global Bus Industry Revenue Million Forecast, by Propulsion Type 2019 & 2032
- Table 10: Global Bus Industry Revenue Million Forecast, by Country 2019 & 2032
- Table 11: Brazil Bus Industry Revenue (Million) Forecast, by Application 2019 & 2032
- Table 12: Argentina Bus Industry Revenue (Million) Forecast, by Application 2019 & 2032
- Table 13: Rest of South America Bus Industry Revenue (Million) Forecast, by Application 2019 & 2032
- Table 14: Global Bus Industry Revenue Million Forecast, by Propulsion Type 2019 & 2032
- Table 15: Global Bus Industry Revenue Million Forecast, by Country 2019 & 2032
- Table 16: United Kingdom Bus Industry Revenue (Million) Forecast, by Application 2019 & 2032
- Table 17: Germany Bus Industry Revenue (Million) Forecast, by Application 2019 & 2032
- Table 18: France Bus Industry Revenue (Million) Forecast, by Application 2019 & 2032
- Table 19: Italy Bus Industry Revenue (Million) Forecast, by Application 2019 & 2032
- Table 20: Spain Bus Industry Revenue (Million) Forecast, by Application 2019 & 2032
- Table 21: Russia Bus Industry Revenue (Million) Forecast, by Application 2019 & 2032
- Table 22: Benelux Bus Industry Revenue (Million) Forecast, by Application 2019 & 2032
- Table 23: Nordics Bus Industry Revenue (Million) Forecast, by Application 2019 & 2032
- Table 24: Rest of Europe Bus Industry Revenue (Million) Forecast, by Application 2019 & 2032
- Table 25: Global Bus Industry Revenue Million Forecast, by Propulsion Type 2019 & 2032
- Table 26: Global Bus Industry Revenue Million Forecast, by Country 2019 & 2032
- Table 27: Turkey Bus Industry Revenue (Million) Forecast, by Application 2019 & 2032
- Table 28: Israel Bus Industry Revenue (Million) Forecast, by Application 2019 & 2032
- Table 29: GCC Bus Industry Revenue (Million) Forecast, by Application 2019 & 2032
- Table 30: North Africa Bus Industry Revenue (Million) Forecast, by Application 2019 & 2032
- Table 31: South Africa Bus Industry Revenue (Million) Forecast, by Application 2019 & 2032
- Table 32: Rest of Middle East & Africa Bus Industry Revenue (Million) Forecast, by Application 2019 & 2032
- Table 33: Global Bus Industry Revenue Million Forecast, by Propulsion Type 2019 & 2032
- Table 34: Global Bus Industry Revenue Million Forecast, by Country 2019 & 2032
- Table 35: China Bus Industry Revenue (Million) Forecast, by Application 2019 & 2032
- Table 36: India Bus Industry Revenue (Million) Forecast, by Application 2019 & 2032
- Table 37: Japan Bus Industry Revenue (Million) Forecast, by Application 2019 & 2032
- Table 38: South Korea Bus Industry Revenue (Million) Forecast, by Application 2019 & 2032
- Table 39: ASEAN Bus Industry Revenue (Million) Forecast, by Application 2019 & 2032
- Table 40: Oceania Bus Industry Revenue (Million) Forecast, by Application 2019 & 2032
- Table 41: Rest of Asia Pacific Bus Industry Revenue (Million) Forecast, by Application 2019 & 2032
Frequently Asked Questions
1. What is the projected Compound Annual Growth Rate (CAGR) of the Bus Industry?
The projected CAGR is approximately > 6.59%.
2. Which companies are prominent players in the Bus Industry?
Key companies in the market include Ashok Leyland Limited, Zhengzhou Yutong Bus Co Ltd, Anhui Ankai Automobile Co Ltd, Proterra INC, Tata Motors Limited, Daimler Truck Holding AG, Volvo Group, NFI Group Inc, King Long United Automotive Industry Co Ltd, Byd Auto Industry Company Limited, Zhongtong Bus Holding Co Ltd.
3. What are the main segments of the Bus Industry?
The market segments include Propulsion Type.
4. Can you provide details about the market size?
The market size is estimated to be USD XX Million as of 2022.
5. What are some drivers contributing to market growth?
Increasing Air Pollution Awareness and Health Concern is Driving the Demand.
6. What are the notable trends driving market growth?
OTHER KEY INDUSTRY TRENDS COVERED IN THE REPORT.
7. Are there any restraints impacting market growth?
High Cost of Installation Related to Industrial Robots.
8. Can you provide examples of recent developments in the market?
September 2023: Volvo Energy signed a letter of intent with Connected Energy with the ambition to jointly develop a battery energy storage system (BESS).September 2023: Yutong announced that it held a shipping ceremony for 87 apron buses exported from China to Saudi Arabia in the Yutong New Energy Plant. It is the largest batch of apron buses exported from China.September 2023: Daimler Trucks & Buses US, PACCAR, and Accelera by Cummins, the zero-emissions business unit of Cummins Inc., announced they are partnering to localize battery cell production in the U.S.
9. What pricing options are available for accessing the report?
Pricing options include single-user, multi-user, and enterprise licenses priced at USD 3800, USD 4500, and USD 5800 respectively.
10. Is the market size provided in terms of value or volume?
The market size is provided in terms of value, measured in Million.
11. Are there any specific market keywords associated with the report?
Yes, the market keyword associated with the report is "Bus Industry," which aids in identifying and referencing the specific market segment covered.
12. How do I determine which pricing option suits my needs best?
The pricing options vary based on user requirements and access needs. Individual users may opt for single-user licenses, while businesses requiring broader access may choose multi-user or enterprise licenses for cost-effective access to the report.
13. Are there any additional resources or data provided in the Bus Industry report?
While the report offers comprehensive insights, it's advisable to review the specific contents or supplementary materials provided to ascertain if additional resources or data are available.
14. How can I stay updated on further developments or reports in the Bus Industry?
To stay informed about further developments, trends, and reports in the Bus Industry, consider subscribing to industry newsletters, following relevant companies and organizations, or regularly checking reputable industry news sources and publications.
Methodology
Step 1 - Identification of Relevant Samples Size from Population Database


Step 2 - Approaches for Defining Global Market Size (Value, Volume* & Price*)

Note*: In applicable scenarios
Step 3 - Data Sources
Primary Research
- Web Analytics
- Survey Reports
- Research Institute
- Latest Research Reports
- Opinion Leaders
Secondary Research
- Annual Reports
- White Paper
- Latest Press Release
- Industry Association
- Paid Database
- Investor Presentations

Step 4 - Data Triangulation
Involves using different sources of information in order to increase the validity of a study
These sources are likely to be stakeholders in a program - participants, other researchers, program staff, other community members, and so on.
Then we put all data in single framework & apply various statistical tools to find out the dynamic on the market.
During the analysis stage, feedback from the stakeholder groups would be compared to determine areas of agreement as well as areas of divergence
